
The ASX 200 surged in one of its broadest single-session rallies of the year as a weaker-than-expected US jobs report overnight cast serious doubt on the Fed rate hike that markets had pencilled in before year-end, sending US bond yields and the US dollar sharply lower and triggering a powerful recovery in gold and mining stocks.
Be sure to click/scroll through for the usual reporting of the major sector and stock-specific moves, the broker responses to them, as well as all the key economic data in tonight's Evening Wrap. Also, I have detailed technical analysis on the Nasdaq Composite and the S&P/ASX 200 in today's ChartWatch.
Let’s dive in!
Today in Review
Name | Value | % Chg |
|---|---|---|
Major Indices | ||
| ASX 200 | 8,844.3 | +1.37% |
| All Ords | 9,048.3 | +1.32% |
| Small Ords | 3,439.8 | +1.26% |
| All Tech | 3,016.2 | +0.97% |
| Emerging Companies | 3,020.9 | +1.64% |
Currency | ||
| AUD/USD | 0.6948 | +0.37% |
US Futures | ||
| S&P 500 | 7,561.0 | +0.44% |
| Dow Jones | 53,297.0 | +0.21% |
| Nasdaq | 29,860.5 | +1.03% |
Name | Value | % Chg |
|---|---|---|
Sector | ||
| Health Care | 27,020.6 | +2.67% |
| Materials | 24,059.0 | +2.53% |
| Industrials | 8,468.6 | +1.14% |
| Financials | 9,401.8 | +1.10% |
| Consumer Staples | 13,137.8 | +0.97% |
| Consumer Discretionary | 3,914.8 | +0.85% |
| Real Estate | 3,629.6 | +0.28% |
| Information Technology | 1,786.8 | +0.26% |
| Communication Services | 1,602.5 | +0.21% |
| Energy | 9,457.4 | +0.00% |
| Utilities | 9,326.1 | -0.59% |
ASX 200 Intraday Chart
%20intraday%20chart_3%20Jul.png)
Markets
The S&P/ASX 200 (XJO) finished 119.9 points higher at 8,844.3, 1.4% from its session low and just 0.1% from its high. Reflecting the strength at benchmark level, in the broader-based S&P/ASX 300 (XKO) advancers beat decliners by a convincing 207 to 71.
For the week, the XJO finished up 80 points or 0.9% higher, 2.2% from its intraweek low and just 0.1% from its intraweek high.
The Gold Sub-Index (XGD) (+8.3%) recorded its second consecutive day of outsized gains, building on yesterday's recovery to deliver a two-session total return above 11% — a striking demonstration of just how high a beta play the sector has become on the gold price. The catalyst was a weaker-than-expected US non-farm payrolls report that cast doubt over the Fed rate hike markets had priced in before year-end; US bond yields fell and the US dollar weakened, removing the twin headwinds that had hammered gold for four months.
%20COMEX%20chart_3%20Jul.png)
Gold Futures (Front month, back-adjusted) COMEX
COMEX gold futures gained a further 1.6% to US$4,191/oz in Asian trade after rising 1.1% overnight, while COMEX silver futures surged 2.9% to US$62.84/oz.
Quarterly reports from several producers added a stock-specific layer to the rally — Catalyst Metals (CYL) (+19.2%), Genesis Minerals (GMD) (+16.7%), Northern Star Resources (NST) (+11.8%), Capricorn Metals (CMM) (+10.1%), and Evolution Mining (EVN) (+8.8%) all soared.
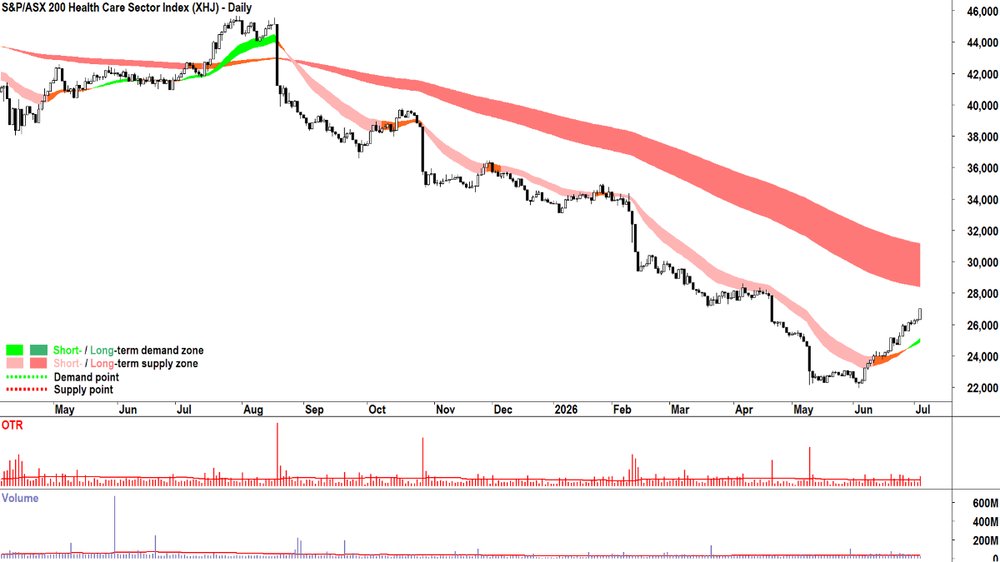
S&P-ASX 200 Health Care Sector Index
Health Care (XHJ) (+2.7%) caught another strong bid in what appears to be a sustained rotation into last financial year's worst-performing sector. Lower US bond yields improved valuations for long-duration healthcare earnings, but the scale and breadth of the buying looks increasingly like institutional reallocation at the start of the new financial year — investors rotating into so-called FY26 'dog' names in the hope they become FY27's darlings.
Materials (XMJ) (+2.5%) was boosted by both its gold constituency and a rebound in base metals, particularly copper. COMEX copper futures gained 1.2% to US$6.24/lb in Asian trade, lifting copper-exposed names. Firefly Metals (FFM) (+5.2%) and Sandfire Resources (SFR) (+3.9%) led the copper cohort.
Champion Iron (CIA) (+3.9%) also surged — caught up in the broad new-financial-year flows into mining rather than any specific news. BHP (BHP) (+1.6%) was also firmer as iron ore stocks were split, with Fortescue (FMG) (-3.2%) struggling after Bloomberg reported that China's state-backed iron ore buyer signalled plans to blacklist its Super Special Fines product from July 15. For the record, SGX iron ore futures fell 0.6% to US$97.85/t — nudging 3-month lows earlier in the session.
Financials (XFJ) (+1.1%) reversed recent weakness as the new financial year brought fresh institutional flows into an out-of-favour sector, with yesterday's Bank of America upgrade to NAB providing additional support. Notably, Commonwealth Bank (CBA) (+2.4%) led rather than lagged the major banks for the first time in weeks — a sign that the property market anxiety that had weighed on it specifically may be easing at the margin. Elsewhere in the sector, consumer-facing and funds management names were also strongly bid — HUB24 (HUB) (+6.4%), MA Financial (MAF) (+5.2%), Zip Co (ZIP) (+4.5%), and Netwealth (NWL) (+4.0%) were higher.
Consumer Discretionary (XDJ) (+0.9%) bounced from the weakness that followed Wednesday's bearish housing data — a sector acutely sensitive to housing market confidence given the weight of home improvement, appliances, and furnishing spending among its major constituents. Wesfarmers (WES) (+1.6%) recovered some of yesterday's Goldman Sachs downgrade losses, while Flight Centre Travel (FLT) (+1.5%), Super Retail Group (SUL) (+0.9%), and JB Hi-Fi (JBH) (+0.7%) were all firmer.
Utilities (XUJ) (-0.6%) was the session's only declining sector, and even that was largely attributable to a single stock — Origin Energy (ORG) (-1.1%), whose substantial LNG production exposure ties its performance closely to the energy sector rather than to the broader defensive characteristics of its utility peers.
Energy (XEJ) (0.0%) finished flat, with the sector's largest constituent Woodside Energy (WDS) (-0.6%) dragging against a strong session from Boss Energy (BOE) (+7.1%), which confirmed it had achieved FY26 production guidance. ICE Brent crude futures added 0.6% to US$72.26/bbl in Asian trade — not enough to bolster the sector.
Information Technology (XIJ) (+0.3%) eked out a marginal gain despite major Nasdaq-listed technology names falling overnight. The sector's three heavyweight constituents all advanced — Technology One (TNE) (+2.5%), WiseTech Global (WTC) (+1.9%), and Xero (XRO) (+1.4%) — suggesting the new financial year has brought some tentative re-engagement even with names that have been under sustained recent pressure (a bit of a theme!?).
In other commodities moves, GFEX lithium carbonate futures in China gained 2.4% to CNY 167,900/t and Australian spodumene concentrate gained 2.8% to US$2,380/t, closing out a week in which lithium prices swung sharply lower then recovered almost as sharply. Lithium stocks extended the week's recovery — Core Lithium (CXO) (+9.4%), Elevra Lithium (ELV) (+4.9%), Liontown Resources (LTR) (+2.1%), Mineral Resources (MIN) (+2.1%), Pilbara Minerals (PLS) (+1.9%), and IGO (IGO) (+1.2%) all advanced.
%20chart_3%20Jul.png)
Praseodymium-Neodymium Oxide (RMB-mt)
NdPr rare earth prices in China rose 1.0% to CNY 760,000/t. Lynas Rare Earths (LYC) (+2.2%) and Brazilian Rare Earths (BRE) (+0.4%) were both higher.
Today's best ASX Top 300 gainers
Company | Last Price | Change $ | Change % | 1mo % | 1yr % |
|---|---|---|---|---|---|
| Catalyst Metals (CYL) | $6.09 | +$0.98 | +19.2% | +10.3% | +13.6% |
| Genesis Minerals (GMD) | $6.29 | +$0.90 | +16.7% | +5.7% | +47.0% |
| Northern Star Resources (NST) | $22.16 | +$2.33 | +11.8% | +5.4% | +19.4% |
| Capricorn Metals (CMM) | $14.03 | +$1.29 | +10.1% | -1.1% | +48.6% |
| Core Lithium (CXO) | $0.29 | +$0.025 | +9.4% | -7.9% | +163.6% |
| Generation Development Group (GDG) | $4.06 | +$0.34 | +9.1% | -1.5% | -21.5% |
| Evolution Mining (EVN) | $12.82 | +$1.04 | +8.8% | +3.3% | +62.7% |
| Regis Resources (RRL) | $6.63 | +$0.50 | +8.2% | +4.9% | +46.4% |
| Vault Minerals (VAU) | $4.56 | +$0.34 | +8.1% | +4.1% | +73.2% |
| Ora Banda Mining (OBM) | $1.19 | +$0.085 | +7.7% | -13.1% | +63.0% |
| Perseus Mining (PRU) | $5.22 | +$0.35 | +7.2% | +0.6% | +49.1% |
| Ramelius Resources (RMS) | $3.21 | +$0.21 | +7.0% | -3.3% | +32.1% |
| Westgold Resources (WGX) | $5.08 | +$0.33 | +6.9% | -3.4% | +78.9% |
| Kingsgate Consolidated (KCN) | $5.24 | +$0.33 | +6.7% | -12.5% | +119.2% |
| Alkane Resources (ALK) | $1.44 | +$0.09 | +6.7% | -6.8% | +107.2% |
| HUB24 (HUB) | $81.04 | +$4.90 | +6.4% | -4.2% | -9.2% |
| Emerald Resources NL (EMR) | $5.70 | +$0.34 | +6.3% | -5.6% | +43.2% |
| Qualitas (QAL) | $3.07 | +$0.18 | +6.2% | +12.5% | -10.5% |
| Artrya (AYA) | $6.27 | +$0.36 | +6.1% | +34.0% | +683.8% |
| Regal Partners (RPL) | $3.11 | +$0.17 | +5.8% | +14.8% | +25.4% |
Today's worst ASX Top 300 losers
Company | Last Price | Change $ | Change % | 1mo % | 1yr % |
|---|---|---|---|---|---|
| PEXA Group (PXA) | $8.54 | -$2.31 | -21.3% | -19.1% | -33.3% |
| Macquarie Technology Group (MAQ) | $65.31 | -$4.19 | -6.0% | -14.2% | +0.6% |
| Echo IQ (EIQ) | $1.65 | -$0.10 | -5.7% | +20.4% | +560.0% |
| PYC Therapeutics (PYC) | $1.535 | -$0.08 | -5.0% | +16.3% | +19.1% |
| Suncorp Group (SUN) | $18.63 | -$0.72 | -3.7% | +8.3% | -10.5% |
| Digico Infrastructure REIT (DGT) | $2.41 | -$0.09 | -3.6% | -3.2% | -25.2% |
| Fortescue (FMG) | $18.36 | -$0.60 | -3.2% | -17.8% | +12.9% |
| Cuscal (CCL) | $4.98 | -$0.15 | -2.9% | +2.5% | +60.1% |
| Megaport (MP1) | $19.19 | -$0.56 | -2.8% | +19.6% | +45.2% |
| NEXTDC (NXT) | $13.41 | -$0.37 | -2.7% | -14.7% | -3.3% |
| Southern Cross Electrical Engineering (SXE) | $4.40 | -$0.12 | -2.7% | +3.8% | +144.4% |
| SKS Technologies Group (SKS) | $8.51 | -$0.23 | -2.6% | -9.1% | +344.4% |
| Judo Capital Holdings (JDO) | $0.88 | -$0.02 | -2.2% | -39.1% | -44.7% |
| The Lottery Corporation (TLC) | $5.48 | -$0.11 | -2.0% | +4.6% | +1.9% |
| Magellan Financial Group (MFG) | $10.63 | -$0.21 | -1.9% | +23.6% | +12.6% |
| MAAS Group Holdings (MGH) | $5.34 | -$0.10 | -1.8% | +6.0% | +28.4% |
| Telix Pharmaceuticals (TLX) | $16.88 | -$0.30 | -1.7% | +33.7% | -29.5% |
| Macmahon Holdings (MAH) | $0.875 | -$0.015 | -1.7% | -9.8% | +177.8% |
| GenusPlus Group (GNP) | $10.06 | -$0.17 | -1.7% | -2.0% | +143.0% |
| Graincorp (GNC) | $4.75 | -$0.08 | -1.7% | -3.3% | -37.5% |
Chartwatch
Nasdaq Composite Index
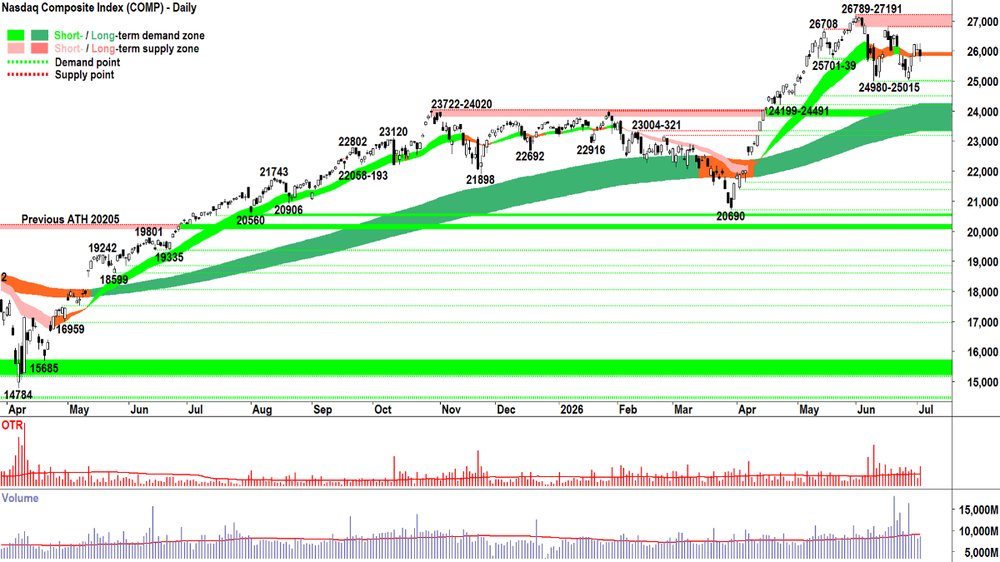
Nasdaq Composite Index chart
Analysis
You know how I’ve been maintaining my view that we’re a bit ‘stuck in the middle’ here on the Comp? That the previous +6,000 point demand side market (D > S = P ⬆️) was impacted in early June by S ⬆️ to put this market into a state of equilibrium: D = S = P ➡️.
We’ve seen demand side candles since then, some very convincing (e.g., 11-Jun, 15-Jun 🤯, 29-Jun and 30-Jun), but also some equally convincing supply side showings (e.g., 5-Jun, 10-Jun, 16-17-June blended, 23-Jun – but really, 22-23-Jun blended).
We have falling peaks (26789-27191) and rising troughs (24980-25015).
The short term trend ribbon has neutralised, now showing amber and flat.
It all fits together that investors are just as likely to want to buy as they are to sell in any given session.
Would we have said this prior to 27191? No! We would have said that investors are more likely to buy than sell… i.e., MOTN D > S = P ⬆️!
Which brings us to Thursday’s candle. A decent size as you can see from my Optimised True Range (OTR) indicator. 'Prices moved more than usual – that's important – take note!' is what the indicator is telling us.
It was black-bodied, sure, supply was the winner, and down from the previous close… S > D = P ⬇️
But look at those shadows: about the same size, pointing both upwards and downwards from the body!
Demand was in charge, likely early in the session (without seeing the intraday chart, I am assuming this, but given the shape of the candle – it’s a very good bet), then supply took over… It looked pretty darn bad at the low of the session – a substantial black candle… But despite how dire it looked – and with US markets closed Friday for Independence Day – demand still saw fit to take on risk and but into the close.
Now, they didn’t get all they way back to the open (black body, remember!), and they certainly fell well short of the session’s high… But they did put in a meaningful downward pointing shadow.
For those who need a little more help picturing the internals of Thursday’s candle (and this is an important skill to develop!), see below the intraday chart of the Comp courtesy of MarketWatch.
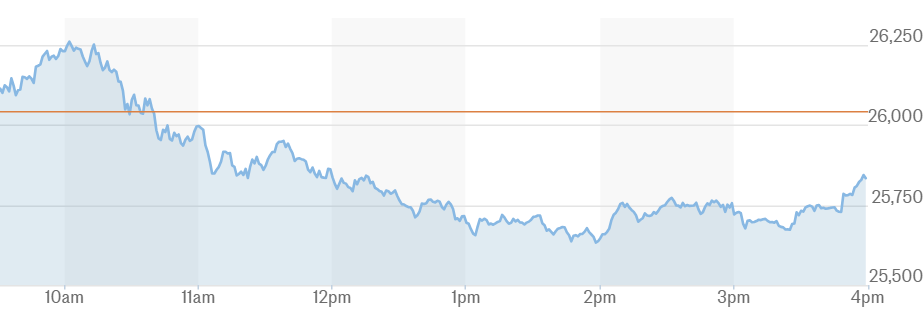
NASDAQ Composite Index intraday chart for Thursday 2 July. Source: MarketWatch
Anyways, my point is this: Thursday’s candle is the epitome of equilibrium. Of balance between demand and supply. It occurred roughly halfway between the 24980 and 27191 – another signal of balance, and while it adds little to the ‘MOTN ⬆️’ or ‘MOTN ⬇️’ scenarios we as trend traders love to trade… At ‘MOTN ➡️’ it still holds plenty of valuable information. ✅
I should also note the volume – yet another session below average. Both sides are growing less engaged… But this is not uncommon at this time of the year! The great US summer malaise! 🏖️
We’ll pick this discussion up on Tuesday. In the meantime… Analysis says MOTN ➡️. Accept says balance is required in terms of exposure. Act says… 👇
View
I am 1/2RP on the Comp ⚖️ (RP = Risk Position — it reflects my personal allowable capital allocation limit for my investments in US stocks. So 1/2RP is 50%, 2/3RP is 67% and FRP is 100% 🪣).
Key Levels
Dead simple! 26789-27191 is the key zone of supply vs 24980-25015 is the key zone of demand. In between = 1/2RP vs >= FRP and <= 1/3RP.
%20chart_3%20Jul.png)
S&P/ASX 200 (XJO) chart
Analysis
Yep, beats me.
No idea what happened today. 🤔
Off the hook Fund Flow Shenanigans!!!
Otherwise known as FFS! 🤦
Looking at today’s trade, it seems that all the stuff they didn’t want a few days ago… They were falling over themselves to buy today.
And yet, it is what it is. There’s no point whinging about it… Or bending one’s brain trying to understand it. 🤯
Because it won’t make a lick of difference to the market. Which is going to what it’s going to do – no matter what we think or how we Act.
The big question for us as risk managers is this: Do we buy into the FFS? Literally. Do we buy here? Do we add risk? 🤷
Your guess is as good as mine – but that is a very decent rally off the long term trend ribbon. And yesterday’s downward pointing shadow combines perfectly with today’s impeccable full-white bodied demand candle. ✅
It smacks of BTD + FOMO + HOFU = D > S = P ⬆️ in all its glory!
But this little black duck is a touch gun-shy when it comes to adding risk because of the last time I got all excited and did so at the 8984-9022 supply zone.
So, I’m gonna say: not today, but possibly, very soon. Let me see how the candles fall around 8984-9022 this time.
Strong demand side candles (i.e., those with full white bodies and or downward pointing shadows) closing at or very near that zone = ✅
Strong supply side candles (i.e., those with full black bodies and or upward pointing shadows) tipping the zone and close back below it = ❌
Well, that’s it for me this week: I’m cooked! I’m going to sit down have a nice cup of tea (or something a little stronger! 😉) Have a fantastic weekend everyone!
View
I am 1/2RP on the OTP ⚖️ (i.e., my personal allowable capital allocation limit for my investments in Australian stocks is 50%).
Key Levels
8984-9022 is the key zone of supply, while demand is at 8708-8656.
***CHARTWATCH LIVE WEBINARS 📺🍿***
The HORROR! Are ASX banks ANZ, CBA, NAB & WBC flagging major sell signals? (Plus the US tech bubble)
ChartWatch LIVE Webinar
ChartWatch LIVE Webinars – WEEKLY Wednesday's @ 12pm AEDT
Learn more about technical analysis and trend following through real case studies on ASX stocks. Australia's premier technical analyst, Carl Capolingua, shares his unique insights on stocks as requested by viewers. Ask about a company in your portfolio or anything related to trading and investing and get Carl's expert opinion.
Places are limited so >REGISTER NOW!<
Economy
Today
There weren't any major economic data releases in our time zone today
Later this week
Friday
ALL DAY USA Independence Day Holiday.
Interesting Movers
Trading higher
- Talga Group (TLG) $0.28+33.3%
Rose after it announced it has commenced commercial deliveries of its flagship battery graphite anode product Talnode®-C to customer Nyobolt under a binding offtake agreement; the balance of the 3,000-tonne offtake will be supplied from Talga’s planned commercial-scale anode plant, with construction targeted to commence in 2027 subject to final investment decision.
- Catalyst Metals (CYL) $6.09+19.2%
Rose after announcing quarterly gold production from the Plutonic Gold Belt of 31,812oz; FY26 production was 104koz, in line with guidance of 100,000oz to 110,000oz; cash and bullion A$323m at 30 June.
- Genesis Minerals (GMD) $6.29+16.7%
Rose after announcing June quarterly gold production of 70,767oz, taking FY26 production to 285,400oz; production and AISC within FY26 guidance of 260-290koz at A$2,500-2,700/oz; cash and equivalents A$520m at 30 June.
- Boss Energy (BOE) $1.29+8.4%
Rose after announcing it achieved its revised FY26 production guidance, producing 1.41M lbs U3O8 drummed during FY26, and is accelerating technical studies supporting future growth of Honeymoon.
- Vault Minerals (VAU) $4.56+8.1%
Rose after announcing Q4 gold production of 89,338 ounces and FY26 production of 336,540 ounces, meeting the company’s full-year guidance; finished FY26 with cash and bullion of $842 million.
Trading Lower
- PEXA Group (PXA) $8.54-21.3%
Fell after the NSW pricing regulator recommended a 20 per cent cut to its allowable revenue; draft recommendation from IPART would reduce PEXA Exchange’s regulated revenue by about $70 million over one year through lower transfer transaction fees, and the company is pushing for any fee reductions to be phased in over four years.
- Objective Corporation (OCL) $6.75-13.5%
Fell on continued negative reaction to the 1-June announcement that Defence Digital Group has not renewed the Objective ECM Upgrade and Support Program agreement that had been in place for over 25 years.
- Suncorp Group (SUN) $18.49-4.5%
Fell after providing an update on its FY27 reinsurance program placement and FY26 outlook; written premium growth was revised to 2.7% (vs prior 3%) citing a weak economy and a soft NZ commercial market and marginal reduction in demand in Australia; reaffirmed insurance trading ratio guidance but flagged investment income of $750m–$800m.
Broker Moves
Company | Broker | Action | Rating | Price Target |
|---|---|---|---|---|
AARAstral Resources NL | Canaccord Genuity | Retained | Speculative Buy | $0.95(from $1.20) |
AELAmplitude Energy | Macquarie | Retained | Outperform | $2.55 |
AMPAMP | UBS | Retained | Buy | $1.91(from $1.65) |
ASLAndean Silver | Canaccord Genuity | Retained | Speculative Buy | $4.70(from $6.00) |
AUCAusGold | Canaccord Genuity | Retained | Speculative Buy | $2.85(from $3.45) |
AUEAurum Resource | Canaccord Genuity | Retained | Speculative Buy | $1.40(from $1.80) |
AZYAntipa Minerals | Canaccord Genuity | Retained | Speculative Buy | $1.00(from $1.35) |
BGLBellevue Gold | Canaccord Genuity | Retained | Speculative Buy | $1.75(from $2.35) |
BPTBeach Energy | Macquarie | Retained | Underperform | $0.75 |
BTRBrightstar Resources | Canaccord Genuity | Retained | Speculative Buy | $2.20(from $2.85) |
CHNChalice Mining | Bell Potter | Retained | Speculative Buy | $4.00 |
| Canaccord Genuity | Retained | Speculative Buy | $2.75(from $3.40) | |
CMMCapricorn Metals | Canaccord Genuity | Retained | Buy | $15.85(from $19.85) |
CYLCatalyst Metals | Canaccord Genuity | Retained | Buy | $11.45(from $14.75) |
DOWDowner EDI | Macquarie | Retained | Outperform | $8.90(from $8.80) |
EMREmerald Resources NL | Canaccord Genuity | Retained | Buy | $6.90(from $8.20) |
EVNEvolution Mining | Canaccord Genuity | Downgraded | Hold(from Buy) | $12.50(from $15.75) |
GBMGBM Resources | Canaccord Genuity | Retained | Speculative Buy | $0.09 |
GDGGeneration Development Group | Bell Potter | Retained | Buy | $6.20 |
GG8Gorilla Gold Mines | Canaccord Genuity | Retained | Speculative Buy | $1.00 |
GGPGreatland Resources | Canaccord Genuity | Retained | Buy | $13.70(from $17.70) |
GMDGenesis Minerals | Canaccord Genuity | Retained | Buy | $8.75(from $9.70) |
GQGGQG Partners Inc. | Macquarie | Retained | Neutral | $1.40(from $1.65) |
| UBS | Retained | Buy | $2.00 | |
HUBHUB24 | Bell Potter | Retained | Buy | $110.00 |
| Macquarie | Upgraded | Outperform(from Neutral) | $96.25(from $94.50) | |
| UBS | Retained | Neutral | $86.00(from $91.00) | |
IAGInsurance Australia Group | Jarden | Downgraded | Neutral(from Overweight) | $8.00 |
IMRImricor Medical Systems Inc | Morgans | Retained | Speculative Buy | $2.94(from $2.61) |
KARKaroon Energy | Macquarie | Retained | Neutral | $1.48 |
KCNKingsgate Consolidated | Canaccord Genuity | Retained | Buy | $8.35(from $10.30) |
KLSKelsian Group | UBS | Retained | Buy | $5.50 |
L1GL1 Group | UBS | Retained | Neutral | $1.25 |
MADMader Group | Argonaut Securities | Initiated | Buy | $9.50 |
MAFMA Financial Group | UBS | Retained | Buy | $9.90(from $10.40) |
MAPMicroba Life Sciences | Morgans | Retained | Speculative Buy | $0.12(from $0.15) |
MFGMagellan Financial Group | Macquarie | Retained | Underperform | $7.40(from $7.65) |
| UBS | Retained | Neutral | $10.71(from $10.10) | |
MM8Medallion Metals | Canaccord Genuity | Retained | Speculative Buy | $0.85(from $1.10) |
MMAMaronan Metals | Morgans | Initiated | Speculative Buy | $0.66 |
MYXMayne Pharma Group | Canaccord Genuity | Downgraded | Speculative Buy(from Buy) | $3.83(from $6.10) |
NSTNorthern Star Resources | Citi | Retained | Buy | $29.70 |
NWLNetwealth Group | Bell Potter | Retained | Buy | $30.00 |
| Macquarie | Retained | Outperform | $30.50(from $27.90) | |
| UBS | Retained | Neutral | $24.45(from $27.00) | |
OBMOra Banda Mining | Canaccord Genuity | Retained | Buy | $1.75(from $2.25) |
OCLObjective Corporation | Morgan Stanley | Retained | Overweight | $16.00(from $21.30) |
PDIPredictive Discovery | Canaccord Genuity | Retained | Speculative Buy | $1.40(from $1.66) |
PMEPro Medicus | Citi | Retained | Buy | $240.00(from $245.00) |
PNIPinnacle Investment Management Group | UBS | Retained | Neutral | $18.00(from $16.75) |
PNRPantoro Gold | Canaccord Genuity | Retained | Speculative Buy | $4.50(from $7.35) |
PPEPeoplein | Morgans | Retained | Speculative Buy | $0.95 |
PPSPraemium | Bell Potter | Retained | Buy | $1.20 |
PPTPerpetual | Macquarie | Retained | Outperform | $21.60 |
PRUPerseus Mining | Canaccord Genuity | Retained | Buy | $7.30(from $8.80) |
PXAPEXA Group | JPMorgan | Downgraded | Neutral(from Overweight) | $10.50(from $14.00) |
QBEQBE Insurance Group | Jarden | Downgraded | Underweight(from Neutral) | $20.50(from $21.30) |
RMSRamelius Resources | Canaccord Genuity | Retained | Buy | $5.50(from $6.85) |
RPLRegal Partners | Bell Potter | Retained | Buy | $4.80(from $4.70) |
RRLRegis Resources | Canaccord Genuity | Retained | Buy | $7.35(from $8.70) |
RSGResolute Mining | Canaccord Genuity | Retained | Buy | $2.45(from $3.05) |
RXLRox Resources | Canaccord Genuity | Retained | Speculative Buy | $1.05(from $1.30) |
SGHSGH | Ord Minnett | Initiated | Buy | $55.00 |
SMISantana Minerals | Canaccord Genuity | Retained | Speculative Buy | $1.90(from $2.50) |
STNSaturn Metals | Canaccord Genuity | Retained | Speculative Buy | $0.95(from $1.15) |
SUNSuncorp Group | Bank of America | Downgraded | Underperform(from Buy) | $19.80(from $21.00) |
| Jarden | Downgraded | Neutral(from Overweight) | $19.70(from $19.10) | |
SYLSymal Group | Morgans | Retained | Buy | $3.40(from $3.35) |
TCGTuraco Gold | Canaccord Genuity | Retained | Speculative Buy | $1.15(from $1.80) |
TLCThe Lottery Corporation | CLSA | Downgraded | Hold(from Outperform) | $5.90 |
TLXTelix Pharmaceuticals | Citi | Retained | Buy | $32.00 |
TORTorque Metals | Canaccord Genuity | Retained | Speculative Buy | $0.55 |
TPGTPG Telecom | Morgan Stanley | Retained | Underweight | $3.50 |
TREToubani Resources Inc | Canaccord Genuity | Retained | Speculative Buy | $1.25(from $1.85) |
TSOTesoro Gold | Canaccord Genuity | Retained | Speculative Buy | $2.20(from $2.80) |
TTMTitan Minerals | Canaccord Genuity | Retained | Speculative Buy | $1.65(from $2.10) |
TTTTitomic | Ord Minnett | Initiated | Speculative Buy | $0.38 |
USLUnico Silver | Canaccord Genuity | Retained | Speculative Buy | $1.70(from $2.00) |
VAUVault Minerals | Canaccord Genuity | Retained | Buy | $5.75(from $7.40) |
VFYVitrafy Life Sciences | Ord Minnett | Retained | Speculative Buy | $4.20(from $2.40) |
WAFWest African Resources | Canaccord Genuity | Retained | Speculative Buy | $5.85(from $7.00) |
WGXWestgold Resources | Canaccord Genuity | Retained | Buy | $7.25(from $9.70) |
Scans
Top Gainers
Code | Company | Last | % Chg |
|---|---|---|---|
| BUY | Bounty Oil & Gas NL | $0.019 | +46.15% |
| PR2 | Piche Resources Ltd | $0.028 | +40.00% |
| TLG | Talga Group Ltd | $0.28 | +33.33% |
| ENN | Elanor Investors Group | $0.098 | +32.43% |
| TRJ | Trajan Group Holdings Ltd | $0.28 | +27.27% |
Top Fallers
Code | Company | Last | % Chg |
|---|---|---|---|
| RAN | Range International Ltd | $0.15 | -25.00% |
| OB1 | Orbminco Ltd | $0.011 | -21.43% |
| PXA | Pexa Group Ltd | $8.54 | -21.29% |
| SCP | Scalare Partners Holdings Ltd | $0.041 | -18.00% |
| WRX | Western Ridge Resources Ltd | $0.017 | -15.00% |
52 Week Highs
Code | Company | Last | % Chg |
|---|---|---|---|
| EMTDB | Emetals Ltd | $0.06 | +20.00% |
| 1CG | One Click Group Ltd | $0.014 | +16.67% |
| KAO | Kaoko Metals Ltd | $0.635 | +16.51% |
| KRR | King River Resources Ltd | $0.058 | +13.73% |
| SNX | Sierra Nevada Gold Inc | $0.08 | +9.59% |
52 Week Lows
Code | Company | Last | % Chg |
|---|---|---|---|
| OB1 | Orbminco Ltd | $0.011 | -21.43% |
| PXA | Pexa Group Ltd | $8.54 | -21.29% |
| SCP | Scalare Partners Holdings Ltd | $0.041 | -18.00% |
| MFOA | Milford Australian Absolute Growth Complex ETF | $9.85 | -12.44% |
| CVB | Curvebeam Ai Ltd | $0.018 | -10.00% |
Near Highs
Code | Company | Last | % Chg |
|---|---|---|---|
| CNEW | Vaneck China New Economy ETF | $8.28 | +0.49% |
| MYE | Mastermyne Group Ltd | $0.30 | -1.64% |
| HGBL | Betashares Global Shares Currency Hedged ETF | $84.37 | +0.08% |
| MQGPG | Macquarie Group Ltd | $104.70 | -0.13% |
| DGVA | Dimensional Global Value Trust - Active ETF | $30.24 | -0.46% |
Relative Strength Index (RSI) Oversold
Code | Company | Last | % Chg |
|---|---|---|---|
| INIF | Intelligent Investor Aus EQ Inc Fund - Active ETF | $2.70 | 0.00% |
| VBND | Vanguard Global Aggregate Bond INDEX (Hedged) ETF | $39.46 | -0.25% |
| WOR | Worley Ltd | $10.77 | -2.00% |
| DIFF | Perpetual Diversified Income Active ETF | $10.02 | 0.00% |
| ABB | Aussie Broadband Ltd | $4.77 | -2.45% |
