News | Market Wraps
Evening Wrap: ASX 200 gains on resurgent gold stocks, EVN, RMS & GMD best, as resources and energy sectors also gain
The S&P/ASX 200 closed 26.3 points higher, up 0.30%.

Mentioned
The S&P/ASX 200 closed 26.3 points higher, up 0.30%.
What’s at the top of the sector performance list? A welcome return by Resources (XJR) (+1.7%), largely supported by a strong gain in the Gold Sub-Index (XGD) (+3.2%). Commodities counterpart Energy (XEJ) (+0.8%) was also pretty good.
Be sure to click/scroll through for the usual reporting of the major sector and stock-specific moves, the broker responses to them, as well as all the key economic data in tonight's Evening Wrap.
Also, I have detailed technical analysis on the S&P/ASX 200 in today's ChartWatch.
Let's dive in!
Today in Review
Thu 06 Nov 25, 5:01pm (AEST)
Name | Value | % Chg |
|---|---|---|
Major Indices | ||
| ASX 200 | 8,827.9 | +0.29% |
| All Ords | 9,098.2 | +0.30% |
| Small Ords | 3,677.7 | +0.10% |
| All Tech | 3,881.2 | -0.37% |
| Emerging Companies | 2,787.3 | +0.42% |
Currency | ||
| AUD/USD | 0.651 | +0.06% |
US Futures | ||
| S&P 500 | 6,819.75 | -0.08% |
| Dow Jones | 47,397.0 | -0.08% |
| Nasdaq | 25,705.5 | -0.16% |
Name | Value | % Chg |
|---|---|---|
Sector | ||
| Materials | 19,150.2 | +1.40% |
| Energy | 8,680.3 | +0.78% |
| Health Care | 35,163.9 | +0.49% |
| Utilities | 9,915.8 | +0.42% |
| Consumer Staples | 11,681.3 | +0.05% |
| Communication Services | 1,834.8 | +0.02% |
| Industrials | 8,487.1 | -0.01% |
| Real Estate | 3,959.7 | -0.03% |
| Financials | 9,846.6 | -0.07% |
| Information Technology | 2,631.5 | -0.26% |
| Consumer Discretionary | 4,152.4 | -0.35% |
ChartWatch *LIVE* Webinar
ChartWatch *LIVE* Webinars – WEEKLY Wednesday's @ 12pm AEDT
Learn more about technical analysis and trend following through real case studies on ASX stocks. Australia's premier technical analyst, Carl Capolingua, shares his unique insights on stocks as requested by viewers. Ask about a company in your portfolio or anything related to trading and investing and get Carl's expert opinion.
Places are limited so >REGISTER NOW!<
Markets
%20intraday%20chart_6%20Nov.png)
ASX 200 Session Chart
The S&P/ASX 200 (XJO) finished points higher at 8,828.3, about smack–bang at the mid-point of the session's range (0.3% from its low and 0.33% from its high).
In the broader-based S&P/ASX 300 (XKO) advancers beat decliners by 165 to 112. Hardly a resounding vote of confidence – but it's the first positive skew this week (and that wasn’t roughly 2 down versus up!).
Fund flows: It could be just coincidental...🤔
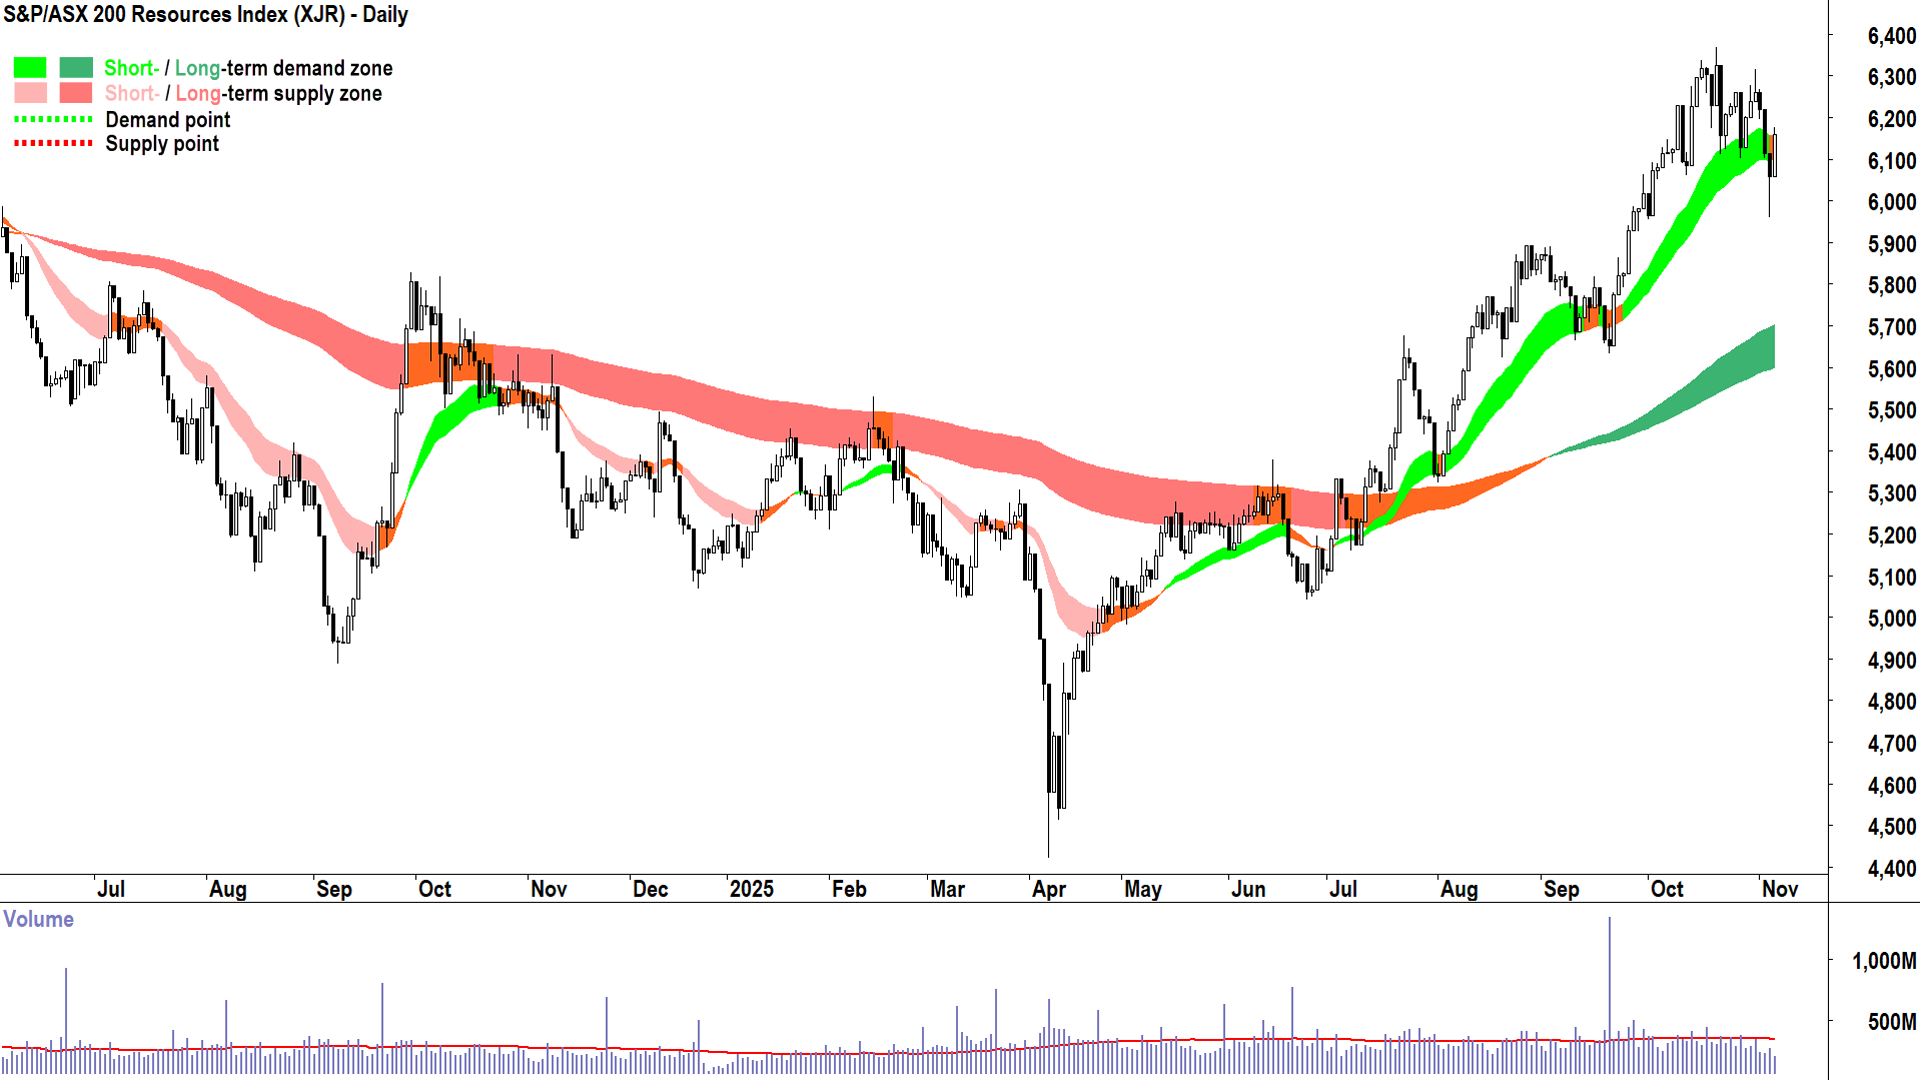
What’s at the top of the sector performance list? A welcome return by Resources (XJR) (+1.7%), largely supported by a strong gain in the Gold Sub-Index (XGD) (+3.2%). Commodities counterpart Energy (XEJ) (+0.8%) was also pretty good…
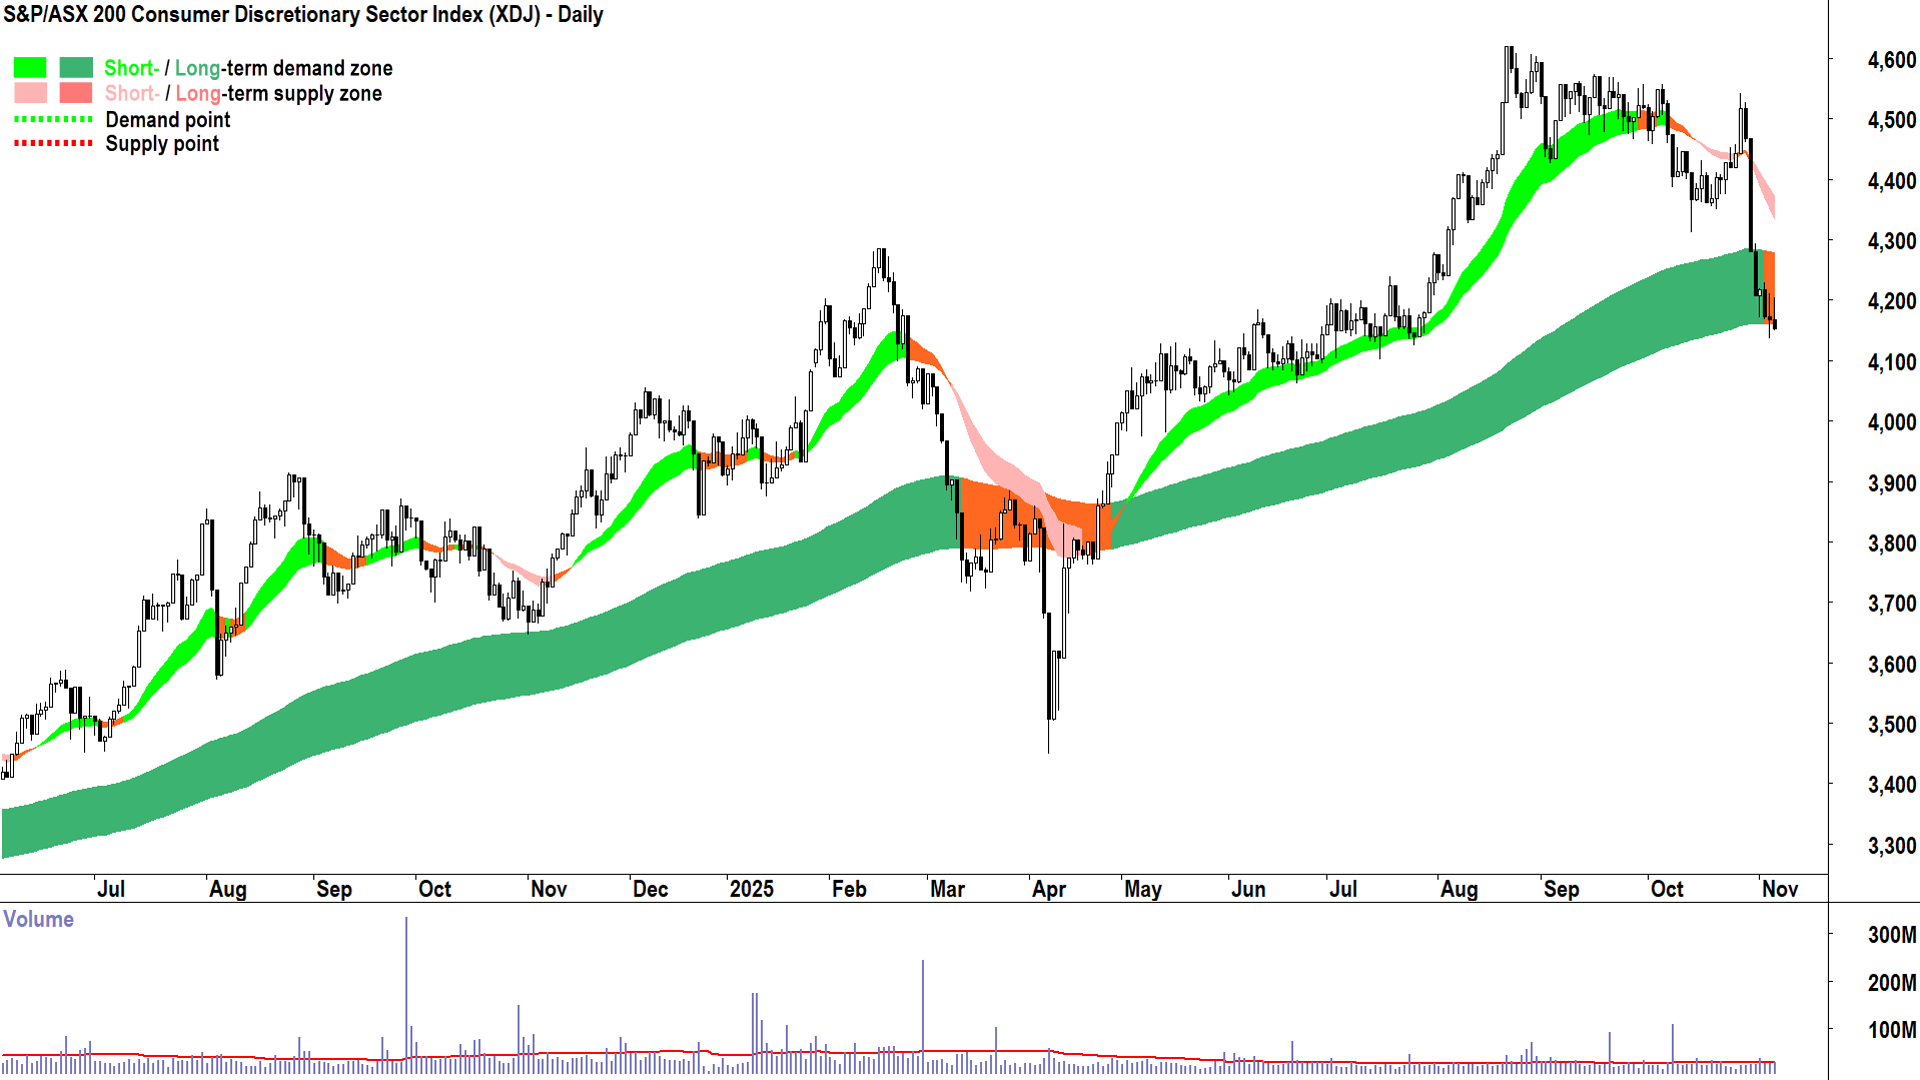
Now, if you’ve been suffering through my Evening Wraps for any length of time, you’ll know that in this section, I’ll usually associate strength in the above sectors with weakness in a particular group of other sectors… Oh, say: Financials (XFJ) (-0.1%), Information Technology (XIJ) (-0.3%), and Consumer Discretionary (XDJ) (-0.4%).
Now, it could be just coincidental – or it could be the usual “only so much to go around” fund flow shenanigans that we've come to love about the Old Tin Pot! 🤦

S&P/ASX 200 Resources Index chart (click here for full size image)
But, more seriously, I do believe that whilst resources stocks have cooled over the last couple of weeks (in the wake of the US-China trade deal which undid a few of the key driving themes that powered the sector prior to it) there remains a tendency among fund managers to rotate from “High P/E” to “Low P/E” and cyclicals.


S&P/ASX 200 Information Technology Sector Index (top) and S&P/ASX 200 Consumer Discretionary Sector Index (bottom) charts
Today appeared to have restarted that rotation – which I hope you'll agree – I called here well before the worst of the carnage in the charts above! 💪. But it’s one day, and one datapoint does not make a trend! (The rest of the sectors were somewhere in between the above mentioned bunch – and thoroughly uninteresting! 🥱).
Today's best blue chip gainers
Company | Last Price | Change $ | Change % | 1mo % | 1yr % |
|---|---|---|---|---|---|
Light & Wonder (LNW) | $124.85 | +$9.47 | +8.2% | +1.7% | -12.5% |
Ramelius Resources (RMS) | $3.38 | +$0.18 | +5.6% | -17.0% | +43.2% |
Amcor PLC (AMC) | $12.78 | +$0.61 | +5.0% | +4.8% | -18.1% |
Evolution Mining (EVN) | $10.73 | +$0.4 | +3.9% | -4.9% | +108.8% |
Genesis Minerals (GMD) | $5.88 | +$0.21 | +3.7% | -4.7% | +153.4% |
Vicinity Centres (VCX) | $2.53 | +$0.07 | +2.8% | 0% | +17.1% |
Newmont Corp. (NEM) | $125.78 | +$3.46 | +2.8% | -5.9% | +82.4% |
Northern Star Resources (NST) | $24.47 | +$0.67 | +2.8% | -1.1% | +37.9% |
Perseus Mining (PRU) | $4.78 | +$0.11 | +2.4% | -2.6% | +69.5% |
Rio Tinto (RIO) | $130.76 | +$2.92 | +2.3% | +4.4% | +9.2% |
GPT Group (GPT) | $5.40 | +$0.12 | +2.3% | -0.4% | +14.7% |
Fortescue (FMG) | $20.38 | +$0.41 | +2.1% | +6.1% | +6.0% |
CSL (CSL) | $179.49 | +$3.15 | +1.8% | -12.8% | -37.3% |
Bluescope Steel (BSL) | $22.14 | +$0.38 | +1.7% | +2.6% | +7.5% |
AMP (AMP) | $1.755 | +$0.03 | +1.7% | +6.4% | +21.0% |
QBE Insurance Group (QBE) | $19.81 | +$0.33 | +1.7% | -7.5% | +17.2% |
Woodside Energy Group (WDS) | $25.56 | +$0.4 | +1.6% | +12.1% | +6.6% |
BHP Group (BHP) | $43.00 | +$0.66 | +1.6% | +2.7% | +0.9% |
Insurance Australia Group (IAG) | $7.94 | +$0.12 | +1.5% | -4.8% | +7.3% |
Sandfire Resources (SFR) | $15.82 | +$0.22 | +1.4% | +0.1% | +53.1% |
Today's worst blue chip losers
Company | Last Price | Change $ | Change % | 1mo % | 1yr % |
|---|---|---|---|---|---|
James Hardie Industries (JHX) | $25.75 | -$3.73 | -12.7% | -22.5% | -46.7% |
Nextdc (NXT) | $15.12 | -$0.57 | -3.6% | -8.4% | -8.0% |
National Australia Bank (NAB) | $43.06 | -$1.47 | -3.3% | -3.0% | +11.2% |
JB HI-FI (JBH) | $97.65 | -$3.08 | -3.1% | -14.7% | +20.6% |
Telix Pharmaceuticals (TLX) | $15.16 | -$0.4 | -2.6% | -1.6% | -31.7% |
Netwealth Group (NWL) | $30.32 | -$0.67 | -2.2% | -1.0% | +7.0% |
IGO (IGO) | $4.96 | -$0.1 | -2.0% | -7.6% | -6.9% |
Lynas Rare Earths (LYC) | $13.14 | -$0.26 | -1.9% | -32.8% | +68.9% |
A2 Milk Company (A2M) | $9.42 | -$0.18 | -1.9% | +6.4% | +68.5% |
Goodman Group (GMG) | $30.71 | -$0.52 | -1.7% | -8.5% | -15.9% |
Pinnacle Investment Group (PNI) | $17.99 | -$0.29 | -1.6% | -2.2% | -10.0% |
Westpac Banking Corp. (WBC) | $39.71 | -$0.5 | -1.2% | +1.1% | +22.6% |
Seek (SEK) | $26.34 | -$0.32 | -1.2% | -5.7% | +6.5% |
Wesfarmers (WES) | $81.16 | -$0.97 | -1.2% | -6.4% | +23.7% |
Steadfast Group (SDF) | $5.20 | -$0.06 | -1.1% | -13.6% | -3.9% |
Pilbara Minerals (PLS) | $2.95 | -$0.03 | -1.0% | +9.3% | 0% |
Worley (WOR) | $13.81 | -$0.14 | -1.0% | -2.8% | -0.9% |
Car Group (CAR) | $34.56 | -$0.34 | -1.0% | -5.9% | -9.9% |
REA Group (REA) | $211.21 | -$1.97 | -0.9% | -4.0% | -9.4% |
Hub24 (HUB) | $113.59 | -$0.99 | -0.9% | +9.4% | +63.2% |
ChartWatch
S&P/ASX 200 (XJO)
%20chart_6%20Nov.png)
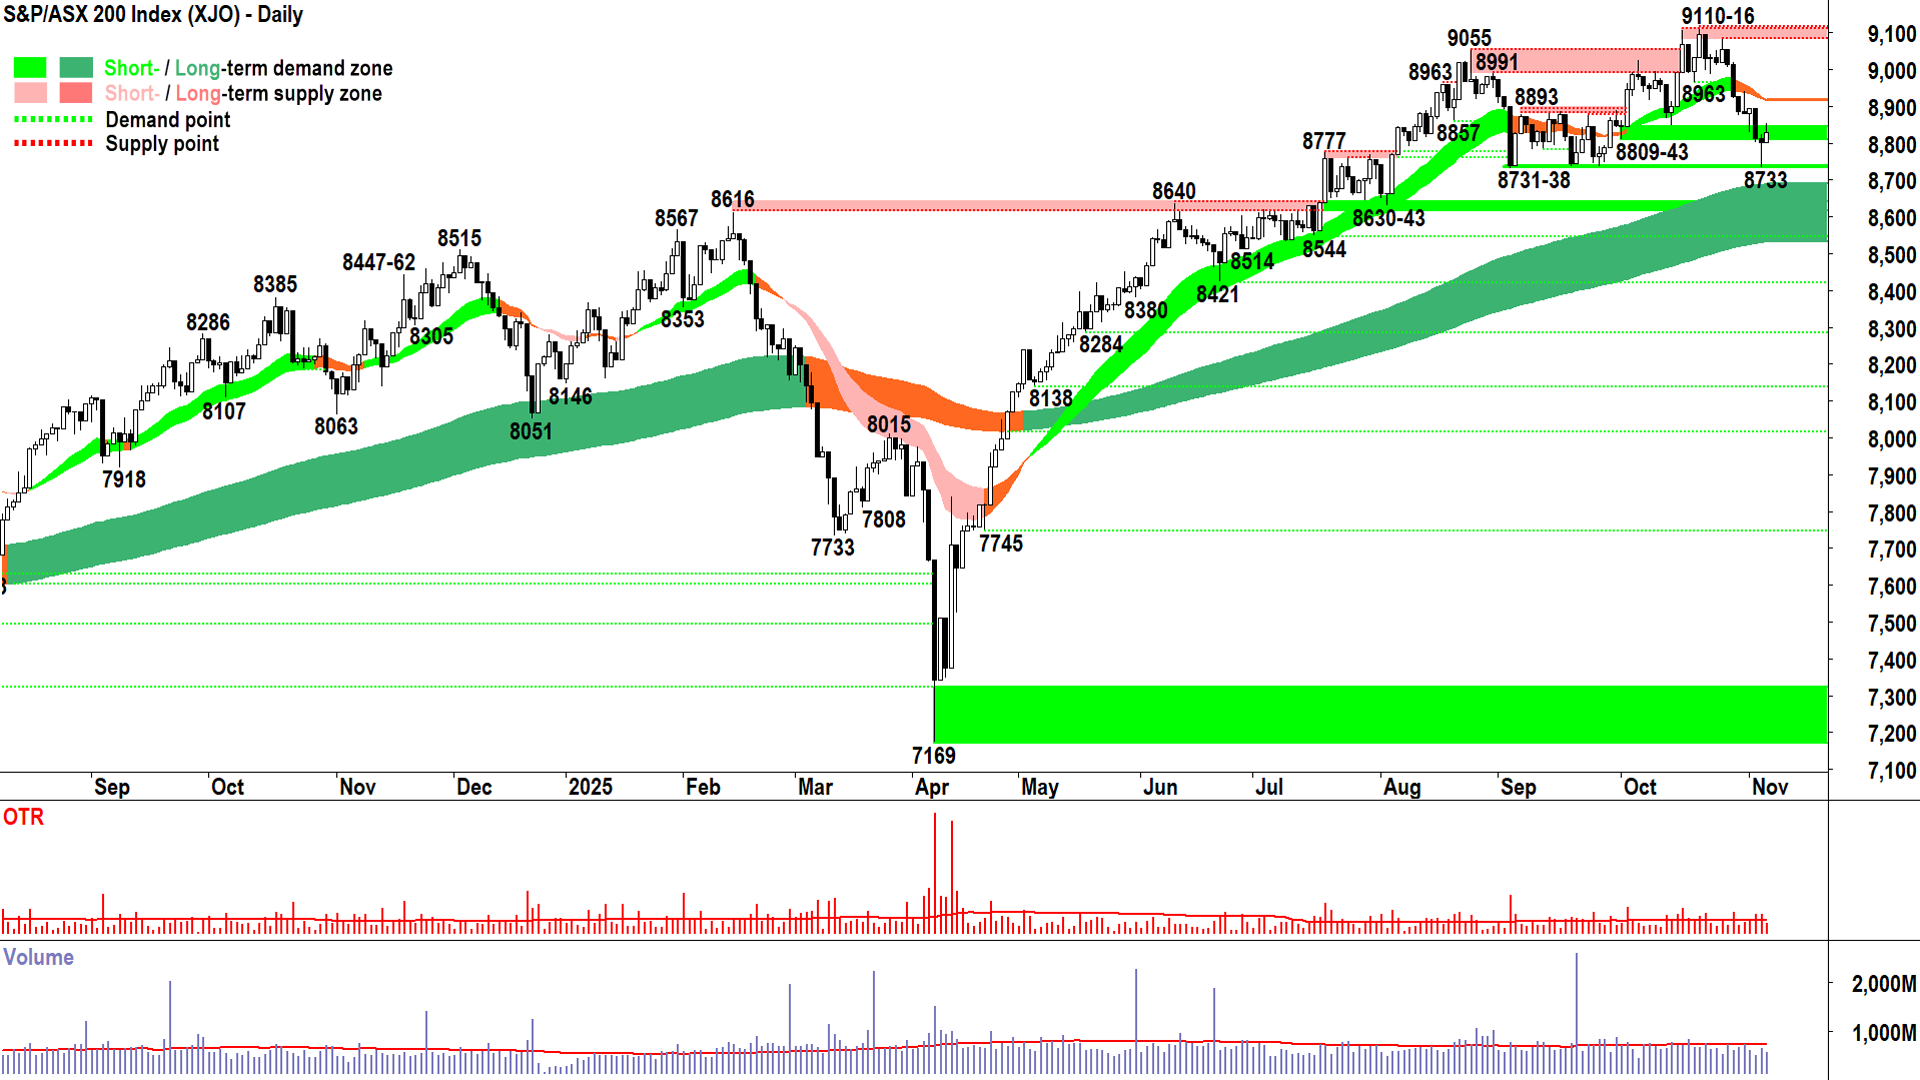
S&P/ASX 200 chart (click here for full size image)
Not the resounding follow-through from yesterday’s downward pointing shadow – a shadow that perfectly tickled the critical 8731-38 demand zone – but I think we’ll all happily take it!
For now, because we also all know that a quick bounce is a good bounce. The stronger and sharper the bounce – the more likely it is to reignite FOMO among the demand-side and reignite the dream of achieving a substantially better price among the supply-side.
FOMO among the demand-side.
The hope / expectation that a better price will be obtained by holding among the supply-side.
What do these two driving forces create? 🤔
GREATER DEMAND + LESSER SUPPLY = P⬆️
The longer the price sags and or bumbles along, the more market participants are going to accept lower prices as the norm. There won’t be any desperation to buy (i.e., to demand), but there will be less incentive to hold (i.e., to increase supply).
Therefore, I suggest the next few candles, and the price action they create – will be crucial in determining just how “sticky” 9110-16 is.
Today’s a start (small white body… but still an upward pointing shadow!!!). Along with yesterday’s long downward pointing shadow – it’s at least something in the right direction for the demand side!
View: I remain at 2/3RP (2/3 Risk Position = My personal allowable capital allocation limit for my investments in Australian stocks is 67%).
Key levels: 8831 is the next key level that the price must not cross to maintain any semblance this is still a short term uptrend! A move to 1/2RP on a close below there; A close above the short term uptrend ribbon (presently 8915-8918) would help confirm the demand-side remains active in the system.
Economy
Today
There weren't any major economic data releases in our time zone today
Later this week
Thursday
02:00 USA October ISM Services PMI (50..8 forecast vs 50.0 previous)
Friday
No major economic announcements expected this day
Saturday
USA tentative due to US government shutdown – Core PCE Price Index m/m
USA tentative due to US government shutdown – Non-Farm Employment Change
Latest News
Interesting Movers
Trading higher
+19.2% Caprice Resources (CRS) - RC Drilling set to start at Croydon Gold Project, general strength across the broader Precious Metals sector today, rise is consistent with prevailing short and long term uptrends, a regular in ChartWatch ASX Scans Uptrends list 🔎📈
+18.9% Toubani Resources (TRE) - Mali Operations Update, general strength across the broader Precious Metals sector today.
+17.5% G50 Corp (G50) - No news, general strength across the broader Precious Metals sector today, rise is consistent with prevailing short and long term uptrends, a regular in ChartWatch ASX Scans Uptrends list 🔎📈
+15.8% EQ Resources (EQR) - No news.
+14.0% Focus Minerals (FML) - No news, general strength across the broader Precious Metals sector today, rise is consistent with prevailing short and long term uptrends, a regular in ChartWatch ASX Scans Uptrends list 🔎📈
+13.6% Challenger Gold (CEL) - No news, general strength across the broader Precious Metals sector today.
+11.4% Australian Rare Earths (AR3) - No news.
+11.1% Core Lithium (CXO) - No news, rise is consistent with prevailing short term uptrend and long term trend is transitioning from down to up, a recent regular in ChartWatch ASX Scans Uptrends list 🔎📈
+10.7% Minerals 260 (MI6) - No news since 05-Nov Drilling Extends Mineralisation at Depth & Along Strike, general strength across the broader Precious Metals sector today.
+10.7% Bisalloy Steel Group (BIS) - Chair's Address to Shareholders.
+9.6% Blinklab (BB1) - No news, rise is consistent with prevailing short and long term uptrends, a recent regular in ChartWatch ASX Scans Uptrends list 🔎📈
+9.4% Polymetals Resources (POL) - Operations Resume at Endeavor Mine, general strength across the broader Precious Metals sector today.
+9.1% Torque Metals (TOR) - No news, general strength across the broader Precious Metals sector today.
+8.2% Light & Wonder (LNW) - Earnings Presentation.
+7.9% Santana Minerals (SMI) - Twenty-Five Year Mining Permit Granted for BOGP, general strength across the broader Precious Metals sector today.
+7.5% Meeka Metals (MEK) - No news, general strength across the broader Precious Metals sector today.
+7.0% Andean Silver (ASL) - No news, general strength across the broader Precious Metals sector today.
+6.7% Emerald Resources (EMR) - No news, general strength across the broader Precious Metals sector today.
Trading lower
-12.7% James Hardie Industries (JHX) - Response to ASX Price Query, fall is consistent with prevailing short and long term downtrends, a regular in ChartWatch ASX Scans Downtrends list 🔎📉
-11.7% Droneshield (DRO) - No news, general weakness across the broader Defence sector today.
-10.4% Neuren Pharmaceuticals (NEU) - Record DAYBUE net sales of US$101.1 million in Q3 2025.
-9.4% Veem (VEE) - Launch of VEEM Extreme Range.
-7.6% Elsight (ELS) - No news, general weakness across the broader Defence sector today.
-7.5% Southern Cross Gold Consolidated (SX2) - Continued negative response to 05-Nov Southern Cross Gold Announces Michael Frame as CFO.
-6.8% Aura Energy (AEE) - Swedish Parliament votes to overturn uranium mining ban, general weakness across the broader Uranium sector today.
-6.2% Electro Optic Systems Holdings (EOS) - No news, general weakness across the broader Defence sector today.
-5.7% G8 Education (GEM) - Continued negative response to 04-Nov FY25 Trading Update, fall is consistent with prevailing short and long term downtrends, a regular in ChartWatch ASX Scans Downtrends list 🔎📉
-5.5% Cettire (CTT) - No news, fall is consistent with prevailing long term downtrend 🔎📉
-5.5% Adairs (ADH) - No news, fall is consistent with prevailing short and long term downtrends, a regular in ChartWatch ASX Scans Downtrends list 🔎📉
-5.4% IPH (IPH) - Andrew Blattman to retire as Chief Executive Officer, fall is consistent with prevailing short and long term downtrends, a regular in ChartWatch ASX Scans Downtrends list 🔎📉
-5.0% Bannerman Energy (BMN) - Change of Director's Interest Notice (on-market trade – sale of $5.25 million worth of shares), general weakness across the broader Uranium sector today.
-4.8% Audinate Group (AD8) - No news, fall is consistent with prevailing short and long term downtrends, one of the most Featured (highest conviction) stocks in ChartWatch ASX Scans Downtrends list 🔎📉
-4.5% Metal Powder Works (MPW) - MPW expects USD1-2m of sales with Hardchrome, fall is consistent with prevailing short and long term downtrends, a recent regular in ChartWatch ASX Scans Downtrends list 🔎📉
-4.5% Paladin Energy (PDN) - No news, general weakness across the broader Uranium sector today.
Broker Moves
Alpha HPA (A4N)
Retained at speculative buy at Bell Potter; Price Target: $2.00
ALS (ALQ)
Upgraded to buy from neutral at Bank of America; Price Target: $25.00 from $18.00
Retained at buy at Bell Potter; Price Target: $23.50 from $19.70
Amcor Plc (AMC)
Retained at sector perform at RBC Capital Markets; Price Target: $13.60
Black Cat Syndicate (BC8)
Initiated at buy at Moelis Australia; Price Target: $1.60
Catapult Sports (CAT)
Upgraded to buy from hold at Bell Potter; Price Target: $7.50
Challenger (CGF)
Retained at underweight at Morgan Stanley; Price Target: $7.00
Retained at buy at UBS; Price Target: $11.00
Goodman Group (GMG)
Retained at buy at Bell Potter; Price Target: $40.25 from $40.75
Upgraded to buy from neutral at UBS; Price Target: $36.41 from $36.63
hipages Group Holdings (HPG)
Retained at speculative buy at E&P; Price Target: $2.14
Hansen Technologies (HSN)
Retained at buy at Shaw and Partners; Price Target: $7.60 from $7.30
Humm Group (HUM)
Retained at buy at Shaw and Partners; Price Target: $0.80
IDP Education (IEL)
Retained at buy at UBS; Price Target: $7.80
Imdex (IMD)
Retained at neutral at Macquarie; Price Target: $3.65
Imricor Medical Systems Inc (IMR)
Retained at speculative buy at Morgans; Price Target: $2.22
Monadelphous Group (MND)
Downgraded to underperform from buy at Bank of America; Price Target: $19.50 from $16.85
Medibank Private (MPL)
Retained at neutral at UBS; Price Target: $5.35
National Australia Bank (NAB)
Retained at neutral at UBS; Price Target: $37.50
Nanosonics (NAN)
Retained at sell at Bell Potter; Price Target: $4.10
Nido Education (NDO)
Retained at buy at Shaw and Partners; Price Target: $0.90 from $1.30
NEXTDC (NXT)
Retained at buy at Citi; Price Target: $18.35
Peoplein (PPE)
Initiated at buy at Canaccord Genuity; Price Target: $1.45
PEXA Group (PXA)
Retained at outperform at Macquarie; Price Target: $19.10
Retained at buy at UBS; Price Target: $17.45
REA Group (REA)
Retained at neutral at Citi; Price Target: $279.25
Ramelius Resources (RMS)
Retained at buy at Morgans; Price Target: $4.50 from $5.00
Santos (STO)
Retained at equal-weight at Morgan Stanley; Price Target: $6.76
Suncorp Group (SUN)
Retained at neutral at Macquarie; Price Target: $20.60
Worley (WOR)
Downgraded to neutral from buy at Bank of America; Price Target: $14.80 from $17.00
Scans
Top Gainers
Code | Company | Last | % Chg |
|---|---|---|---|
| HIQ | HITIQ Ltd | $0.028 | +86.67% |
| TAS | Tasman Resources Ltd | $0.025 | +38.89% |
| ZNO | ZOONO Group Ltd | $0.063 | +36.96% |
| XPN | Xpon Technologies Group Ltd | $0.018 | +28.57% |
| HCL | Highcom Ltd | $0.285 | +26.67% |
Top Fallers
Code | Company | Last | % Chg |
|---|---|---|---|
| BEO | Beonic Ltd | $0.135 | -22.86% |
| KEY | KEY Petroleum Ltd | $0.058 | -20.55% |
| IMC | Immuron Ltd | $0.068 | -20.00% |
| DTI | DTI Group Ltd | $0.017 | -19.05% |
| GRV | Greenvale Energy Ltd | $0.045 | -18.18% |
52 Week Highs
Code | Company | Last | % Chg |
|---|---|---|---|
| FLC | Fluence Corporation Ltd | $0.12 | +20.00% |
| CRS | Caprice Resources Ltd | $0.155 | +19.23% |
| FSA | FSA Group Ltd | $1.30 | +18.18% |
| TNY | Tinybeans Group Ltd | $0.16 | +14.29% |
| FML | Focus Minerals Ltd | $2.77 | +13.99% |
52 Week Lows
Code | Company | Last | % Chg |
|---|---|---|---|
| BEO | Beonic Ltd | $0.135 | -22.86% |
| TZN | Terramin Australia Ltd | $0.033 | -15.39% |
| JHX | James Hardie Industries Plc | $25.75 | -12.65% |
| MAP | Microba Life Sciences Ltd | $0.072 | -6.49% |
| BKT | Black Rock Mining Ltd | $0.016 | -5.88% |
Near Highs
Code | Company | Last | % Chg |
|---|---|---|---|
| PCI | Perpetual Credit Income Trust | $1.20 | 0.00% |
| WVOL | Ishares MSCI World Ex Aust Minimum Volatility ETF | $44.54 | -0.05% |
| IAGPF | Insurance Australia Group Ltd | $105.99 | +0.39% |
| VVLU | Vanguard Global Value Equity Active ETF | $77.50 | +0.77% |
| IHD | Ishares S&P/ASX DIV Opportunities Esg Screened ETF | $16.41 | +0.68% |
Relative Strength Index (RSI) Oversold
Code | Company | Last | % Chg |
|---|---|---|---|
| IPX | Iperionx Ltd | $5.85 | -2.66% |
| SVM | Sovereign Metals Ltd | $0.565 | -2.59% |
| PME | Pro Medicus Ltd | $253.90 | -0.26% |
| OML | Ooh!Media Ltd | $1.34 | -1.11% |
| GMG | Goodman Group | $30.71 | -1.67% |
