ChartWatch Markets: It really doesn't get more crucial than this for gold and silver markets, as the Nasdaq faces its own big test
Technical analysis of the most important global stock indices, commodities, bonds, FX, and crypto impacting your ASX portfolio each day.


Source: Shutterstock
Mentioned
KEY POINTS
- Gold and silver bull markets are facing a major test as "animal spirits" cool from the inferno that engulfed them in September and October – driving exponential moves in their price charts. It's a binary bet from here, says our technical analysis expert.
- The Nasdaq Composite – the most influential risk-on equities index in the world – has stalled over the past few trading sessions. Amidst calls of overvaluation and talks of a “bubble” that’s about to burst, we check on the latest trends and price action.
In today's edition of ChartWatch Markets, we'll be covering the technicals for:
Nasdaq Composite
Gold Futures (Front month, back-adjusted) COMEX
Silver Futures (Front month, back-adjusted) COMEX
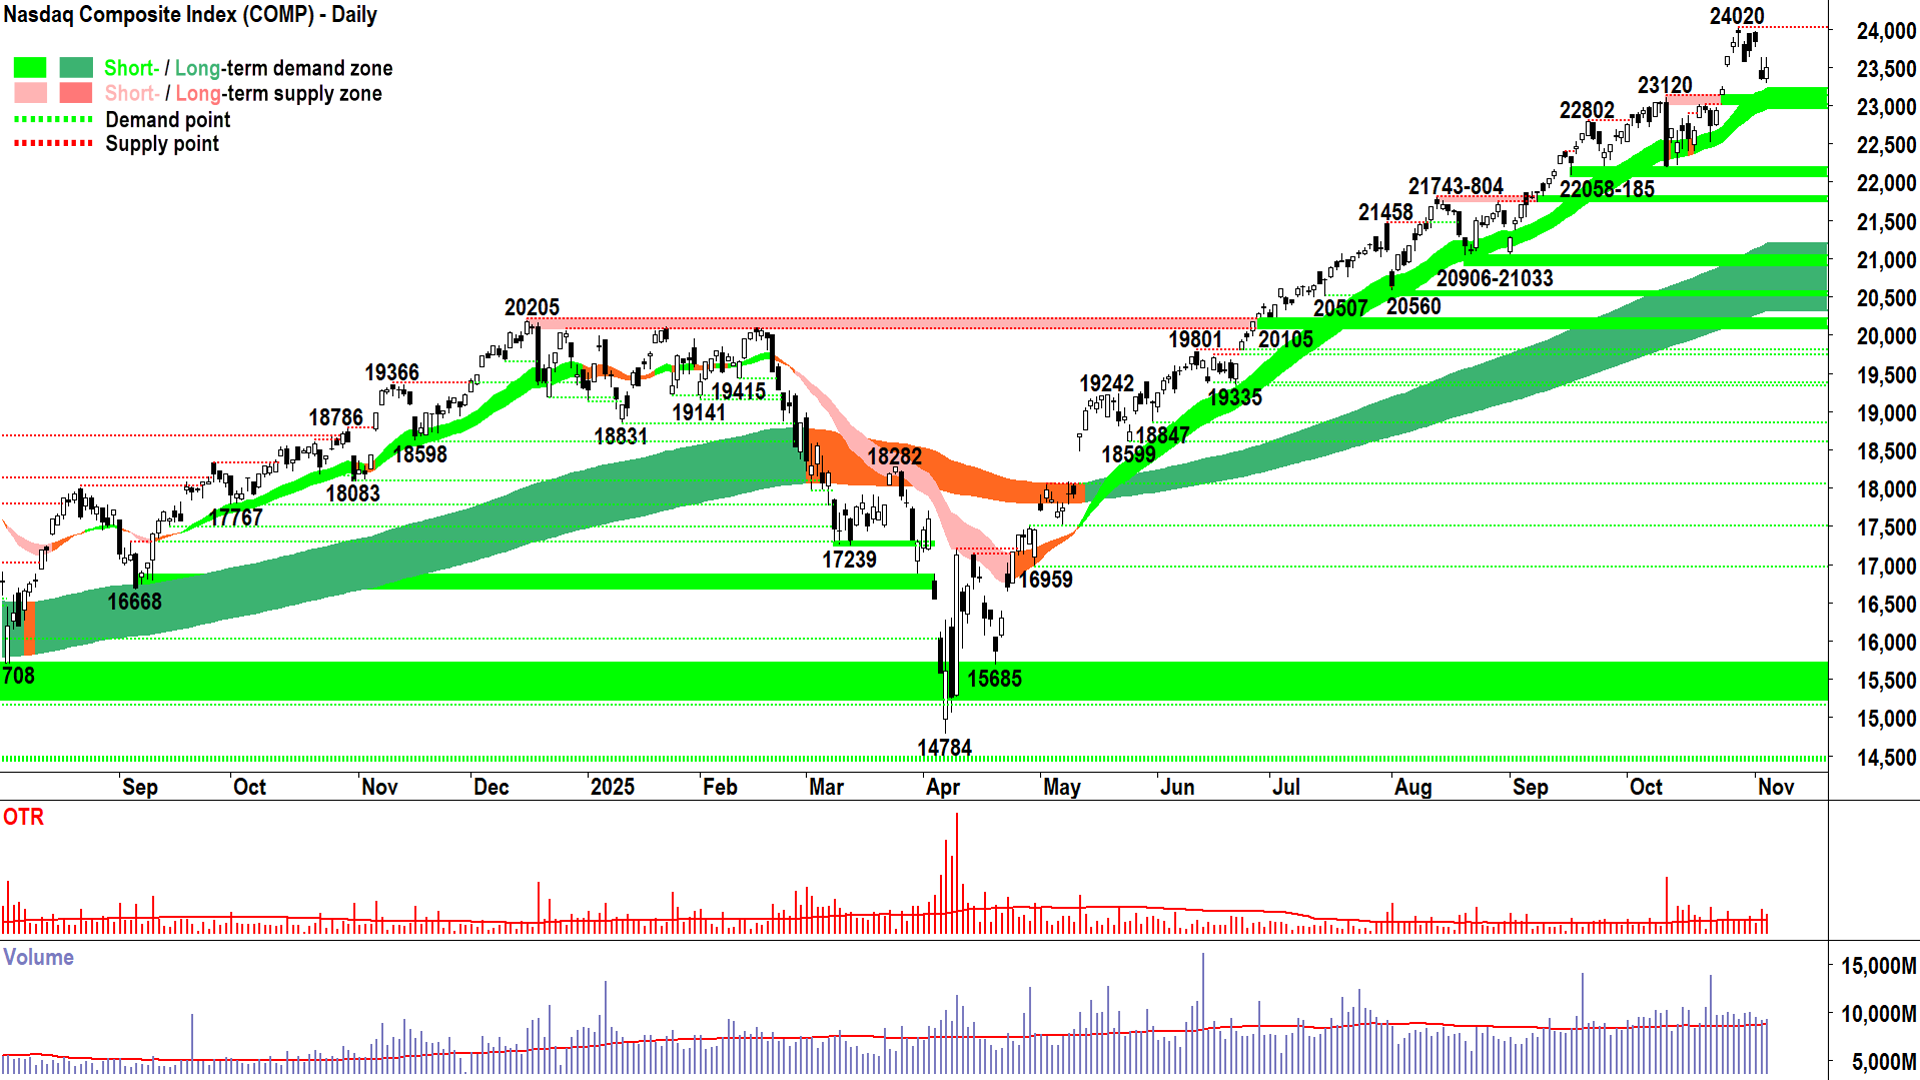
Nasdaq Composite Index

Nasdaq Composite Index chart (click here for full size image)
Two more candles since our last chat about the Comp. Note, for the record, I reiterated my personal preference to maintain FRP in yesterday’s ChartWatch *LIVE* Webinar – even after Tuesday's rather nasty supply-side showing.
It just wasn’t enough to tip the balance towards supply-side control.
Wednesday’s candle steadies the ship somewhat, but it was hardly an emphatic display of demand-side power! Nagging upward pointing shadow is the main concern.
But none of what we’ve seen since the 24020 peak is inconsistent with mean reversion (back to the short term trend ribbon) – nor is it consistent with a decisive move to supply-side control.
We require further confirmation for that…
Lower peak to 24020
Close below the 23120 point of demand
Close below the short term uptrend ribbon (presently 22955-23220)
Strong supply-side candles, i.e., long black bodies and or long upward pointing shadows – particularly those which coincide with any of the prior 3!
The demand-side doesn’t want to leave it too long here – we want to keep FOMO rife among those with cash (i.e. the demand-side!), and the hope of getting a higher price rife with those with stock (i.e., the supply-side!).
So, ideally, we see a strong demand-side candle tonight, or Friday at the latest to keep the short term uptrend rolling along… within what remains a very strong long term uptrend.
View: I remain FRP (Full Risk Position corresponds to a 100% allowable capital allocation limit for US stocks based on my personal risk management model).
Key levels: 23120 is the closest point of demand, the price should not close below here if the demand-side is in control of the Comp's price; a close below the short term uptrend ribbon (presently 22955-23220) will nullify the short term uptrend = ⚠️
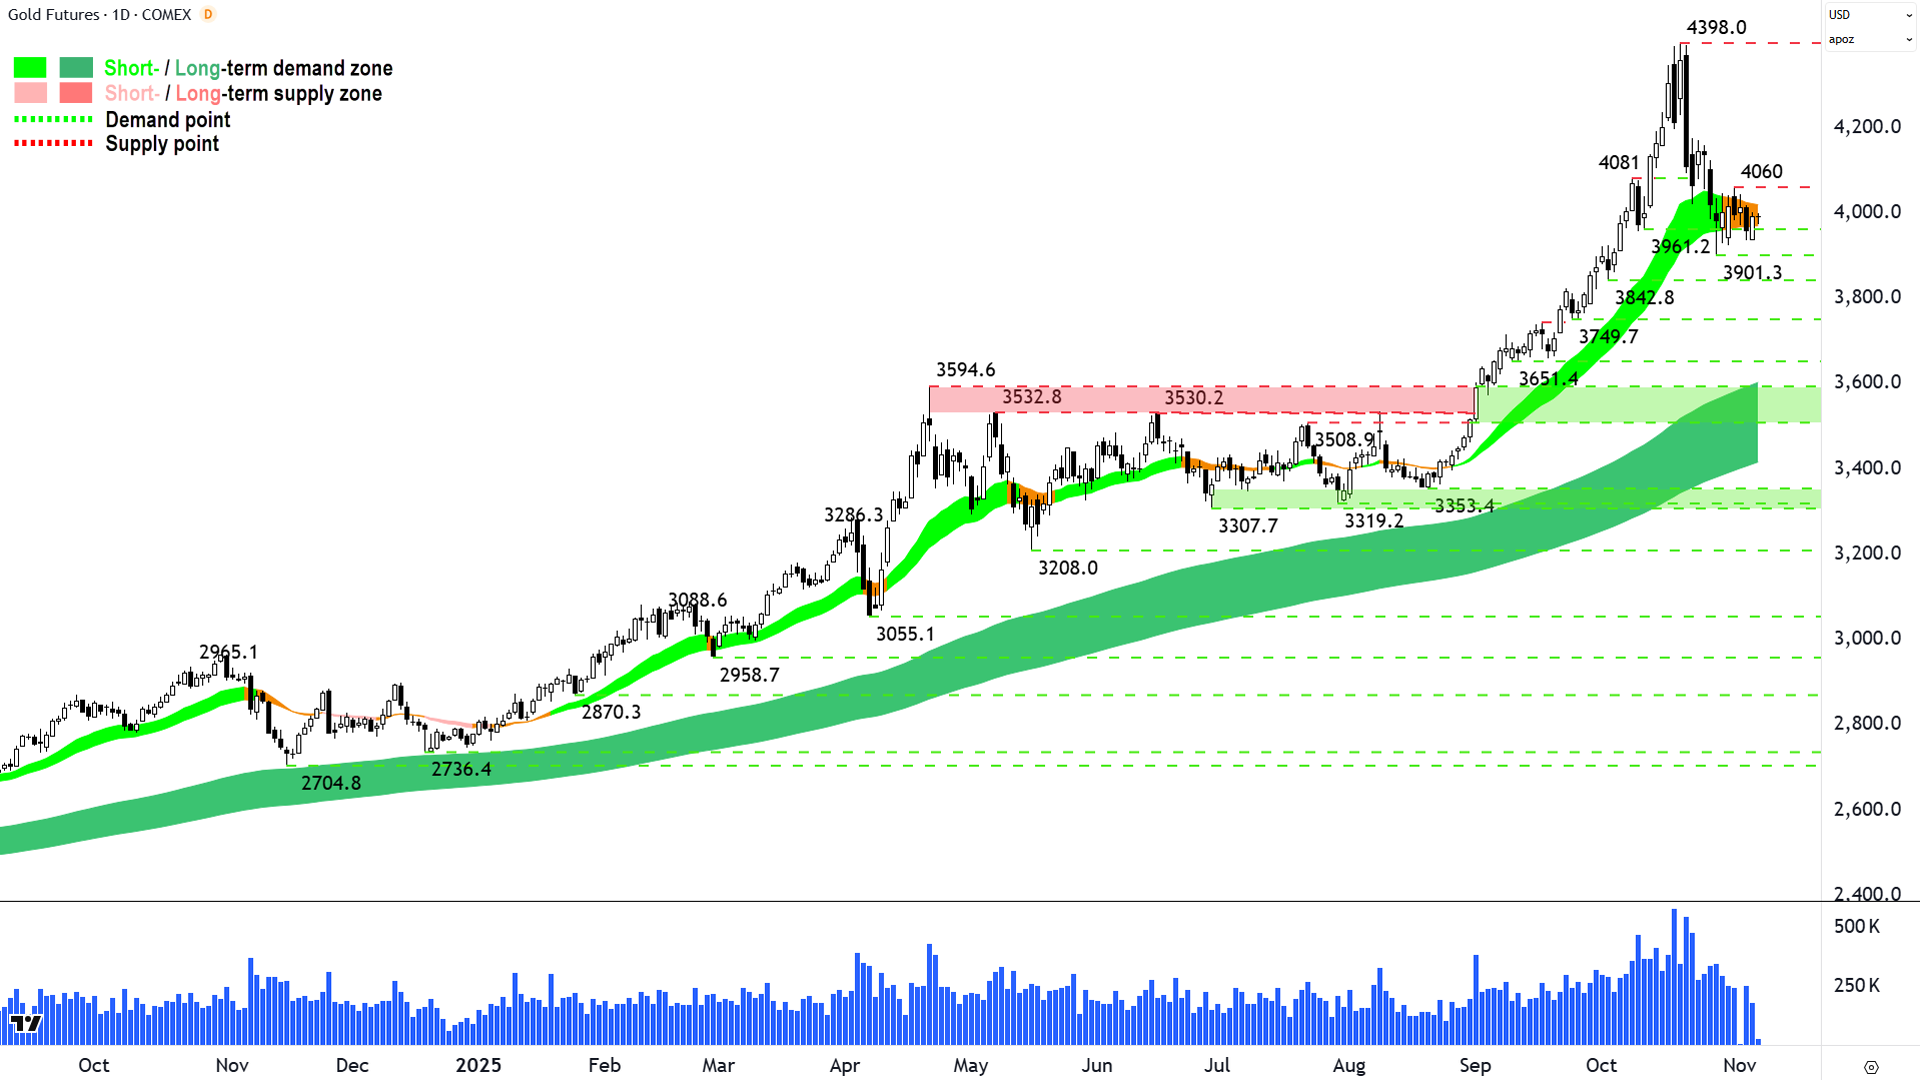
Gold Futures (Front month, back-adjusted) COMEX
%20COMEX%20chart_6%20Nov.png)
Gold Futures chart (click here for full size image)
The last time we covered gold and silver was in ChartWatch Markets on 31-Oct.
In that update, we noted “Supply will remain active and demand timid” in the shadow of their respective recent major peaks. Essentially, we require a “resolution” as to whether is these peaks are going to be viewed by market participants as being “the top” or not.
The longer each continues to waver beneath its peak – 4398 for gold and 53.77 for silver (analysis below) – the greater the likelihood of each top becoming far more enduring.
Quick bounces are the best bounces, because as noted in the Comp analysis, it keeps FOMO and expecting higher prices fresh in the minds of market participants.
We don’t want either driving force of D > S = P⬆️ to become stale – because that's how major tops become a self-fulfilling prophecy!
How long is too long? 🤷
The answer could be very subjective, but we do have some objective guidelines (again, copied and pasted from above = consistency! 😉). So, for gold we don't want to see a:
Lower peak to 4398 = 4360 ✅
Close below the 3961.2 point of demand
Close below the short term uptrend ribbon (presently 3970-4019) ✅
Two checks in boxes gold bulls really don't want them – although at the time of writing – gold's price is back above the short term trend ribbon.
I think it's actually pretty simple here. My hunch is that it's already been too long... that is, my gut says 4398 is going to be very sticky for quite some time.
The "top of the gold bull market" kind of sticky? 🤔
Maybe – hey, anything is possible! But it's far, far too early for me to call such a thing – because I don't know the future, remember... so I require lower peaks and lower troughs, a short term downtrend, interaction-with-and-failure-to-hold the long term trend ribbon...etc. and these could be weeks away!
For now, let's just go with "the price action and candles I have seen suggest that 4398 is going to be sticky". I am happy for the market to stand me corrected by:
Logging strong demand-side candles very soon
Closing above the last point of supply at 4060
Closing above the balance point (i.e., halfway point) of the 4398-3961.2 move (i.e., above 4180)
In the very short term, let me make it even simpler by making it binary, if the next thing that happens on the cold chart is:
Close above 4060 = 👍
Close below 3961.2 = 👎
View: In ChartWatch Markets on 27-Oct, I noted my technical model dictated running with a reduced risk exposure to gold, i.e., "-R". I have not seen a subsequent trigger to reduce risk further (nor to add risk), and so I am happy to remain at my present risk exposure, i.e., "=R". My model would consider a close below 3961.2 / the short term uptrend ribbon as a reason to further -R.
Key levels: 3961.2 is the closest point of demand, the price should not close below here if the demand-side is in control of gold's price; alternatively, a close below the short term uptrend ribbon (presently 3970-4019) will also nullify the short term uptrend = ⚠️
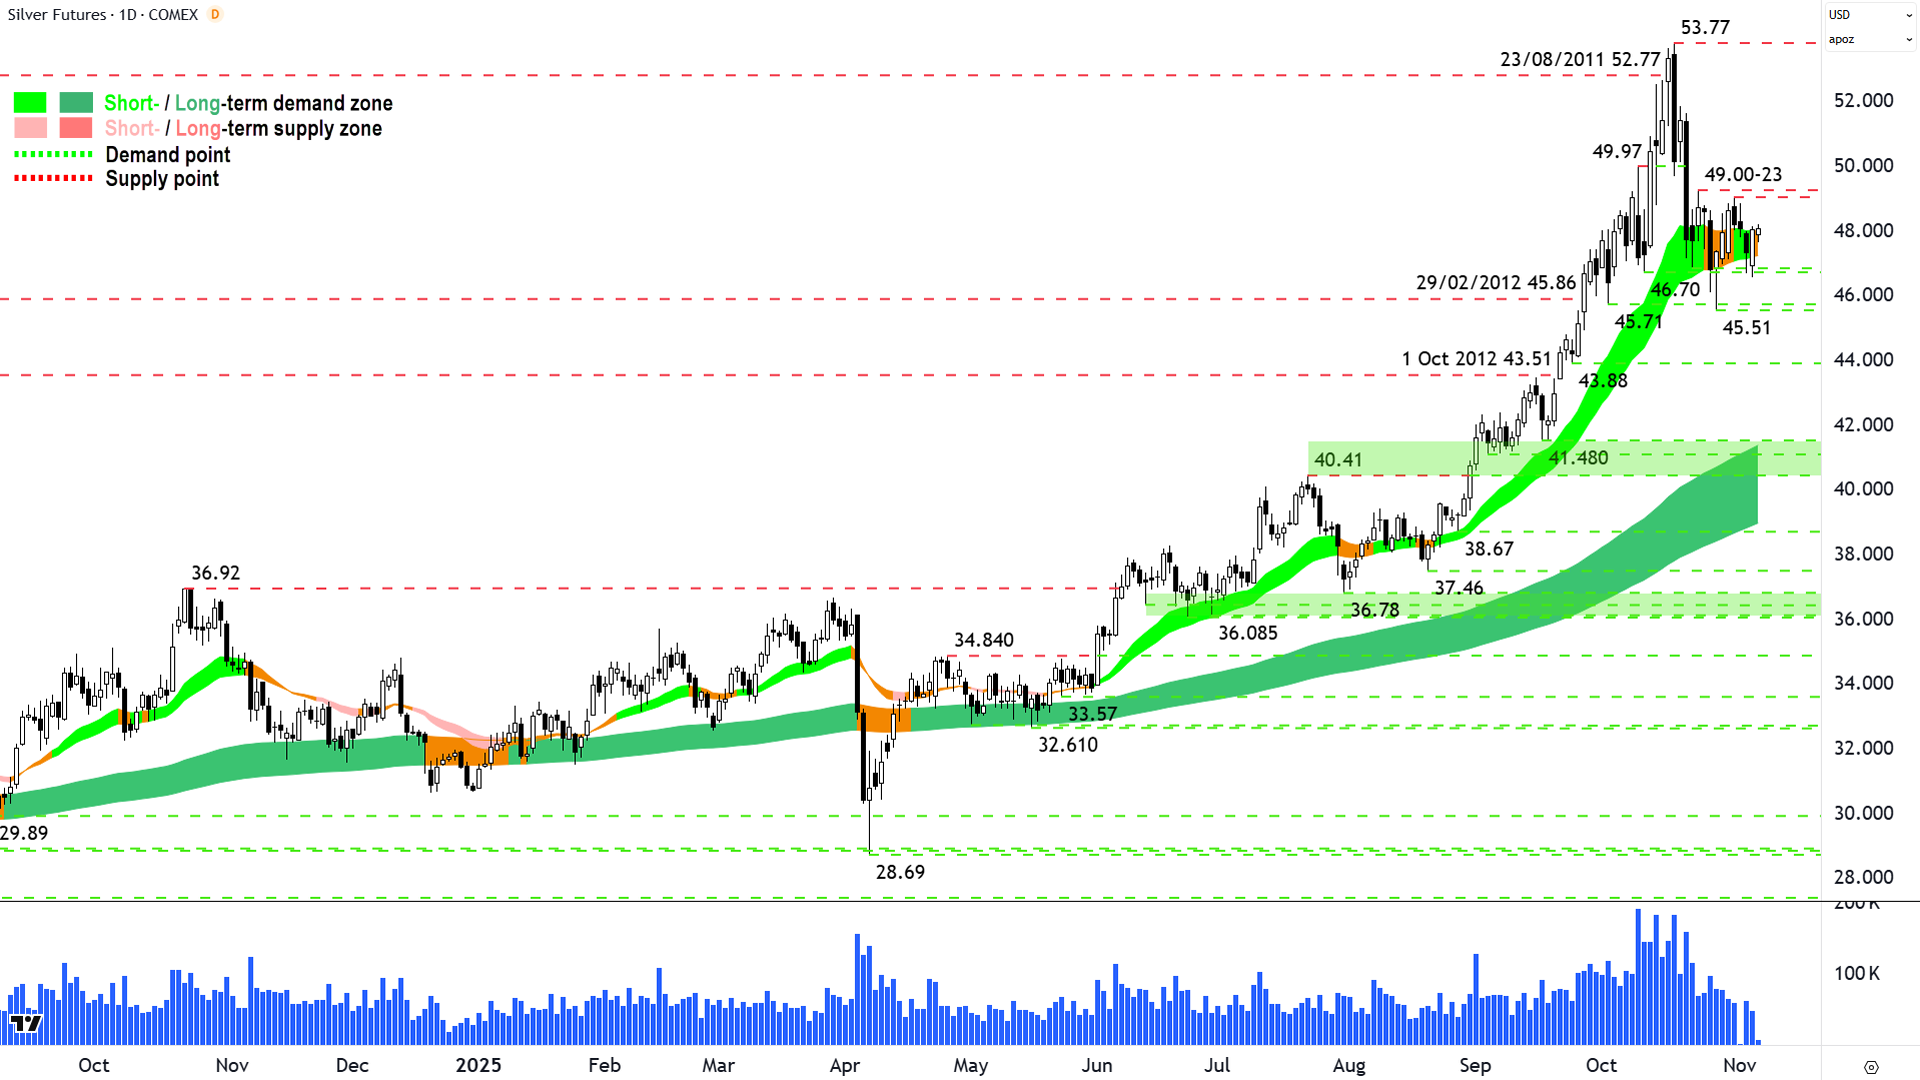
Silver Futures (Front month, back-adjusted) COMEX
%20COMEX%20chart_6%20Nov.png)
Silver Futures chart (click here for full size image)
Mainly ditto here for silver, although I note we have two lower peaks to its major high of 53.77 (49.00 and 49.23).
That just means a stronger supply-side and a weaker demand-side – and neither auger well for this being “just a quick pullback”.
Still, though, silver holds the dynamic demand of the short term uptrend ribbon, and it’s done so largely due to a few strong demand-side candles (28, 30-Oct, and 5-Nov).
As with gold, the short term uptrend for silver hangs in the balance – and the longer it remains in the balance, the more likely it is to fail (as animal spirits also cool!).
Again, a quick rally is a good rally – as it stokes the animal spirits that pushed silver to 53.77 in the first place. Today or tomorrow, good… Dragging into next week – not as good… and the week after that… yawn… Traders will be moving onto the next shiny new thing by then! 🥱
Let’s do the binary thing here too:
Close above 49.23 = 👍
Close below 45.51 = 👎
View: In ChartWatch Markets on 27-Oct, I noted my technical model dictated running with a reduced risk exposure to silver, i.e., "-R". I have not seen a subsequent trigger to reduce risk further (nor to add risk), and so I am happy to remain at my present risk exposure, i.e., "=R". My model would consider a close below 45.51 / the short term uptrend ribbon as a reason to further -R.
Key levels: 45.51 is the closest point of demand, the price should not close below here if the demand-side is in control of silver's price; alternatively, a close below the short term uptrend ribbon (presently 47.20-48.00) will also nullify the short term uptrend = ⚠️
Have you seen this week's ChartWatch *LIVE* Webinar?
ChartWatch *LIVE* Webinar
ChartWatch *LIVE* Webinars – WEEKLY Wednesday's @ 12pm AEDT
Learn more about technical analysis and trend following through real case studies on ASX stocks. Australia's premier technical analyst, Carl Capolingua, shares his unique insights on stocks as requested by viewers. Ask about a company in your portfolio or anything related to trading and investing and get Carl's expert opinion.
Places are limited so >REGISTER NOW!<
