ChartWatch Markets: All hail the Nasdaq bull market, as gold and silver bull markets show early signs of cracking...
Technical analysis of the most important global stock indices, commodities, bonds, FX, and crypto impacting your ASX portfolio each day.


Source: Shutterstock
Mentioned
KEY POINTS
- The Nasdaq Composite has made yet another all-time high – defying the critics and rewarding the trend following faithful! But when will this amazing run come to an end? What will be the warning signs? We tell you exactly what to watch for in the charts!
- Gold and silver’s bull markets may have already ended as signs are growing the recent pullback is becoming increasingly sticky. Should investors panic or wait patiently for further signals the short term trend is improving or deteriorating? We investigate!
- Platinum and palladium markets have also garnered plenty of attention among investors lately, but they too appear to be succumbing to investor nervousness. Is it a case of all the precious metals being tarred with the same brush?
In today's edition of ChartWatch Markets, we'll be covering the technicals for:
Nasdaq Composite
Gold Futures (Front month, back-adjusted) COMEX
Silver Futures (Front month, back-adjusted) COMEX
Platinum Futures (Front month, back-adjusted) COMEX
Palladium Futures (Front month, back-adjusted) COMEX
Nasdaq Composite Index

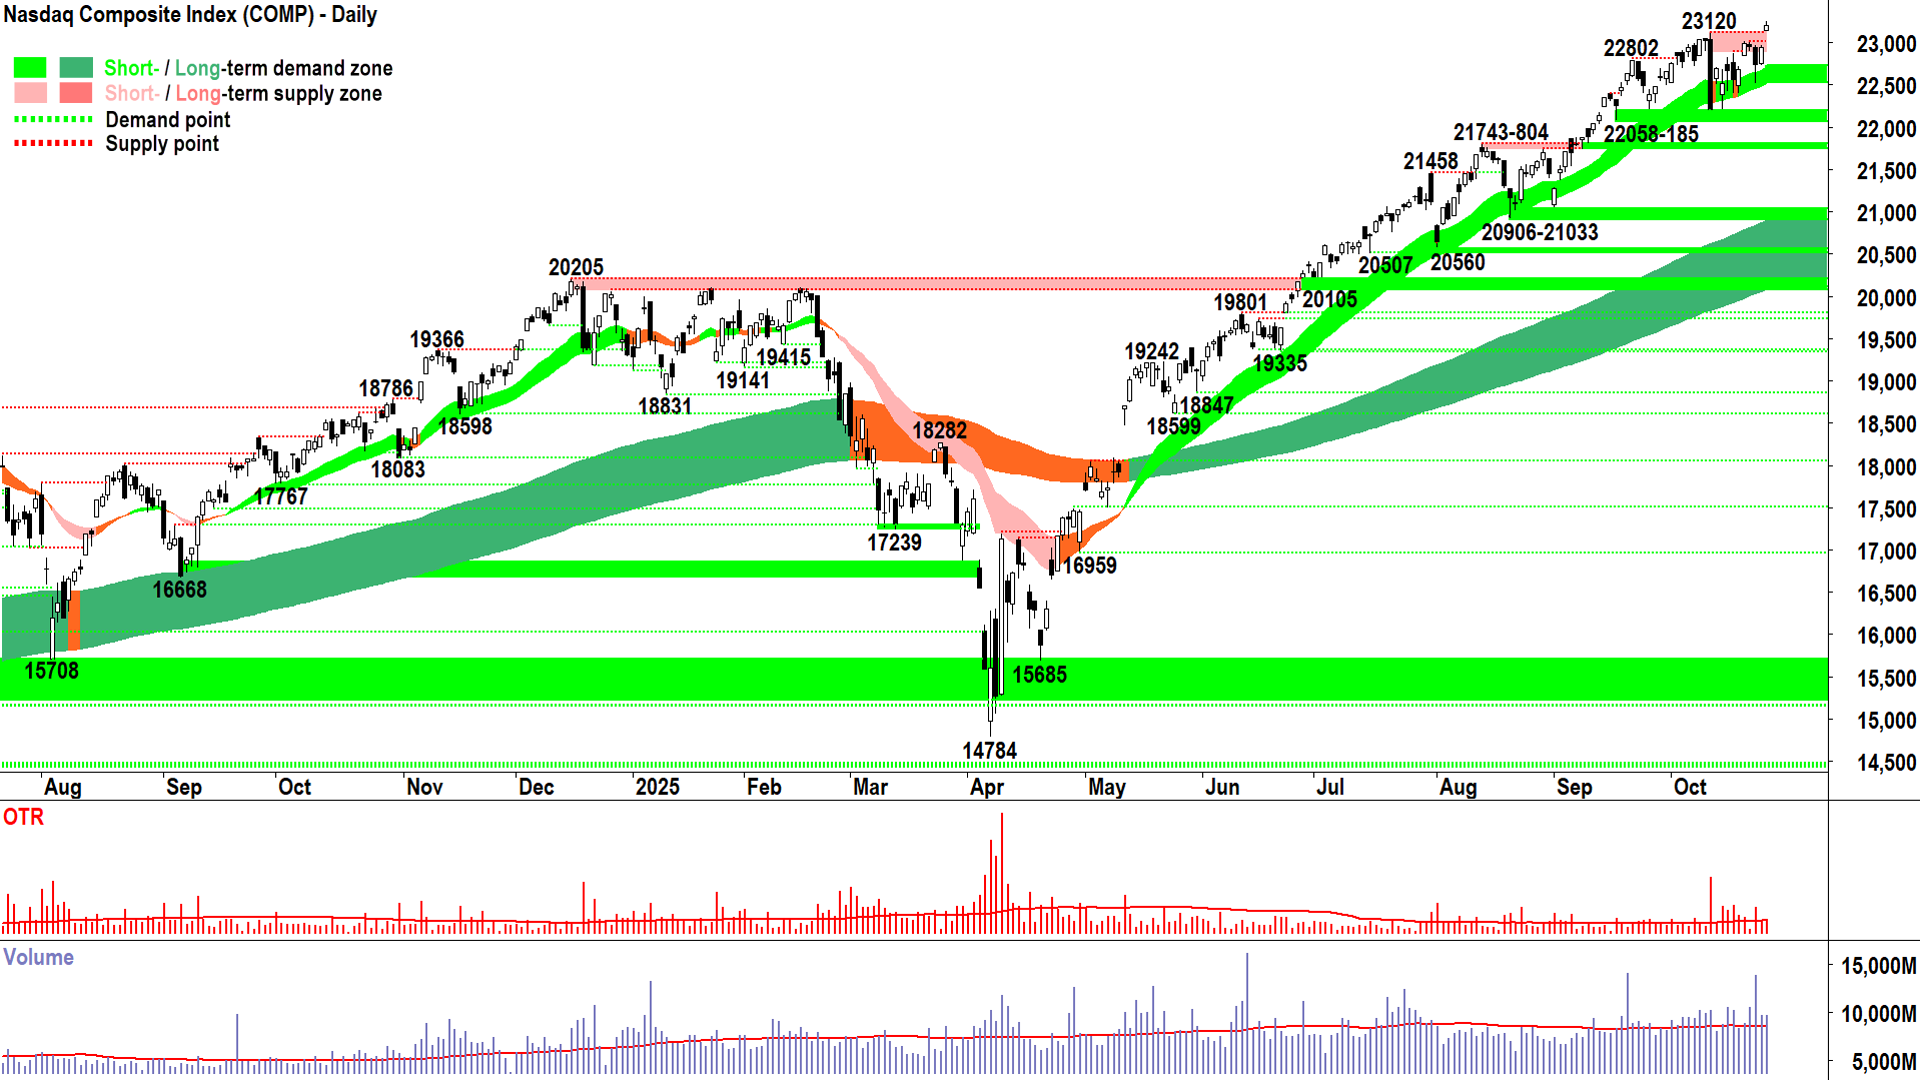
Nasdaq Composite Index chart (click here for full size image)
A new all time high on the Comp. Not a surprise to us – after all, there’s a big ruddy bull market going on. Anything else would be the surprise!
Although, Friday’s move will no doubt be blowing the minds of value investors 🤯.
Yes, yes, it’s too expensive, yes, yes, it’s all going to end it tears…
Eventually.
Nothing lasts forever.
But that’s only a problem if you can’t spot the warning signs that the supply-side is moving in to take control of the Comp’s price.
I can assure you: Before it’s the end of the world (unless that event prevents the last candle from closing!) there will be a big ruddy black candle at the top of this Comp bull market, or a long upward pointing shadow… or a few of them.
Then we’ll see a lower peak set, or sometimes we’ll close below the last trough before that occurs – either way, something won’t be right with the price action.
And we’ll see a close below the short term uptrend ribbon, that ribbon will stop acting as a zone of dynamic demand…
And so on and so forth and the like…
If I sound a little flippant about how this bull market will end… I am. It will end. I know that. You know that. Blind Freddy knows it too.
But! It’s impossible for it to happen without us seeing with absolute clarity and objectivity that it’s happening – because my technical model specifies clearly what we must look out for (you’re welcome!).
And we’re on the clock – 5 times a week diligently applying it.
Given this is the case, then what’s there to worry about? The top will happen when it happens and our job is to follow the trend until it does.
Based on the following, that trend is unequivocally UP!:
Consistent with demand-side control = ✅
Consistent with supply-side control = ⚠️
Short and long term trend ribbons: ⬆️ / ⬆️, widening (getting stronger), acting as a zone of dynamic excess demand = ✅
Price action: Rising peaks and rising troughs (i.e., supply removal and demand reinforcement) = ✅
Candles: Demand-side candles (i.e., white-bodied candles and or downward pointing shadows) = ✅
✅✅✅ = MOTN (More Often Than Not) the price should keep going UP!
View: The 10-Oct "That Supply-Side Candle" has been consumed! 🥳 Don't forget what caused that candle, ahem, who caused that candle... I can only imagine how much easier it would have been over the last couple of weeks (12 months!) without such distractions! 🤦
Anyways, no point whining, it's not like I ever budged from the risk setting that I must maintain today: FRP (Full Risk Position corresponds to a 100% allowable capital allocation limit for US stocks based on my personal risk management model).
Key levels: 22058 is the closest point of demand, the price should not close below here if the demand-side is in control of the Comp's price; a close below the short term uptrend ribbon (presently 22525-22725) will nullify the short term uptrend = ⚠️
Gold Futures (Front month, back-adjusted) COMEX
%20COMEX%20chart_27%20Oct.png)
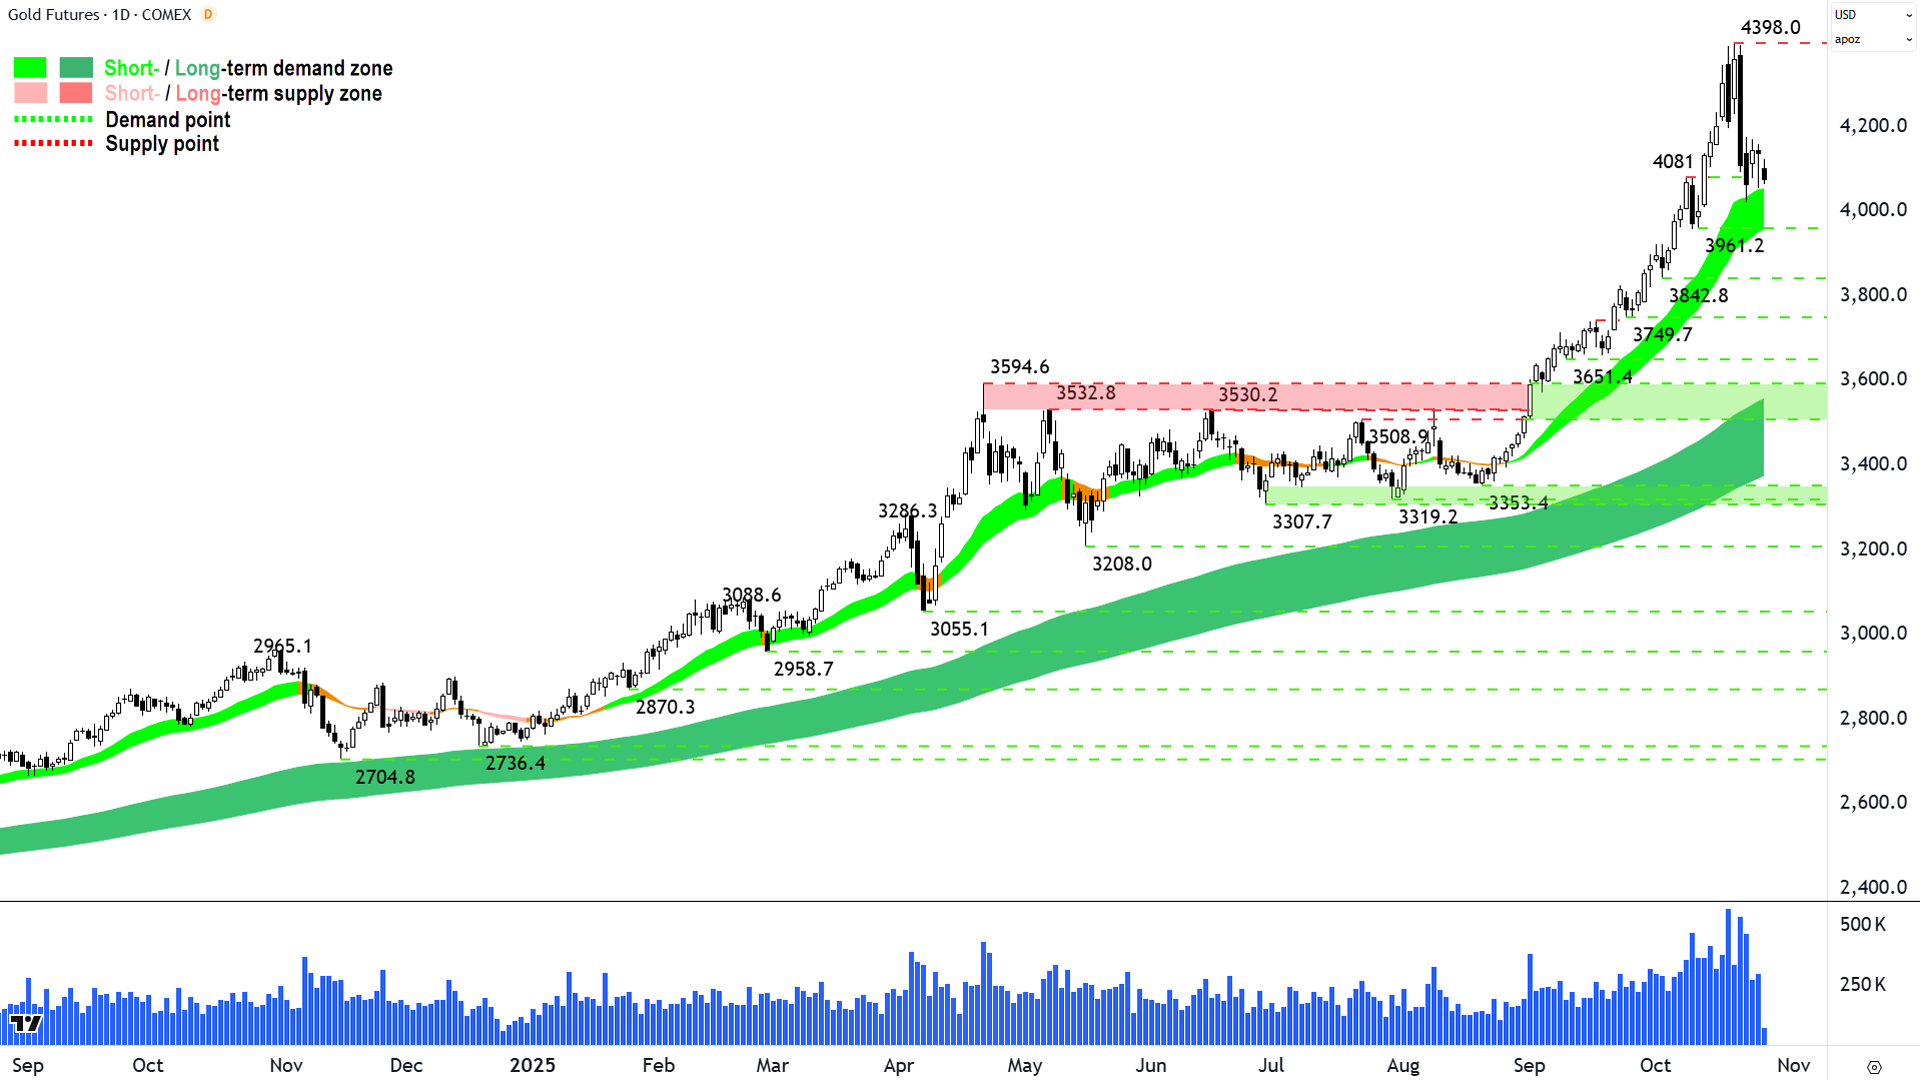
Gold Futures chart (click here for full size image)
A quick catch up on gold and silver today – and I thought I’d extend the analysis to platinum and palladium to see if the pullback in the main two has extended across the commodity group (which it has!).
First, gold, which we last covered in ChartWatch Markets on 23-Oct.
In that update, and the one before it on 20-Oct we noted that gold had “found supply” as evidenced by the long black supply-side candles of 17 and 21-Oct.
Each candle’s elevated volume suggested that a significant amount of motivated supply had arrived in a market that was, prior to their occurrences, nearly totally demand-side controlled.
So, if you have D > S = P ⬆️ and then you add in more S… you get at the very least D = S = P↔️ or if there’s just too much supply – and demand sees reason in the face of the deluge to back off – you could also get S > D = P⬇️.
Yes, the above is a statement of the bleeding obvious. Yes, my whole technical analysis model – because it is solely based upon the interaction between demand and supply – is based on the bleeding obvious.
Again, you’re welcome.
This is all short term stuff, though, and we know that nothing goes up in a straight line forever. Even in the strongest long term bull markets, there are short term pullbacks. This could be exactly what we’re experiencing right now (the long term uptrend ribbon has not even skipped a beat).
But all reversals start with supply side candles – and 17 and 21-Oct are both very credible supply-side showings.
So, the conclusion is caution. Long term bullish bias, clearly, but now a short term neutral bias – watching closely for:
Growing signs of supply-side control (will likely force a deeper pullback – likely towards the long term uptrend ribbon): These would be an increasing prevalence of supply-side candles (i.e., black-boded and or upward pointing shadows), a lower peak to 4398, or a close below 3961.2, or a close below the short term uptrend ribbon (presently 3960-4055)
To fix this short term uptrend, we need to see gold do the opposite of that last paragraph… so:
Growing signs of demand-side control: These would be an increasing prevalence of demand-side candles (i.e., white-boded and or downward pointing shadows), a higher trough to 3961.2 – set as soon as possible, really any quick bounce is critical here to maintain confidence and FOMO among the demand-side and to convince the supply-side that they’re once again better holding on for more!
View: It really is that simple. The candles and the price action will guide us nicely from here. My tip is this, though: the price action since the 21-Oct candle is MOTN consistent with a further decline than it is with a sudden recovery back toward the highs. Not that the concept of FRP means anything on a commodity, but I suspect it might be helpful in assisting your understanding of how bullish / bearish I am on gold… In the last update, I moved my personal bias from FRP to to “2/3RP”, and I see no reason to move from this just yet. A close below 3961.2 / the short term uptrend ribbon would see this reduce to 1/2RP.
Key levels: 3961.2 is the closest point of demand, the price should not close below here if the demand-side is in control of gold's price; alternatively, a close below the short term uptrend ribbon (presently 3960-4055) will also nullify the short term uptrend = ⚠️; the setting of lower peaks in the 4200-4300 zone, particularly with long supply-side candles would indicate an environment of growing excess supply = ⚠️
Silver Futures (Front month, back-adjusted) COMEX
%20COMEX%20chart_27%20Oct.png)
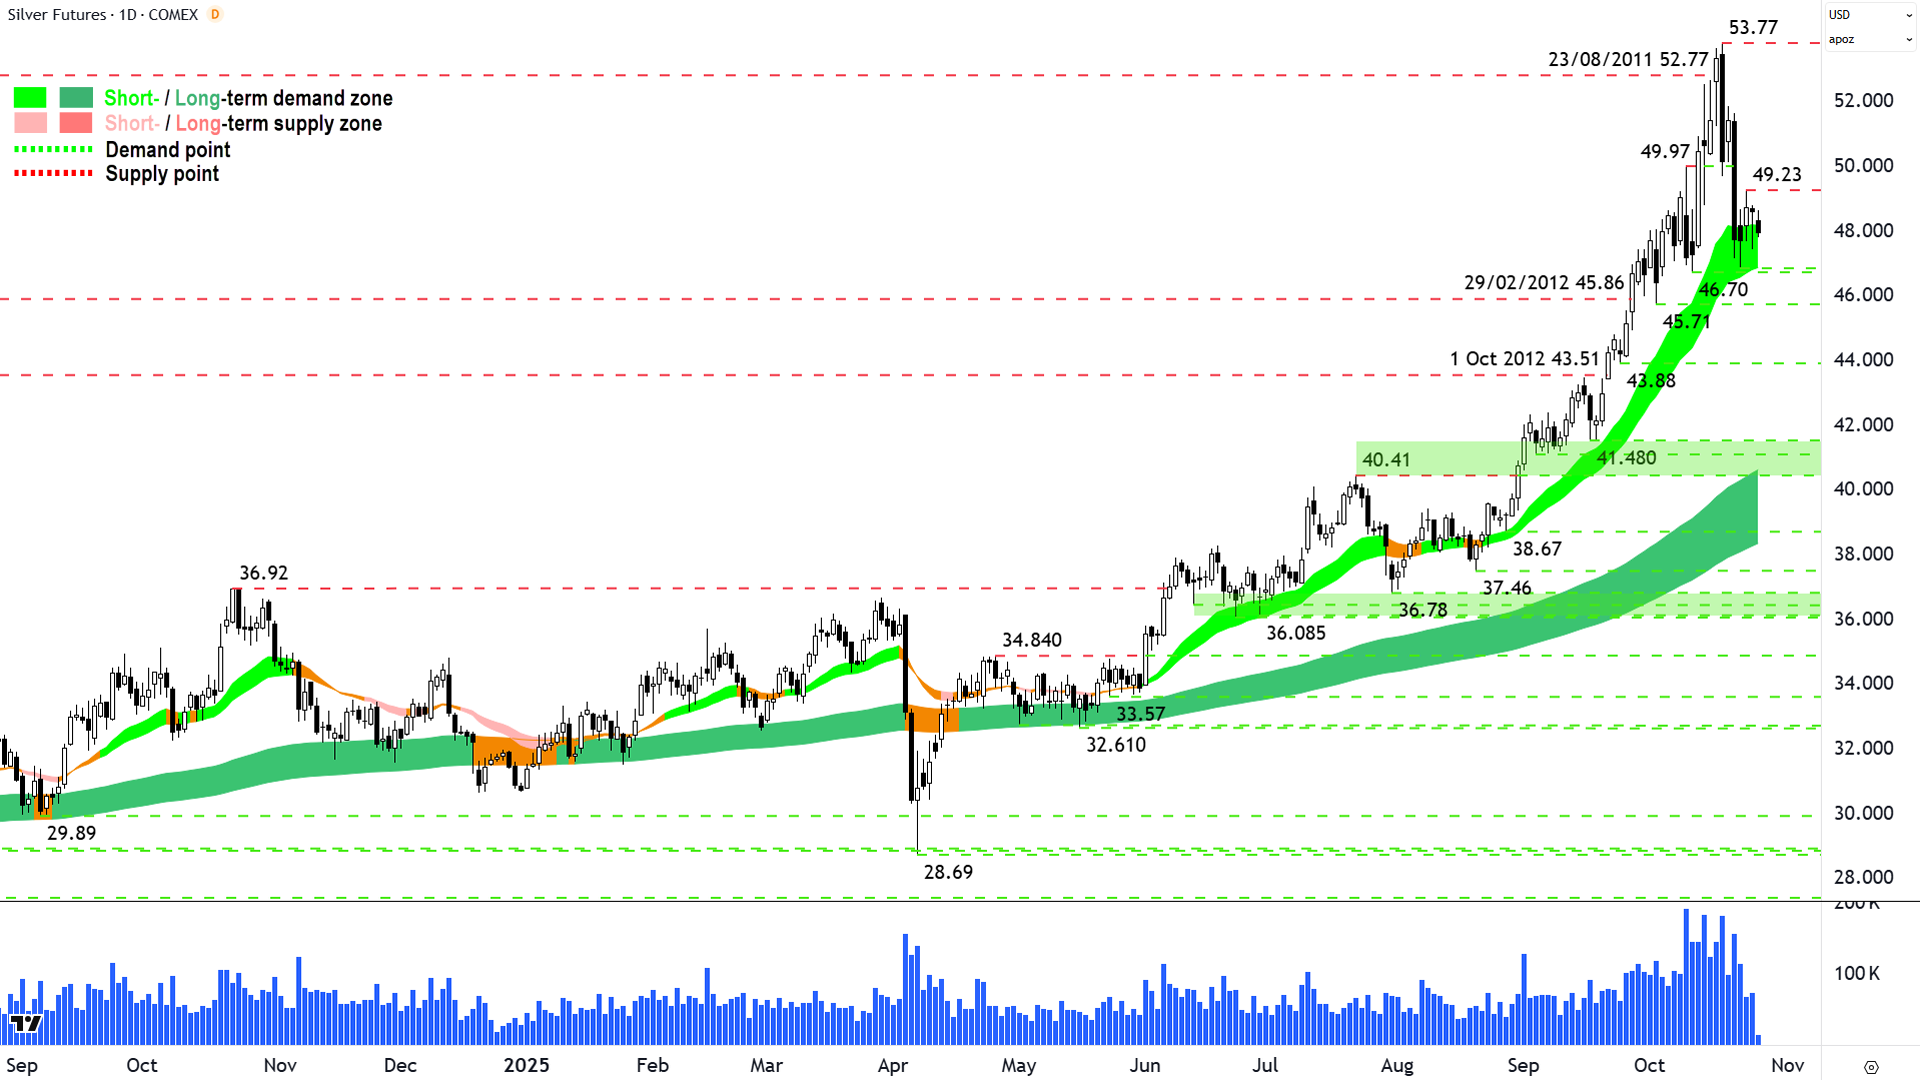
Silver Futures chart (click here for full size image)
Silver’s chart is very similar to gold’s, and my analysis in the last couple of updates was largely “ditto” – as it will be today.
One minor difference here is that silver’s supply-side candles are slightly more convincing showings of supply-side control. Also, it has set a lower peak to its bull market peak, in this case at 49.23.
The same caution is warranted here: Simply a pullback – or the beginning of something more sinister? That’s what we’re trying to determine by watching the candles and price action very, very closely!
The key levels are different: 46.70 the key point of demand that really should hold if this is a “just a routine pullback” scenario, and the short term trend ribbon boundaries are presently 46.85-48.15.
View: Ditto gold. Retaining a philosophical risk exposure cap to silver at 2/3RP. That will reduce to 1/2RP on a close below 46.70 / the short term downtrend ribbon. Again, this is a conceptual indication of what my model prescribes, and in no way should be interpreted as a recommendation for what you should do!
Key levels: 46.70 is the closest point of demand, the price should not close below here if the demand-side is in control of silver's price; alternatively, a close below the short term uptrend ribbon (presently 46.85-48.15) will also nullify the short term uptrend = ⚠️; the setting of lower peaks in the 51.00-52.00 zone, particularly with long supply-side candles would indicate an environment of growing excess supply = ⚠️
Platinum Futures (Front month, back-adjusted) COMEX
%20COMEX%20chart_27%20Oct.png)
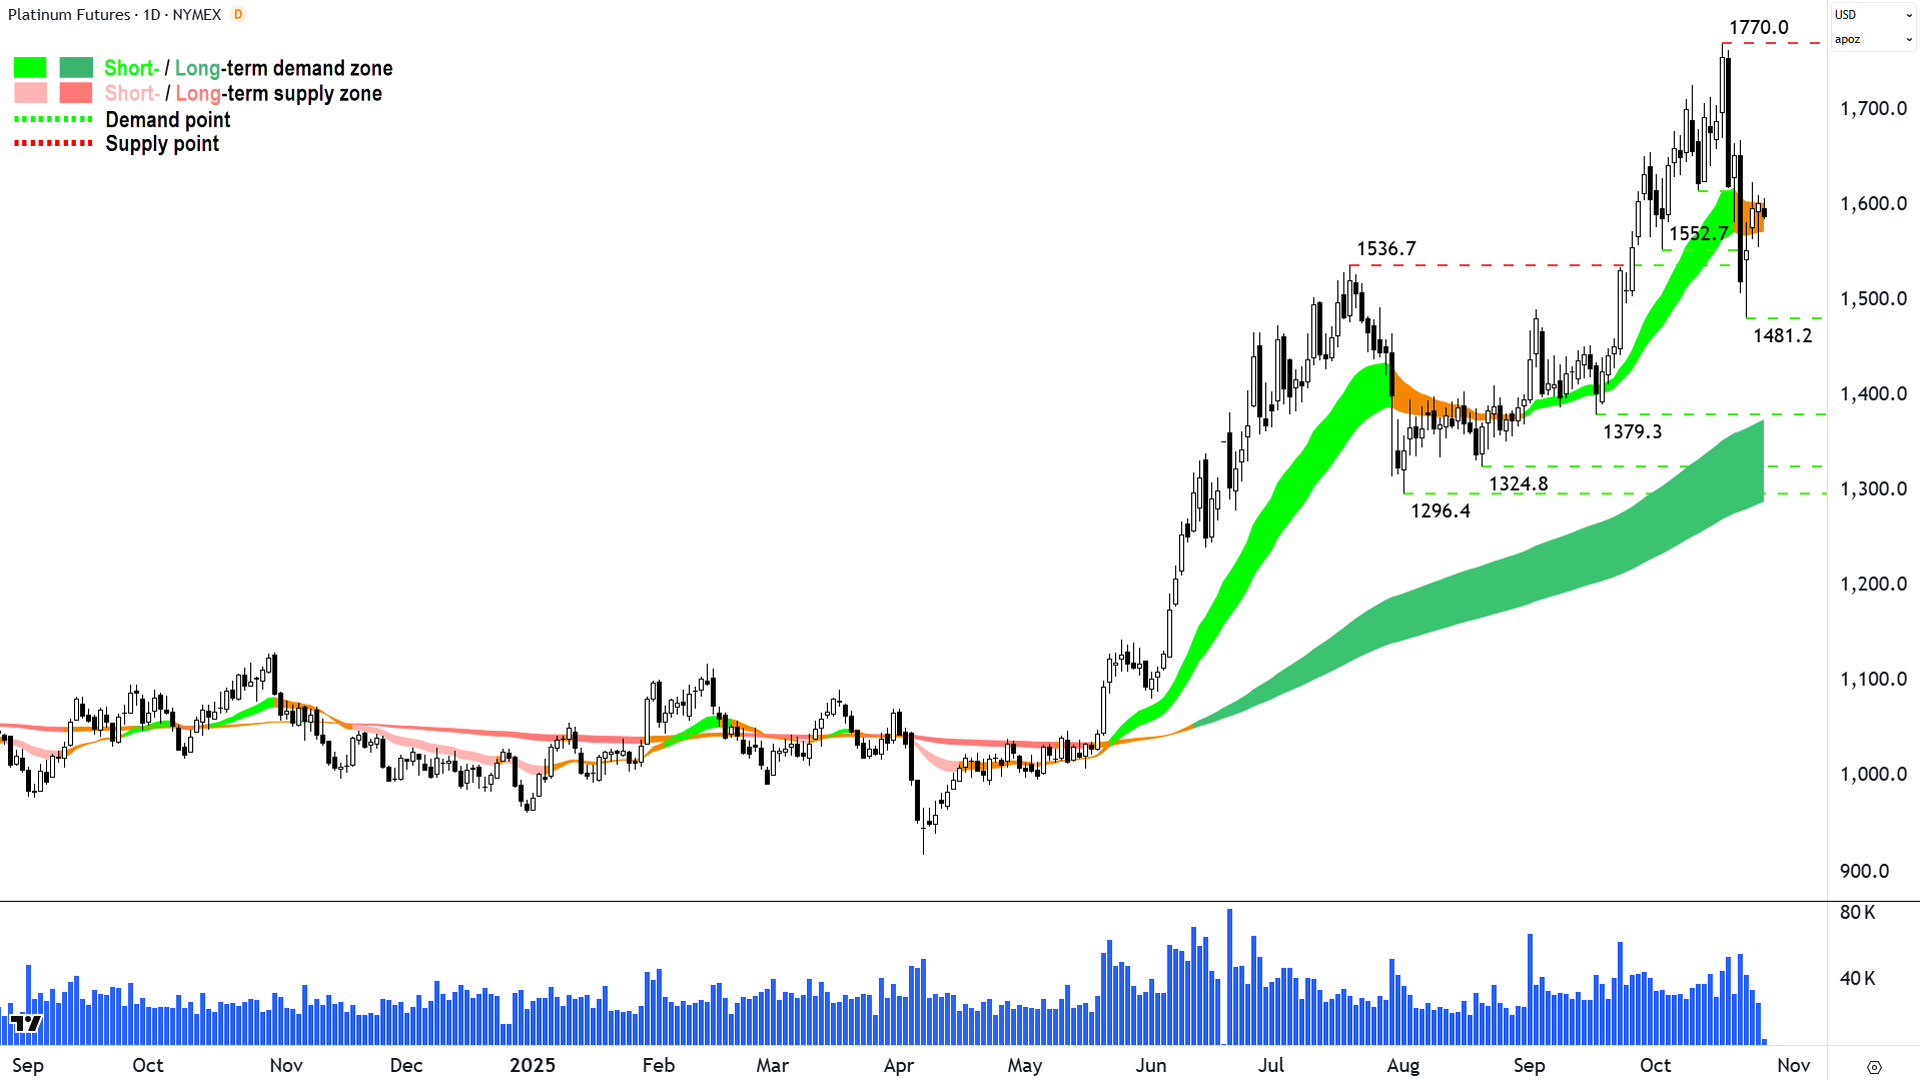
Platinum Futures chart (click here for full size image)
Super quick here also. Clearly there’s a great deal of following going on and not a lot of leading in platinum – unless you account for the fact that the price viciously dipped below the short term uptrend ribbon and two previous points of demand (1614 and 1552.7)!
Kick in the short term trend ribbon has neutralised, and it’s clear that in terms of upwards momentum, platinum’s fortunes are probably more closely tied to a rally in gold and silver than its own fundamentals.
View: 1481.2 really must hold, or it could get ugly here. As with gold and silver, a quick bounce is a good bounce for the sustainability of the short term uptrend – otherwise the natives are going to start to get very tetchy indeed!
Key levels: 1481.2 is the closest point of demand, the price should not close below here if the demand-side is in control of silver's price; the setting of lower peaks in the 1600-1700 zone, particularly with long supply-side candles would indicate an environment of growing excess supply = ⚠️
Palladium Futures (Front month, back-adjusted) COMEX
%20COMEX%20chart_27%20Oct.png)
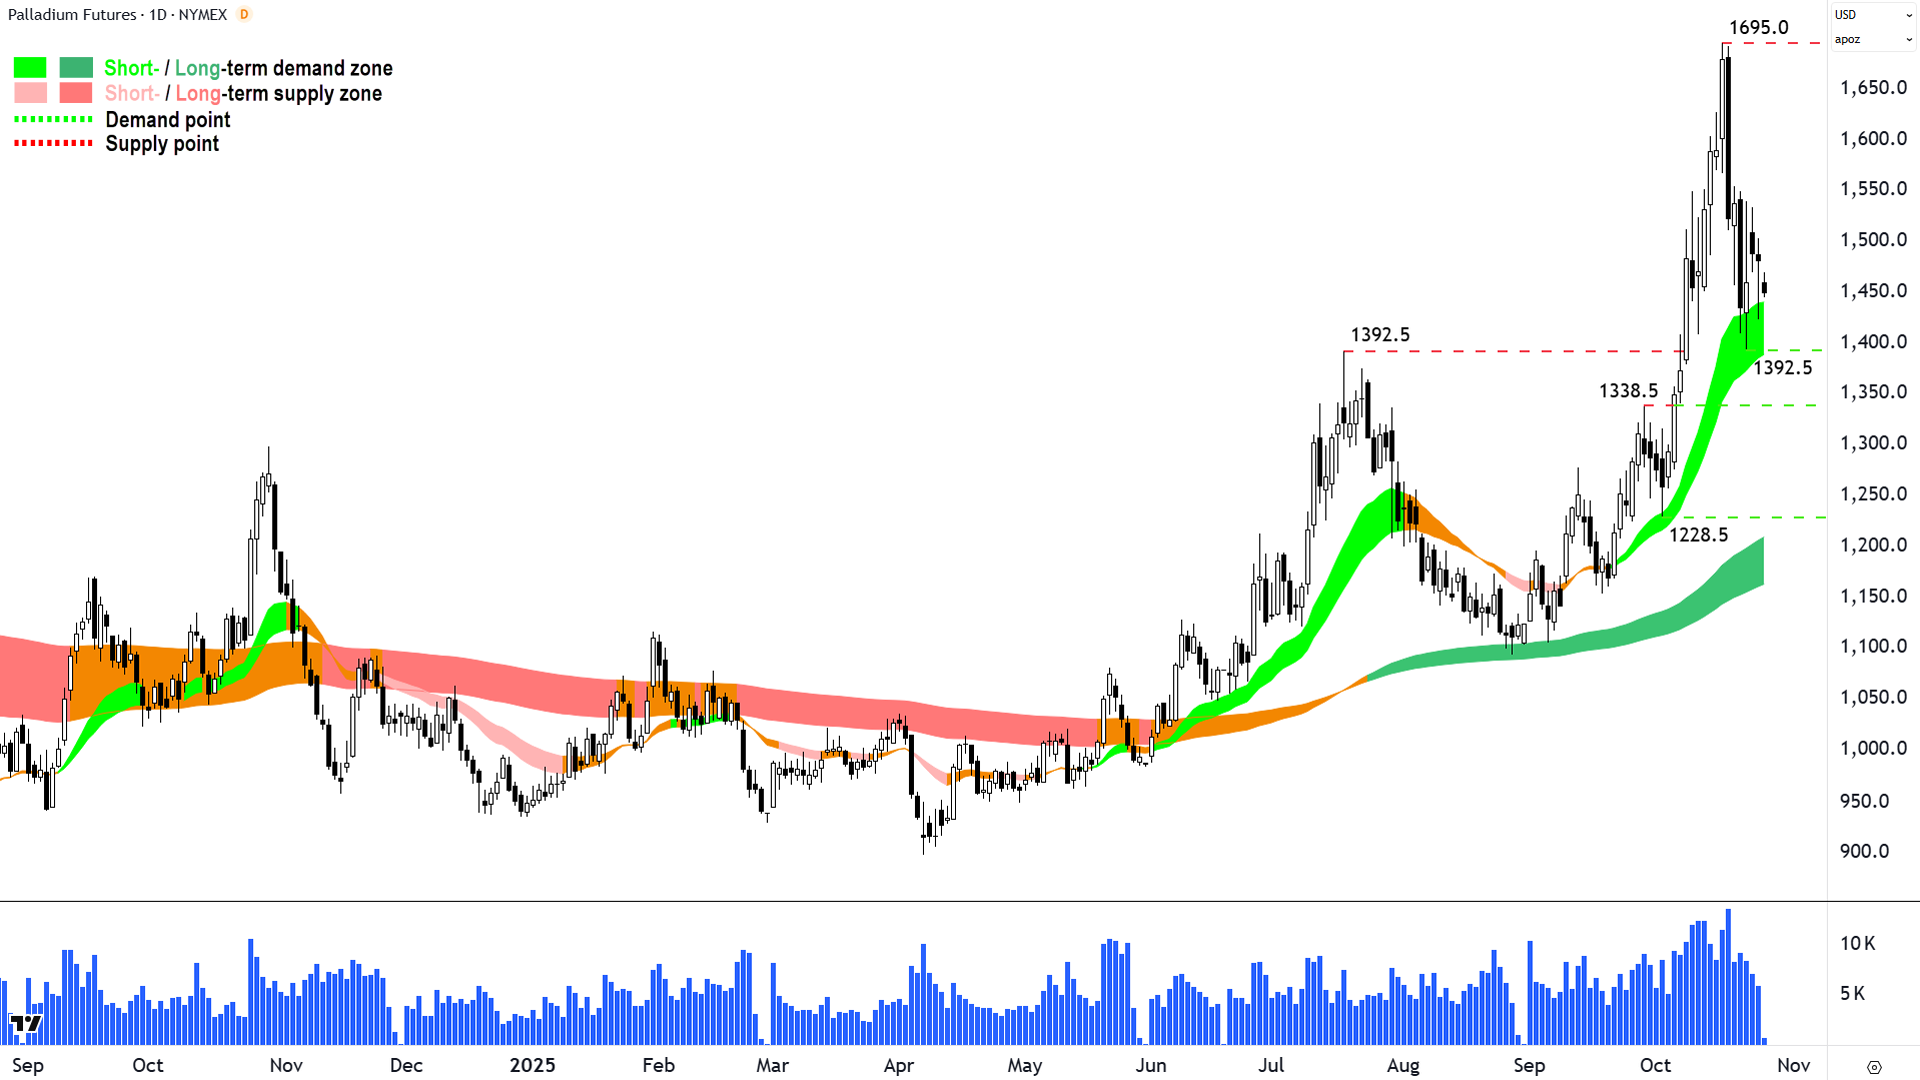
Palladium Futures chart (click here for full size image)
View: Better here than for platinum – but all the same issues plaguing gold and silver’s short term uptrends are evident here also. The short term uptrend ribbon is key – we need it to hold, but we also need a bounce from here very quickly to kickstart bullish momentum.
Key levels: 1392.5 is the closest point of demand the price should not close below here if the demand-side is in control of silver's price; alternatively, a close below the short term uptrend ribbon (presently 1390-1442) will also nullify the short term uptrend = ⚠️; the setting of lower peaks in the 1500-1600 zone, particularly with long supply-side candles would indicate an environment of growing excess supply = ⚠️
ChartWatch *LIVE* Webinar
ChartWatch *LIVE* Webinars – WEEKLY Wednesday's @ 12pm AEDT
Learn more about technical analysis and trend following through real case studies on ASX stocks. Australia's premier technical analyst, Carl Capolingua, shares his unique insights on stocks as requested by viewers. Ask about a company in your portfolio or anything related to trading and investing and get Carl's expert opinion.
Places are limited so >REGISTER NOW!<
