ChartWatch Markets: Pullback or peak? Gold and silver bull markets in question after "supply-side event"
Technical analysis of the most important global stock indices, commodities, bonds, FX, and crypto impacting your ASX portfolio each day.


Source: Shutterstock
Mentioned
KEY POINTS
- US stocks showed some timely strength on Friday, despite the myriad of negative narratives that could cause investors to retain their cash on the sidelines. The Nasdaq composite logged an important “demand-side candle” but is not out of the woods yet!
- Gold and silver were the opposite – as investor confidence in stocks grew – there was less desire to play “defence” in precious metals. Each saw a substantial “supply-side event”, a candle that suggests the demand-supply may have tipped towards balance.
- We investigate the key trends, price action, and candles in the Nasdaq, gold, and silver to try to determine if these three tremendous trends are more likely to keep powering on, or if their respective bull markets may suddenly be at risk.
In today's edition of ChartWatch Markets, we'll be covering the technicals for:
Nasdaq Composite
Gold Futures (Front month, back-adjusted) COMEX
Silver Futures (Front month, back-adjusted) COMEX
Nasdaq Composite Index

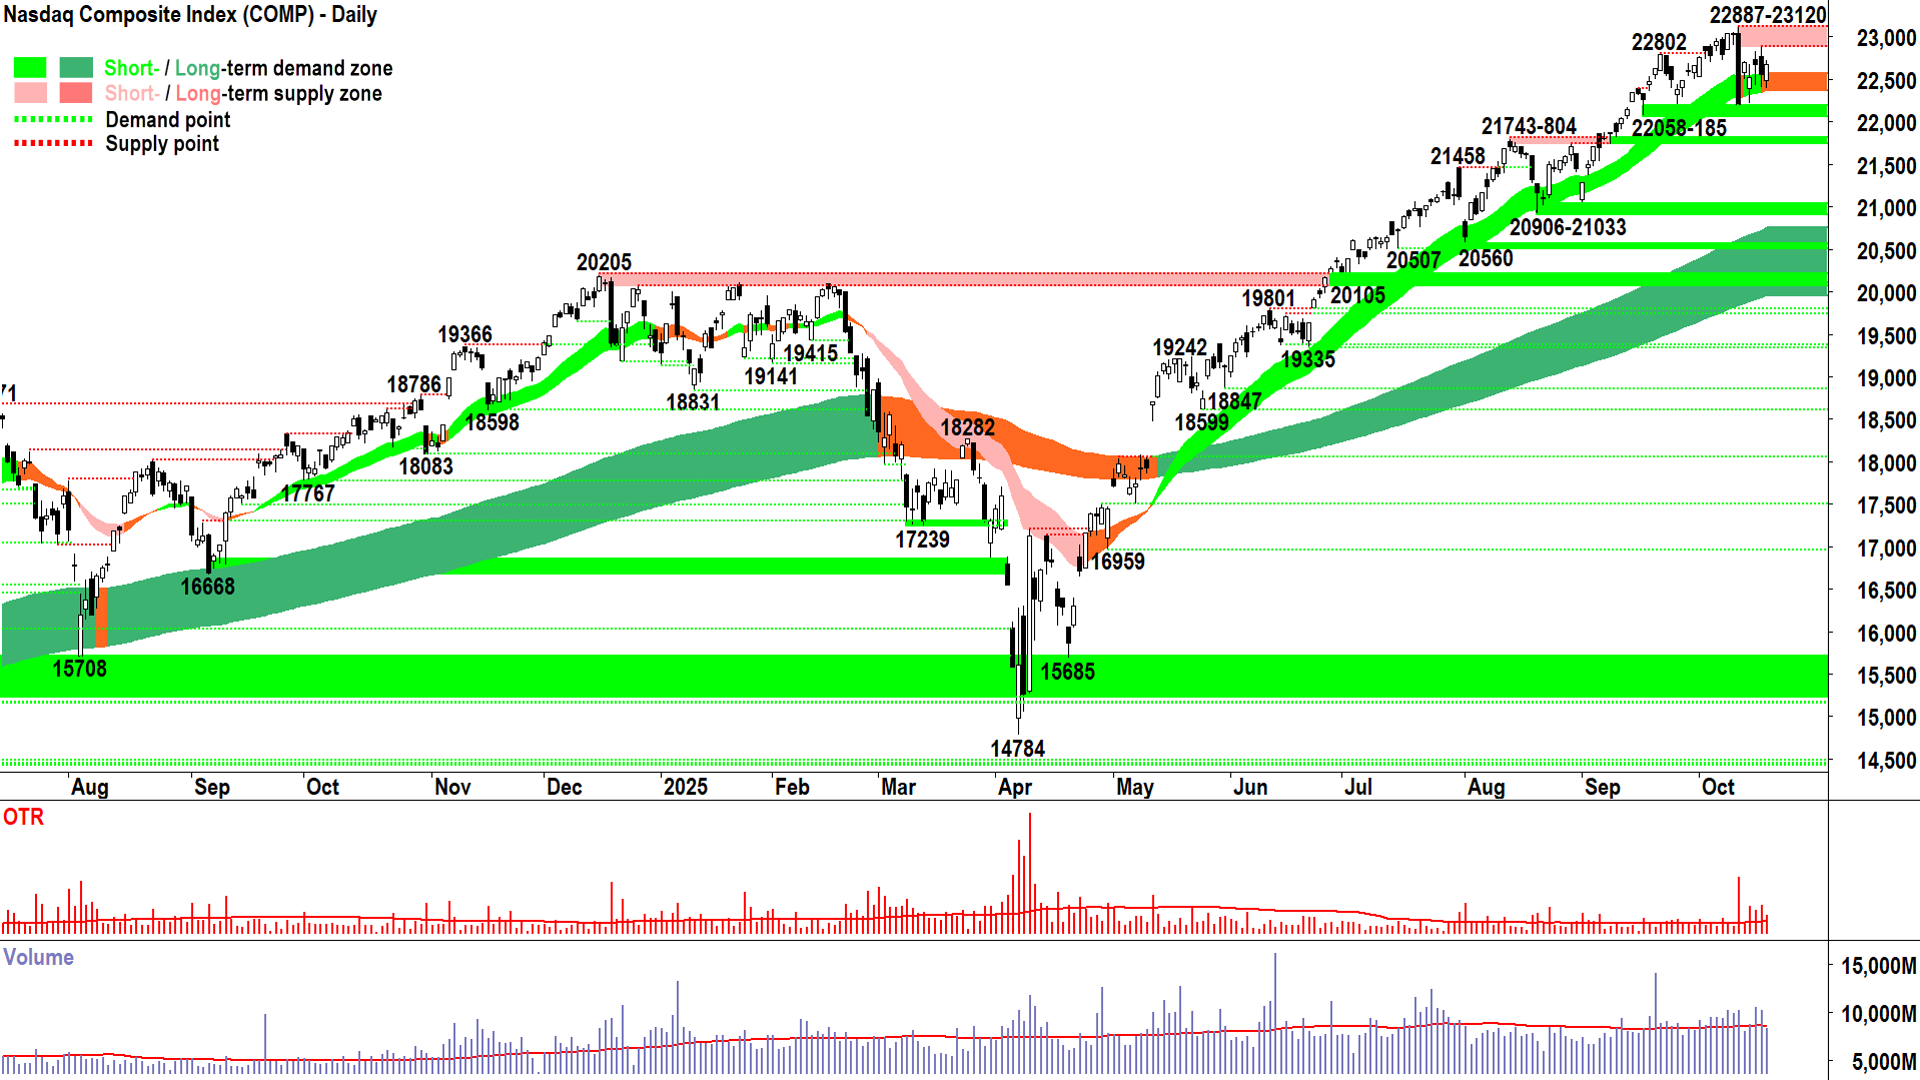
Nasdaq Composite Index chart (click here for full size image)
How good is technical analysis? 🤔
Yes, our fundamental cousins will argue it’s like reading tea leaves… hocus pocus… mumbo jumbo… driving by looking in the rearview mirror!
I agree! Technical analysis (well my brand of trend following technical analysis) tells us stuff that’s so blatantly bloody obvious – you’d wonder why we do it at all.
And that’s why I love it! Why is XYZ stock or commodity going up?
Fundamental analyst: “Well, it’s all because of blah blah blah blah blah blah…” 🤓
Me: “Um, because there’s more demand and than supply...” 😉
Hey – one of those answers is guaranteed to be correct!
The Comp’s technicals are a thing of beauty. I can’t help but look at the chart above and just feel all warm and fuzzy about technical analysis. There’s so much stuff going on in the world right now that is / that could contribute to why the Comp’s doing what its doing:
US Government shutdown; different paced global economy (Europe is picking up, as are emerging economies, however the USA and China are arguably in a slowdown); trade wars; actual wars; commodity wars; Trump vs Powell/Fed, rate cuts Y or N?; overvaluations; AI impacts; narrow participation in index gains…
I could go on and on and on (i.e., I could be CNBC, MSN, Bloomberg, Reuters, AFR, Ausbiz, even our very own Market Index and Livewire etc. etc.)
– but it’s all noise! 🙉
You know me. Let’s start checking some boxes and doing some trend following technical analysis – and get some answers as to what's happening where it matters: In the demand-supply environment!
As far as the 3 tent pegs of my technical model go, i.e., trends, price action and candles:
Is consistent with demand-side control = ✅
Is consistent with supply-side control = ⚠️
Isn't consistent with either demand-side or supply-side control = ❓
Short and long term trend ribbons:
ST = ↔️ (neutral, amber), flat, and let's pay "acting as a zone of dynamic excess demand" = ❓
LT = ⬆️ (up, dark green), widening (getting stronger), acting as a zone of dynamic excess demand = ✅
Price action: Falling peaks and rising troughs (i.e., supply reinforcement and demand reinforcement) = ❓
Candles: Mixed, i.e., roughly equal occurrence of demand-side candles (i.e., white-bodied candles and or downward pointing shadows) and supply-side control (i.e., black-bodied candles and or upward pointing shadows) = ❓.
❓✅ + ❓ + ❓ = Short term indecision (i.e., no clear sign the demand-side or the supply-side is in control or the price) vs long term demand-side control.
So we can see that the market is somewhat indecisive towards America's most important high-tech/high-growth stock market barometer – i.e., the coalface of stock market risk taking in the world's most important economy.
If the market is indecisive, how can we be decisive? 🤷
We can't! Friday's candle is a big step in the right direction, though, and I must admit that it surprised me (after Thursday's candle, i expected we'd get something far more circumspect). It means that the demand-side isn't completely cooked in the short term yet. They're still lurking, still buying the dip, and still maintaining the price above the key 22058-185 demand zone.
But! The formation of the lower trough at 22887 confirms supply is building into 23120, and this requires increased vigilance.
Clearly now, 22058-185 is the go-no-go point for the Comp's short term uptrend. As long as it continues to close above that, we should assume MOTN (More Often Than Not) the short term trend will realign with long term trend sooner rather than later.
Below 22058-185, and, well... it's manage one's portfolio risk sort of stuff... ⚠️
View: I remain FRP until the Comp closes below 22085, upon which I will move to 2/3RP (Full Risk Position corresponds to a 100% allowable capital allocation limit for US stocks based on my personal risk management model, 2/3RP is the next setting down... let's hope we don't need it! 🤞).
Key levels: 22058 is the closest point of demand, the price should not close below here if the demand-side is in control of the Comp's price; a close below 22058 will nullify the short term uptrend = ⚠️
Gold Futures (Front month, back-adjusted) COMEX
%20COMEX%20chart_20%20Oct.png)
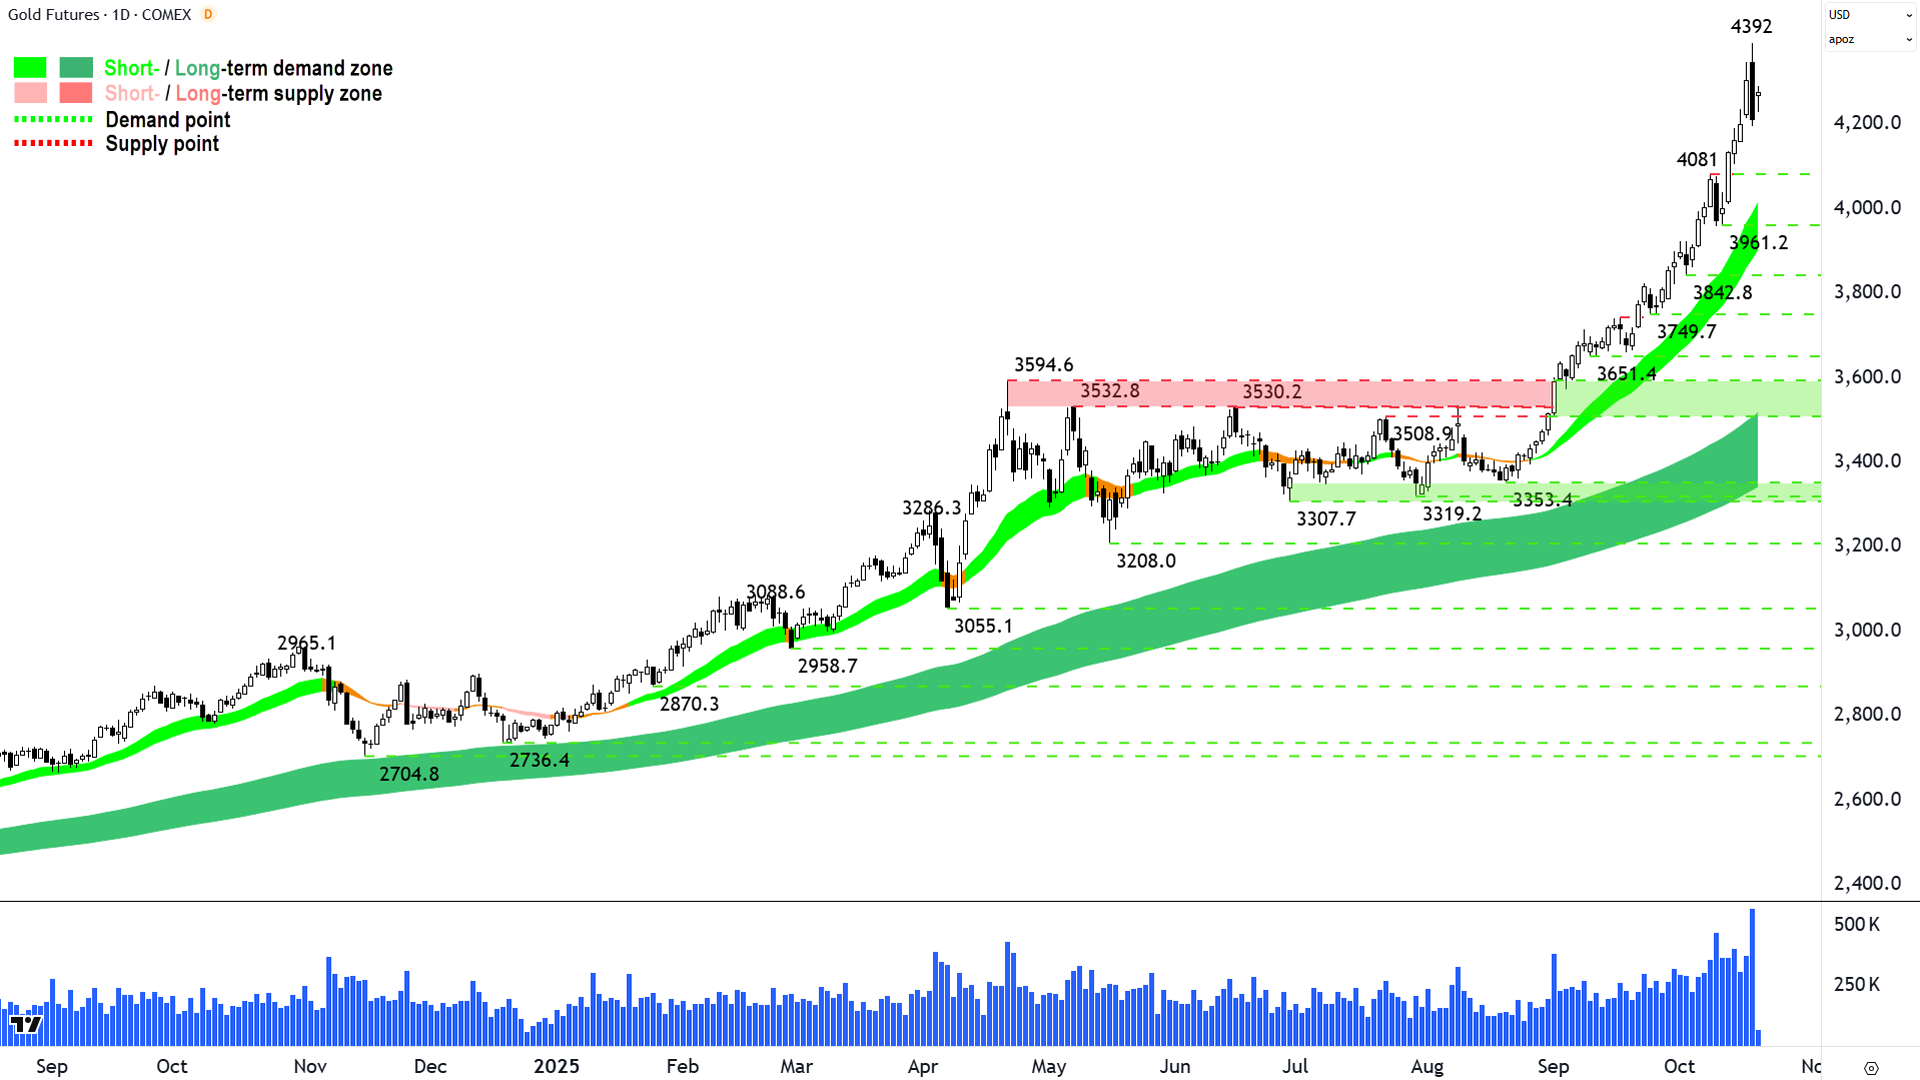
Gold loses its shine (click here for full size image)
Long time sufferers of my ChartWatch analysis will know exactly what Friday’s candle above, and below for silver, mean.
For newbs, note the last candle is today’s, live candle – which means Friday’s candle is the long black candle second-from-last. We completely discount today’s candle. Pretend it’s not there.
A black candle indicates excess supply (S > D = P ⬇️) and a long body indicates highly motivated supply. Pair that with record volume since the beginning of this last phase of the bull market – and we can see that Friday’s motivated supply was large in size also, i.e., large and motivated supply.
Hmmm… large and motivated supply... that’s doesn’t sound very good. Why was supply so large and motivated? 🤔
Stop thinking like a fundamental analysts (blah blah blah blah remember!?) 🛑
It just was. That’s all we care about.
It just was large and motivated.
But high / record volume means that selling didn’t occur into a vacuum – nope, there was a wall of buy-the-dippers that tried to get in its way.
And why not? Buying the dip has worked all the way up. Punters have been programmed to do it by default.
Only this time, the dip kept dipping. 😱
And said punters are now in a loss – something many of them probably aren’t used to – all them them preferring to undo their mistake if they have the chance.
Q. What does undoing that mistake look like? Answer: Break even.
Where’s breakeven? 🤔
All the way back up that long black candle. And, because we know from Friday’s volume – a bunch of demand just got stuck in at a loss – there’s likely to be plenty of latent supply into any next rally back towards 4392.
This is how "points of supply" form – and 4392 is now the key point of supply to watch out for. While we’re below it, there’s a chance we’ve seen the top in the gold bull market (and silver bull market below) forevermore. That’s a statement of the bloody obvious, but all bear markets started with their own version of 4392.
I am not calling this the top of either market – you know that’s both stupid and not my style – you also know what mode I go into after a “we’ve found supply” event in a strong uptrend.
Confirmation mode. I.e., either:
We get further signals that the supply-side is building in size and motivation = ⚠️
We get further signals that the demand-side has soaked up this short term supply-blip and is still ravenous for more = ✅📈
What will the confirmation look like? Either:
Quick demand-side response in the candles, i.e., long white body and/or downward pointing shadow and closes above the balance point of Friday’s candle (i.e., midpoint) – but preferably very close to 4392 = Friday is an aberration, demand-side still hoovering up supply ✅📈
Meek demand-side response in the candles, i.e., small black or white body and/or upward pointing shadow, close near the low of the session, high of the candle not pushing past the balance point of Friday’s candle, and/or a close below the low Friday’s candle (4196) and/or on the session low = ⚠️
That’s it. That's our answer to what happens next – from "this is just a routine pullback" to "this is the start of the next gold bear market" – will start with the present, gradually forming candle.
We’ll assess tomorrow and adjust our risk accordingly. It’s that simple (it should always be that simple) Again, I just love technical analysis!
View: No change to prevailing FRP view on gold.
Key levels: 3961.2 is the closest point of demand, the price should not close below here if the demand-side is in control of gold's price; alternatively, a close below the short term uptrend ribbon (presently 3905-4015) will also nullify the short term uptrend = ⚠️
Silver Futures (Front month, back-adjusted) COMEX
%20COMEX%20chart_20%20Oct.png)
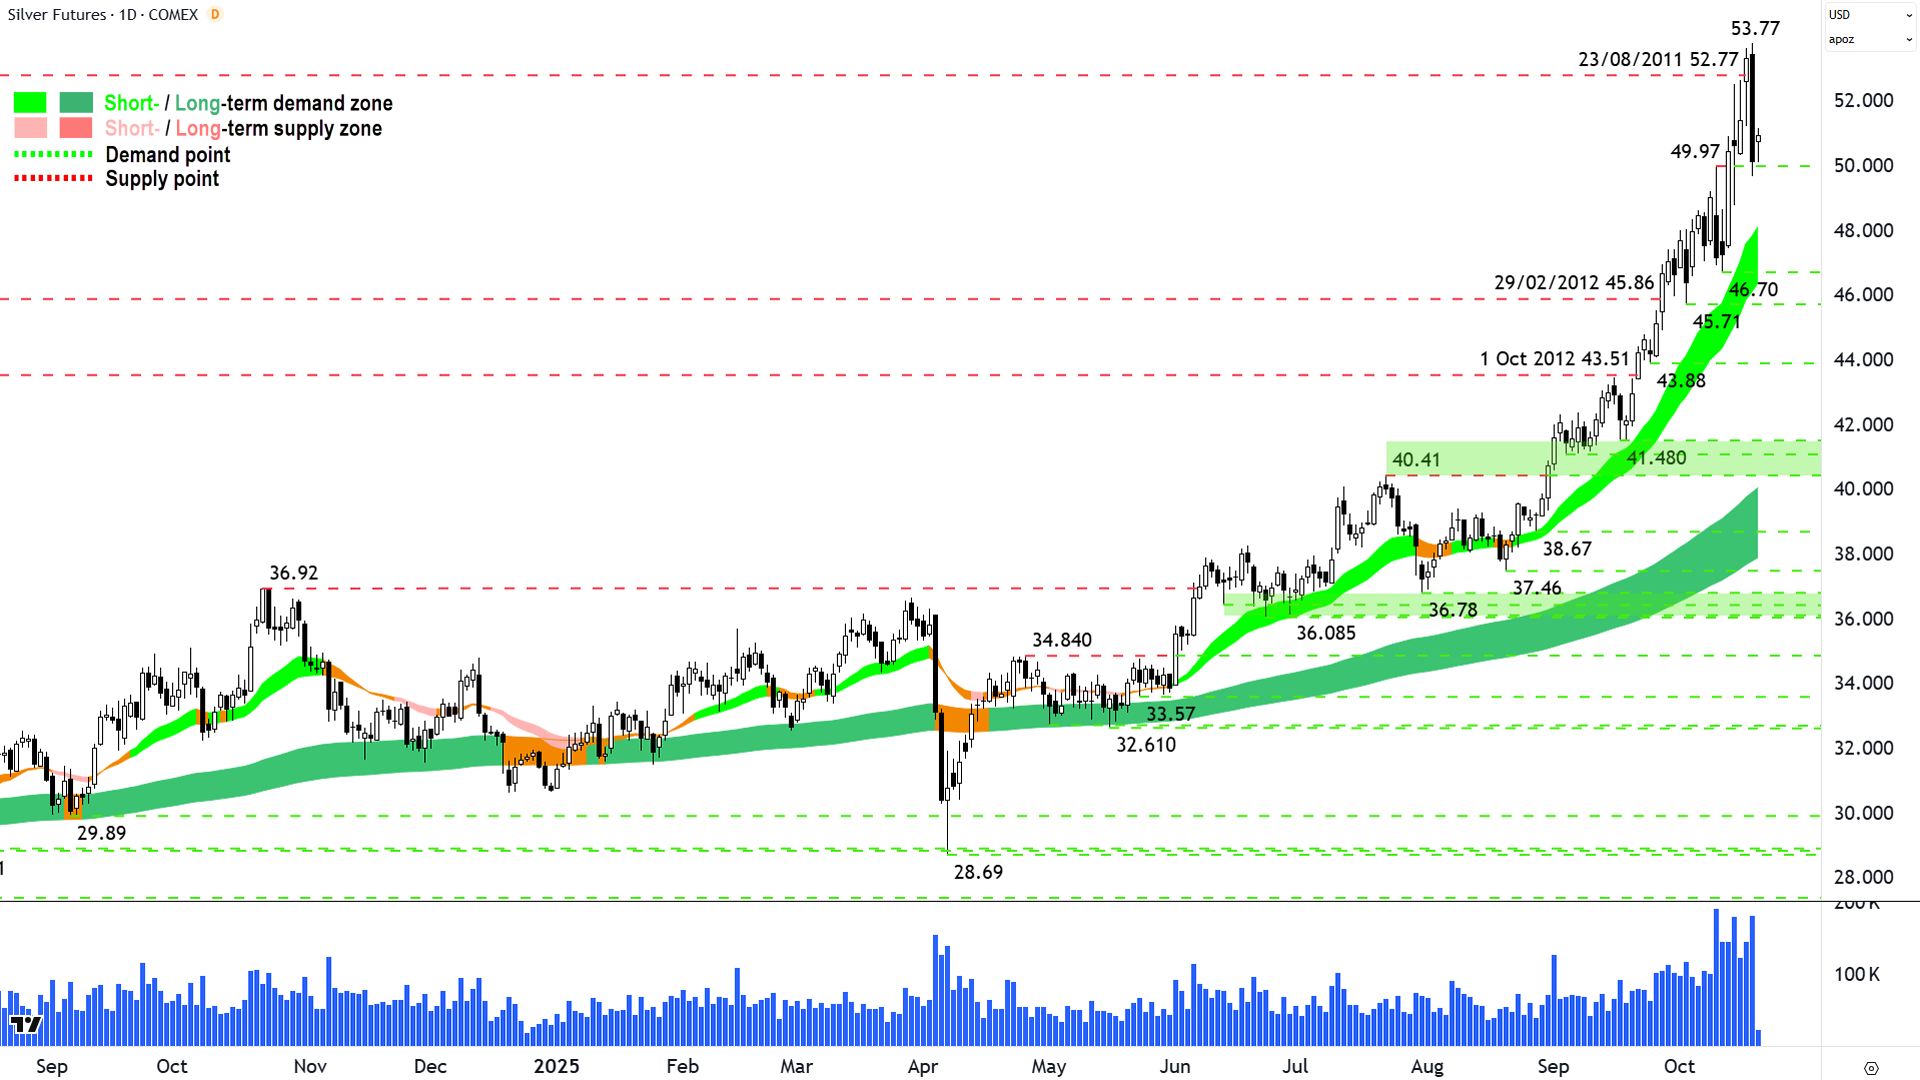
Silver slip up (click here for full size image)
Ditto above of course, but I note that silver’s Friday candle is longer and therefore more decisive for a potential transition to short term supply-side control. Volume was also elevated, but not a record as it was for gold.
Also as per gold, I should stress the long term trend remains impeccable. Therefore MOTN lies with this pullback washing through the system soon enough and with silver (and gold) continuing their winning ways.
Or not. 🤷
And that’s my closing point: There’s clearly some credible supply-side activity that’s popped up which means we're going to need to be alert from now on… but never alarmed! 🧐
View: No change to prevailing FRP view on silver.
Key levels: 46.70 is the closest point of demand, the price should not close below here if the demand-side is in control of silver's price; alternatively, a close below the short term uptrend ribbon (presently 46.40-48.10) will also nullify the short term uptrend = ⚠️
ChartWatch *LIVE* Webinar
ChartWatch *LIVE* Webinars – WEEKLY Wednesday's @ 12pm AEDT
Learn more about technical analysis and trend following through real case studies on ASX stocks. Australia's premier technical analyst, Carl Capolingua, shares his unique insights on stocks as requested by viewers. Ask about a company in your portfolio or anything related to trading and investing and get Carl's expert opinion.
Places are limited so >REGISTER NOW!<
