ChartWatch Markets: Did we just see the top in US stocks? Plus latest gold and silver technical analysis
Technical analysis of the most important global stock indices, commodities, bonds, FX, and crypto impacting your ASX portfolio each day.


Source: Shutterstock
Mentioned
KEY POINTS
- Okay, there was a bit of a sense of inevitability to last night’s dip in US stocks. As good as the S&P 500 and Nasdaq are, they were never going to go up forever. But is this just a run of the mill pullback, or is it the start of something more sinister?
- Gold and silver are well into their own “pullbacks they had to have”. Many gold and silver bulls just assume it’s a matter of time before they start to rise again and prove their hold on forever theories! But the technicals suggest it may not so simple.
- ChartWatch Markets delivers you the best technical analysis from one of the best technical analysts in the business. Get all the trends, price action and key levels to watch out for, and learn valuable lessons about investing along the way.
In today's edition of ChartWatch Markets, we'll be covering the technicals for:
Nasdaq Composite
Gold Futures (Front month, back-adjusted) COMEX
Silver Futures (Front month, back-adjusted) COMEX
Nasdaq Composite Index

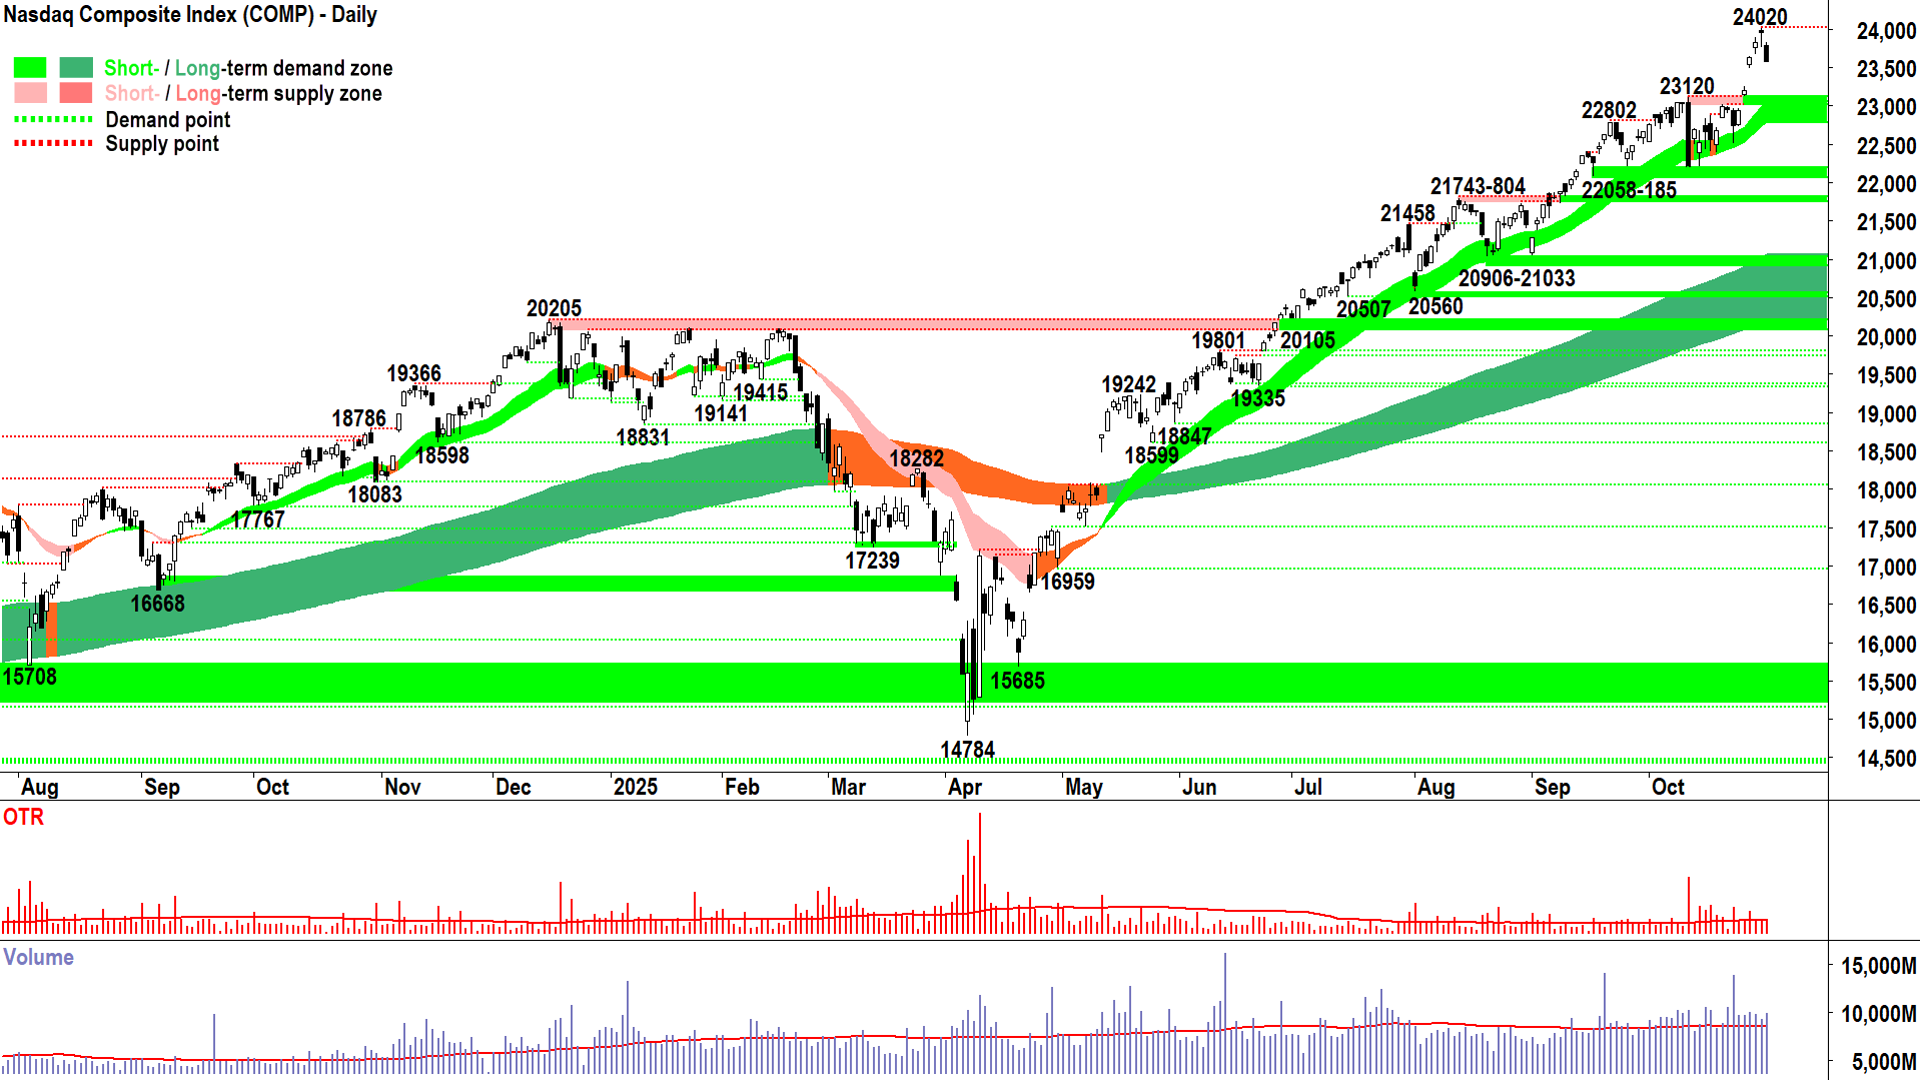
Nasdaq Composite Index chart (click here for full size image)
Okay, there was a bit of a sense of inevitability to last night’s move. As good as the Comp is, it was never going to go up forever – and as discussed in yesterday's update – it had travelled “a decent whack” away from the short term uptrend ribbon.
Last night’s move might simply be some of that mean reversion I hinted at... but the candle that formed definitely falls on the “credible supply” side of the equation – so potentially, there could be a follow through tonight.
You know I don’t do “targets” – the price will end up wherever it does and prediction is futile – but the “most logical area the Comp will next encounter excess demand”, let’s call it, is the previous supply zone of 23032-23120.
It’s a nice coincidence that this zone also coincides with the dynamic demand of the short term uptrend ribbon, currently 22785-23050. We now simply need to watch the price action at this area:
If the demand-side remains in control of the Comp’s price – we should see a trough set at or above that zone with strong demand-side candles (i.e., long white-bodied and or long downward pointing shadows).
If the supply-side is taking control of the Comp's price – we’ll see supply-side candles (i.e., long black-bodied and or long upward pointing shadows), and we’ll also likely see the setting of a lower peak (i.e., point of supply) to 24020.
Until then, I continue to back the short and long term uptrends here, which literally apart from Thursday’s candle – remain a clear picture of demand-side control.
Hey – the Comp is just as likely to log a strong demand-side candle tonight and dispense with what most assume will be the “pullback it had to have”. This scenario would not surprise me one bit…
View: I am FRP (Full Risk Position corresponds to a 100% allowable capital allocation limit for US stocks based on my personal risk management model).
Key levels: 23032-23120 is the closest point of demand, the price should not close below here if the demand-side is in control of the Comp's price; a close below the short term uptrend ribbon (presently 22785-23050) will nullify the short term uptrend = ⚠️
Gold Futures (Front month, back-adjusted) COMEX
%20COMEX%20chart_31%20Oct.png)
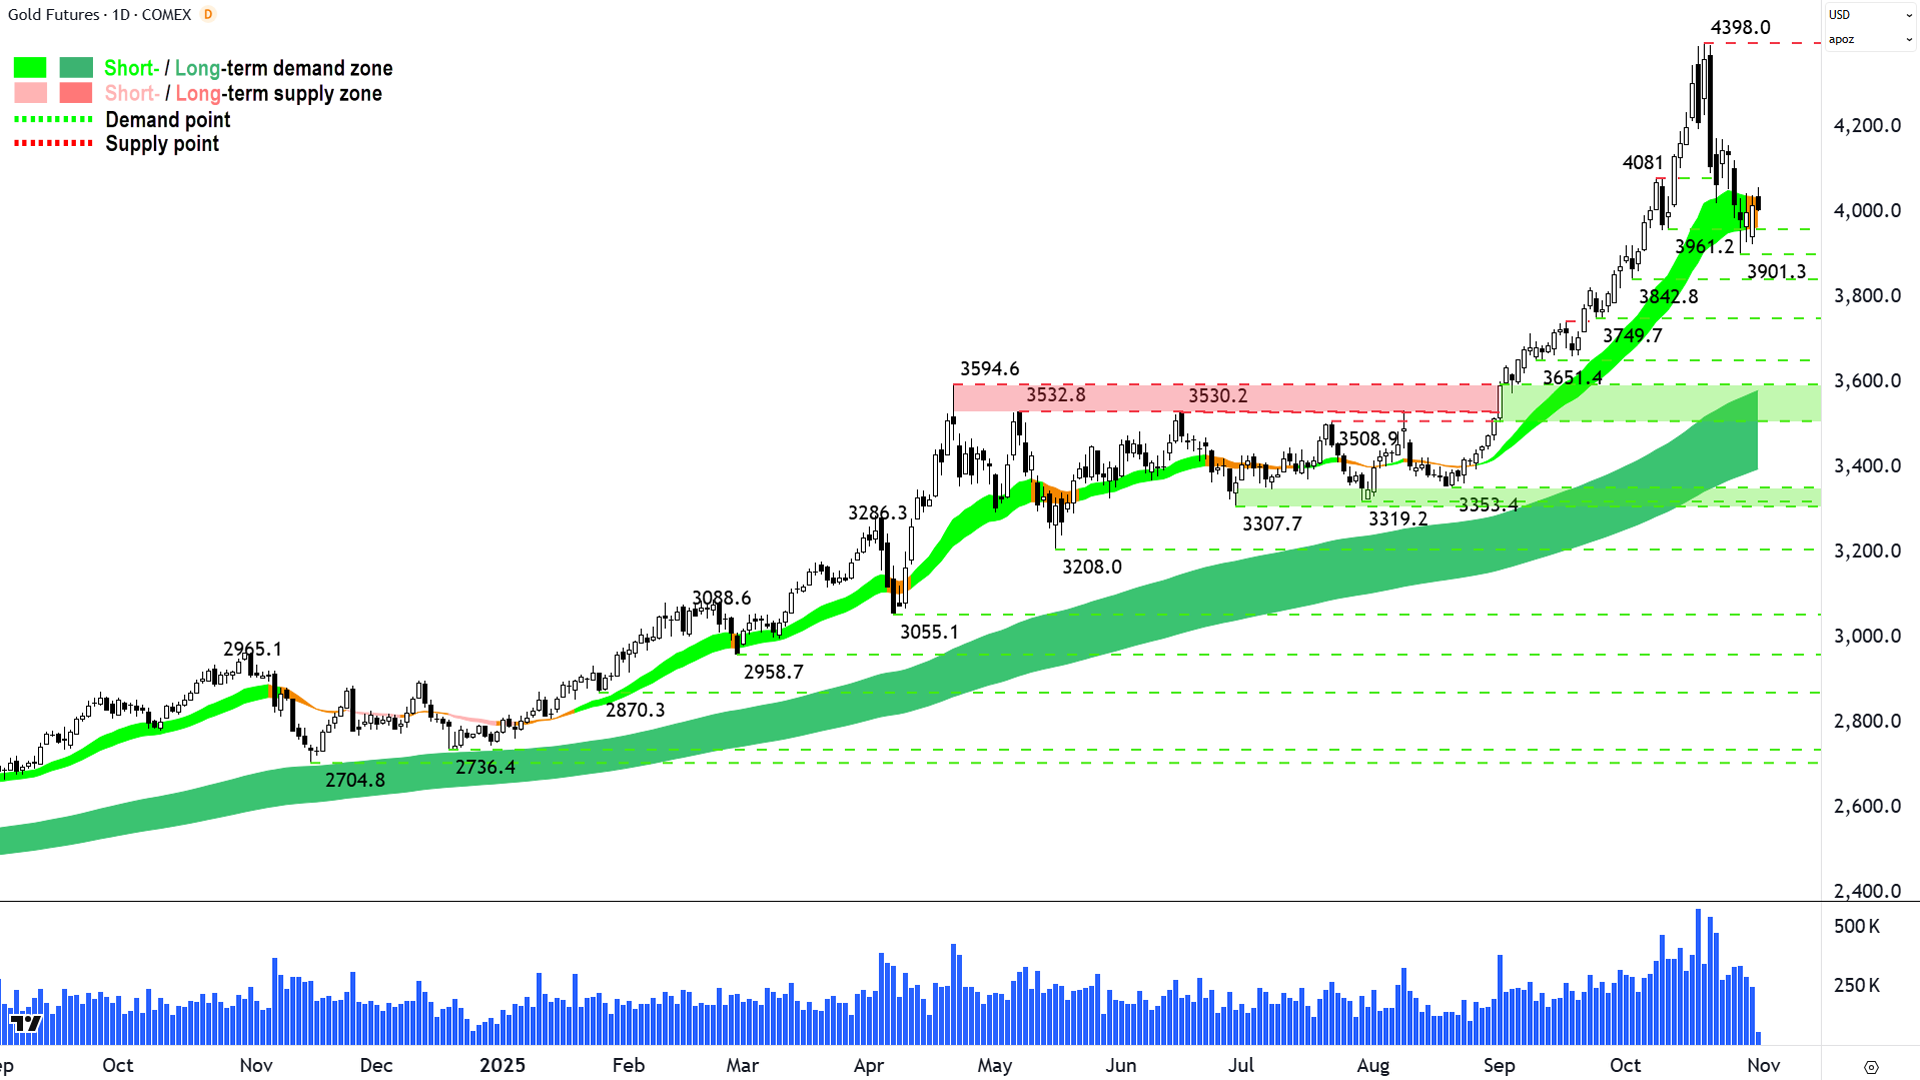
An interesting chart (click here for full size image)
The last time we covered gold was in ChartWatch Markets on 27-Oct.
In that update, we noted the credible supply-side showings in candles on 17 & 21-Oct had set the benchmark for where latent supply now resided in the gold market.
With “supply found”, the market dynamics had changed compared to on the way up where both the demand and supply-sides were working off an “anything is possible” basis.
Hey, anything is still possible – after the supply at 4398 is dealt with. It’s that simple. Both sides of the market will now look to that area – and the price action and volume that occurs there – to guide their next moves.
Supply will remain active and demand timid until we get such a resolution.
So far, the downward pointing shadow of 28-Oct, and the two very modest demand-side candles that followed on 29 & 30-Oct, are far from a confident return to control by the demand-side. Either they’re unwilling to impact the market enough to create more convincing demand-side showings – or they’re unable to.
The first option is simple: they’re not sure yet the supply-side is exhausted. The second option, that's far more concerning: they’re simply out of ammunition! For, if everyone who intends to buy gold has already bought gold – then who’s left to buy? 🤷
You end up with a demand-side vacuum, and it wouldn’t take a great deal of motivated supply to have a large impact on the price action in such an environment.
As always (yes, I type this every day!), the price action and volume will tell all:
An increasing prevalence of demand-side candles ✅
Higher trough to 3961.2 ✅
Close above the balance point (i.e., halfway point) of the 4398-3961.2 move (4180) ✅
These are all credible showings of excess demand. The opposite, i.e., supply-side candles, lower peak to 4398 – particularly if set below the balance point – are all credible signs that the supply-side is growing in influence.
But super important here: the quicker we fresh signs of demand-side control, the better. Why is quicker better? 🤔
Because "panic stricken FOMO" among the demand-side plus a "unanimous expectation of getting more" among the supply-side, drove this gold bull market – and their resumption will be vital in keeping it going.
The longer the gold price lingers without these signals and without seriously challenging 4398, the increasingly set in concrete will be the demand-supply environments psychology that:
There’s no great need to rush in (i.e., among the demand-side); and
Bummer… I may not get a better price that what I'm getting now (i.e., among the supply-side)
It really is that simple ladies and gentlemen…⚖️
(But Carl, what about the debasement of fiat currency, the proliferation of anti-USA bloc central bank buying, and the impending end of the digital financial system…📢).
Oh please! 🤦
View: In the last update, I noted that my technical model dictated running with a reduced risk exposure to gold, i.e., "-R". I have not seen a subsequent trigger to reduce risk further (nor to add risk), and so I am happy to remain at my present risk exposure, i.e., "=R". My model would consider a close below 3961.2 / the short term uptrend ribbon as a reason to further -R.
Key levels: 3961.2 is the closest point of demand, the price should not close below here if the demand-side is in control of gold's price; alternatively, a close below the short term uptrend ribbon (presently 3967-4035) will also nullify the short term uptrend = ⚠️
Silver Futures (Front month, back-adjusted) COMEX
%20COMEX%20chart_31%20Oct.png)
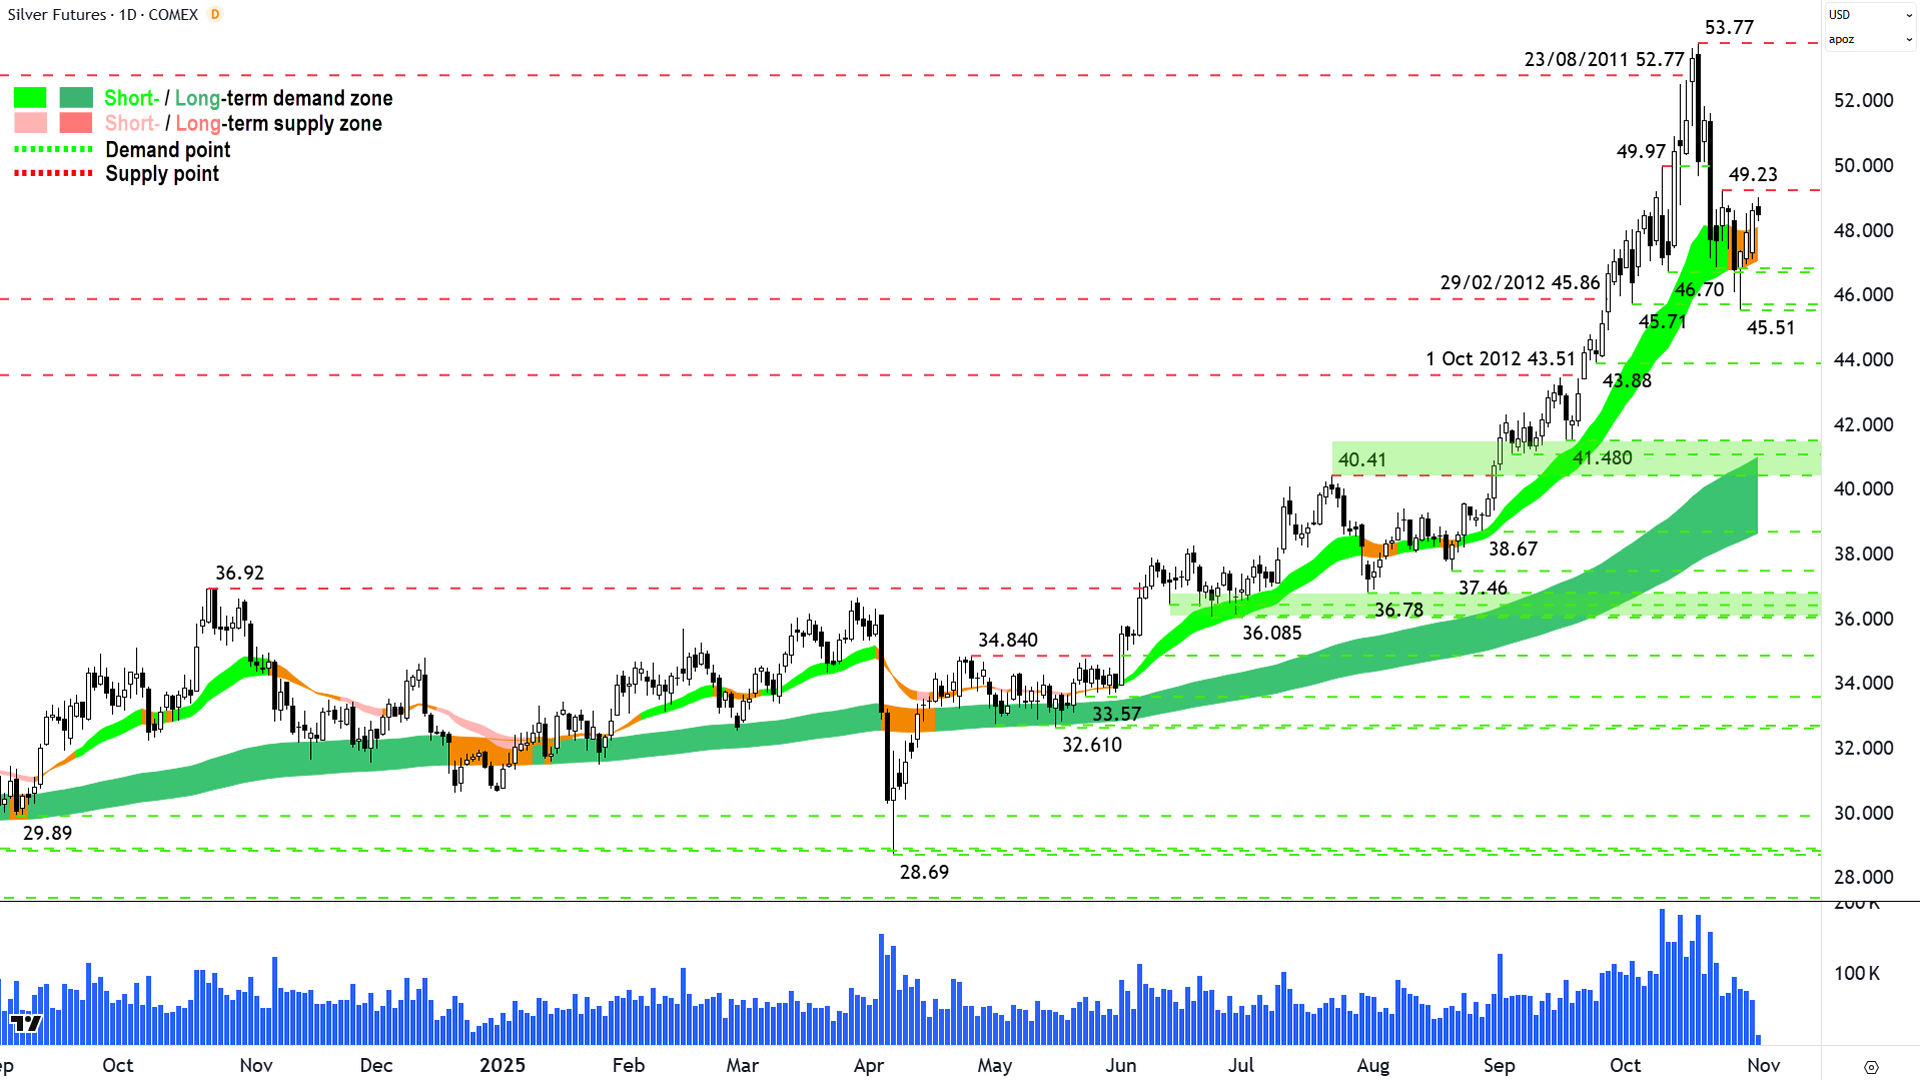
An interesting chart (click here for full size image)
The last time we covered silver was in ChartWatch Markets on 27-Oct.
In that update we noted all of the same concerns expressed for gold. Today's update is definitely in the "ditto" camp, but I do note a stronger set of demand-side candles in silver's rally this week compared to gold.
The long downward pointing shadow of 28-Oct implied some motivated buy the dip activity – and at an area that makes sense to see this kind of activity (i.e., 45.71-46.70 and the short term uptrend ribbon).
The candles of 29 & 30-Oct have clawed silver back above the short term trend ribbon, and together with 28-Oct's downward pointing shadow at 45.51 – mark a zone of demand that sets a go-no-go range for silver's short term uptrend.
As in, stay above it, keep logging decent demand-side candles, and a challenge of 53.77 should come sooner rather than later. However, if the present positivity flames out into supply-side candles, a lower peak to 53.77 – particularly below the balance point of 49.64 – then that go-no-go range is going to come under severe pressure.
View: In the last update, I noted that my technical model dictated -R for silver. I have not seen a subsequent trigger to reduce risk further (nor to add risk), and so I am happy to run at =R. My model would consider a close below 45.51 / the short term uptrend ribbon as a reason to further -R.
Key levels: 45.51 is the closest point of demand, the price should not close below here if the demand-side is in control of silver's price; alternatively, a close below the short term uptrend ribbon (presently 47.05-48.10) will also nullify the short term uptrend = ⚠️
ChartWatch *LIVE* Webinar
ChartWatch *LIVE* Webinars – WEEKLY Wednesday's @ 12pm AEDT
Learn more about technical analysis and trend following through real case studies on ASX stocks. Australia's premier technical analyst, Carl Capolingua, shares his unique insights on stocks as requested by viewers. Ask about a company in your portfolio or anything related to trading and investing and get Carl's expert opinion.
Places are limited so >REGISTER NOW!<
