News | Market Wraps
Evening Wrap: ASX 200 down but not out as US bond market woes weigh on stocks, gold shines again
The S&P/ASX 200 closed 38.1 points lower, down %.

Mentioned
The S&P/ASX 200 closed 38.1 points lower, down %.
It could have been a great deal worse today. A 40-odd point loss in the benchmark ASX 200 is never much fun, but it could have been an 80-odd point loss at the worst point of the day.
Markets are again concerned about the US bond market. It's not "beautiful again" as President Trump assured us a little while ago. It's chucking a bit of a hissy fit, and that's creating increased uncertainty in markets – and we all know how investors hate uncertainty.
It makes them sell risky assets, like stocks, but it also makes them more prone to sticking a few bucks in gold. And this is what's helped the local Gold Sub-Index (XGD) (+3.3%) to another tidy gain today (it was up a whopping 5% yesterday!).
The rest was a little subdued, as you'd expect, with most of the other major sectors lower on the day. Information Technology (XIJ) (-1.6%) was hardest hit, tracking a big fall on the Nasdaq, with global growth-oriented Energy (XEJ) (-1.4%) and interest rate sensitive Consumer Discretionary (XDJ) (-1.1%) next-worst.
To make sense of all the above, I have detailed technical analysis on the Nasdaq Composite, S&P/ASX 200, and Uranium in today's ChartWatch.
Be sure to click/scroll through for the usual reporting of the major sector and stock-specific moves, the broker responses to them, as well as all the key upcoming economic data in tonight's Evening Wrap.
Let's dive in!
Today in Review
Thu 22 May 25, 5:26pm (AEST)
Name | Value | % Chg |
|---|---|---|
Major Indices | ||
| ASX 200 | 8,348.7 | -0.45% |
| All Ords | 8,571.4 | -0.47% |
| Small Ords | 3,174.9 | +0.18% |
| All Tech | 3,878.4 | -1.40% |
| Emerging Companies | 2,253.5 | +0.08% |
Currency | ||
| AUD/USD | 0.642 | 0.00% |
US Futures | ||
| S&P 500 | 5,875.25 | +0.24% |
| Dow Jones | 41,986.0 | +0.09% |
| Nasdaq | 21,222.75 | +0.31% |
Name | Value | % Chg |
|---|---|---|
Sector | ||
| Materials | 16,509.9 | +0.60% |
| Utilities | 9,417.3 | -0.01% |
| Communication Services | 1,811.1 | -0.13% |
| Consumer Staples | 12,450.3 | -0.15% |
| Health Care | 41,760.6 | -0.31% |
| Industrials | 8,238.8 | -0.32% |
| Real Estate | 3,826.8 | -0.72% |
| Financials | 8,962.8 | -0.79% |
| Consumer Discretionary | 4,055.5 | -1.06% |
| Energy | 7,675.4 | -1.39% |
| Information Technology | 2,742.3 | -1.64% |
Markets
%20intraday%20chart%2022%20May%202025.png)
ASX 200 Session Chart
The S&P/ASX 200 (XJO) finished 38.1 points lower at 8,348.7, roughly mid-range for the second day running, 0.45% from its session low and 0.46% from its high. Also for the second day running, the broader market told a weaker story, with the broader-based S&P/ASX 300 (XKO) showing advancers beat decliners by a disappointing 93 to 180.
If you haven't read this article, which explains the nature and magnitude of last night's events in US markets...then you really should. It by extension explains what happened on the local stock market today, and why the Comp logged such a disturbing supply-side candle (see ChartWatch below).
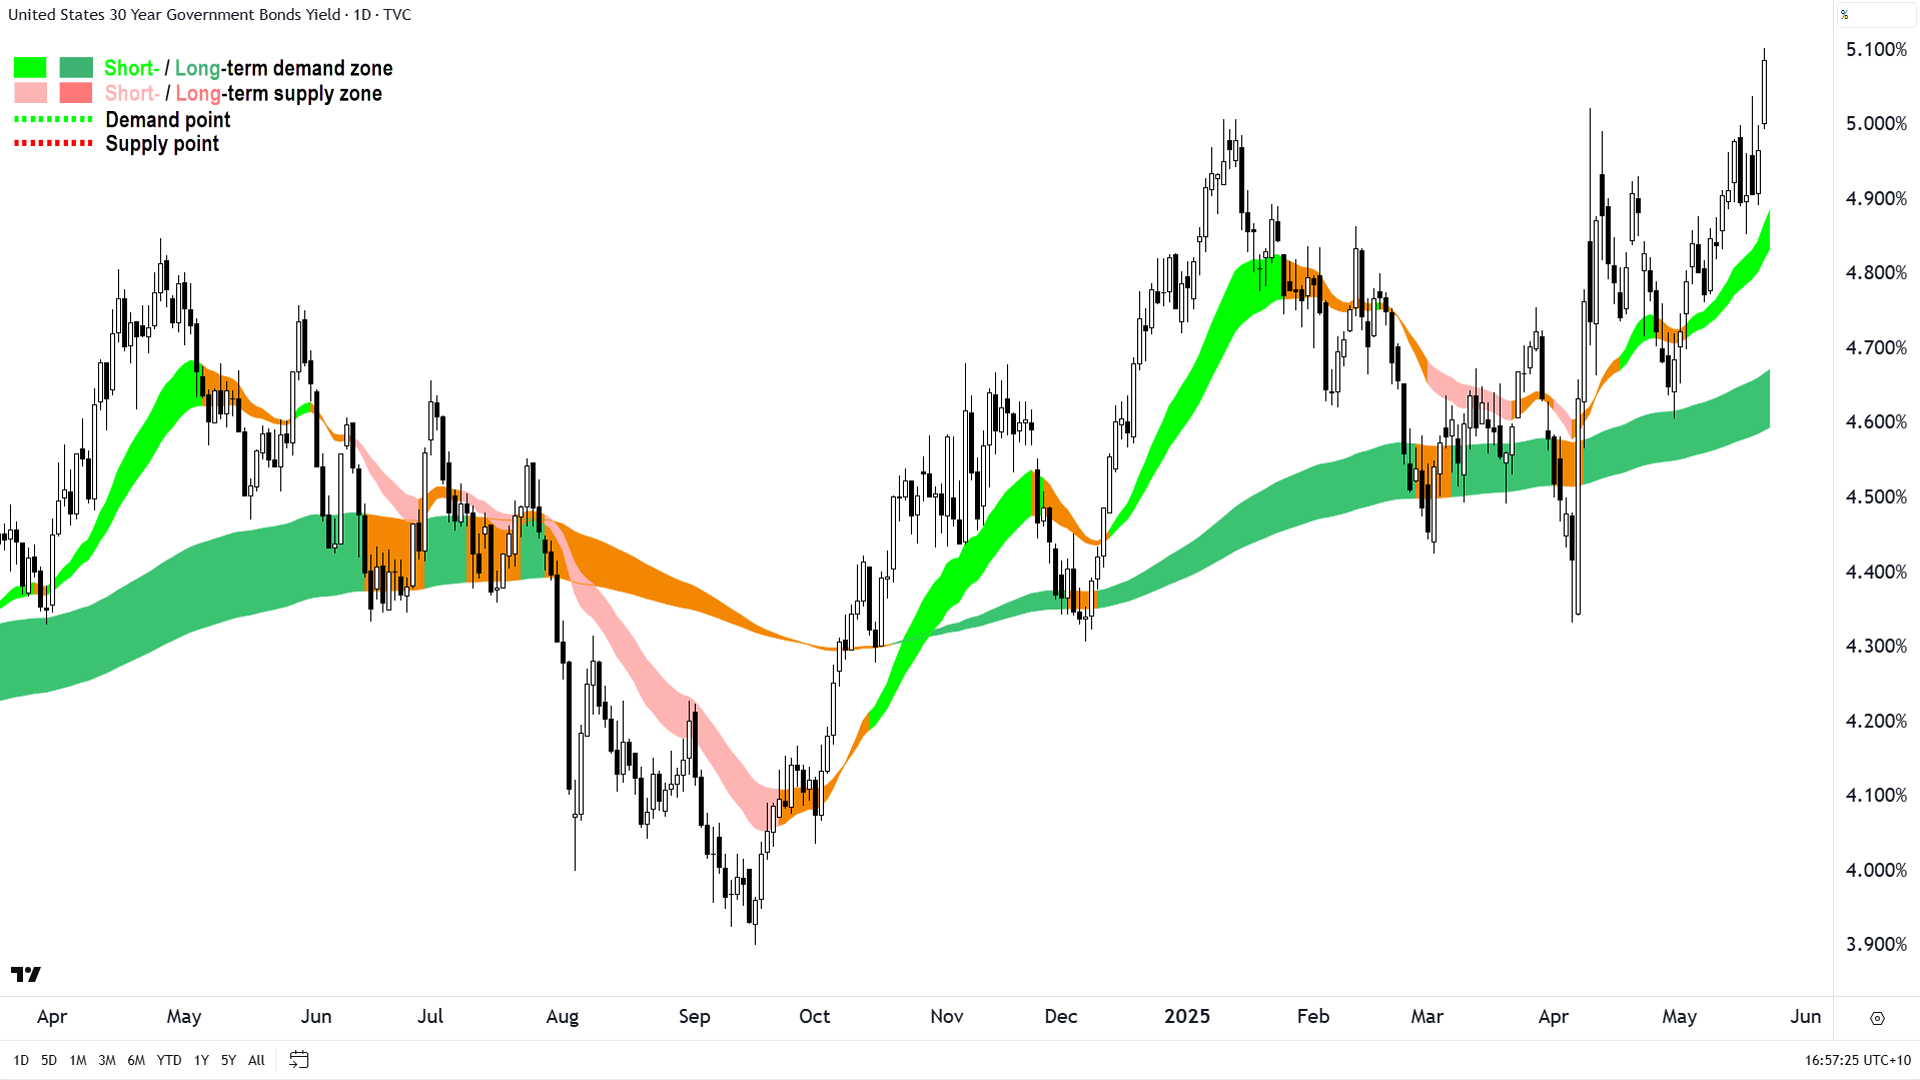
I'll leave you with a daily chart of the US 30-year Treasury Bond yield, as the one in the article is a longer term / weekly line chart. You just have to think: Would I buy or sell this chart? 🤔
The ramifications are potentially substantial (again...read the article!)

US 30 Year T-Bond Yield (click here for full size image)
ChartWatch
NASDAQ Composite Index

So, we have the smoking gun 🔫 (click here for full size image)
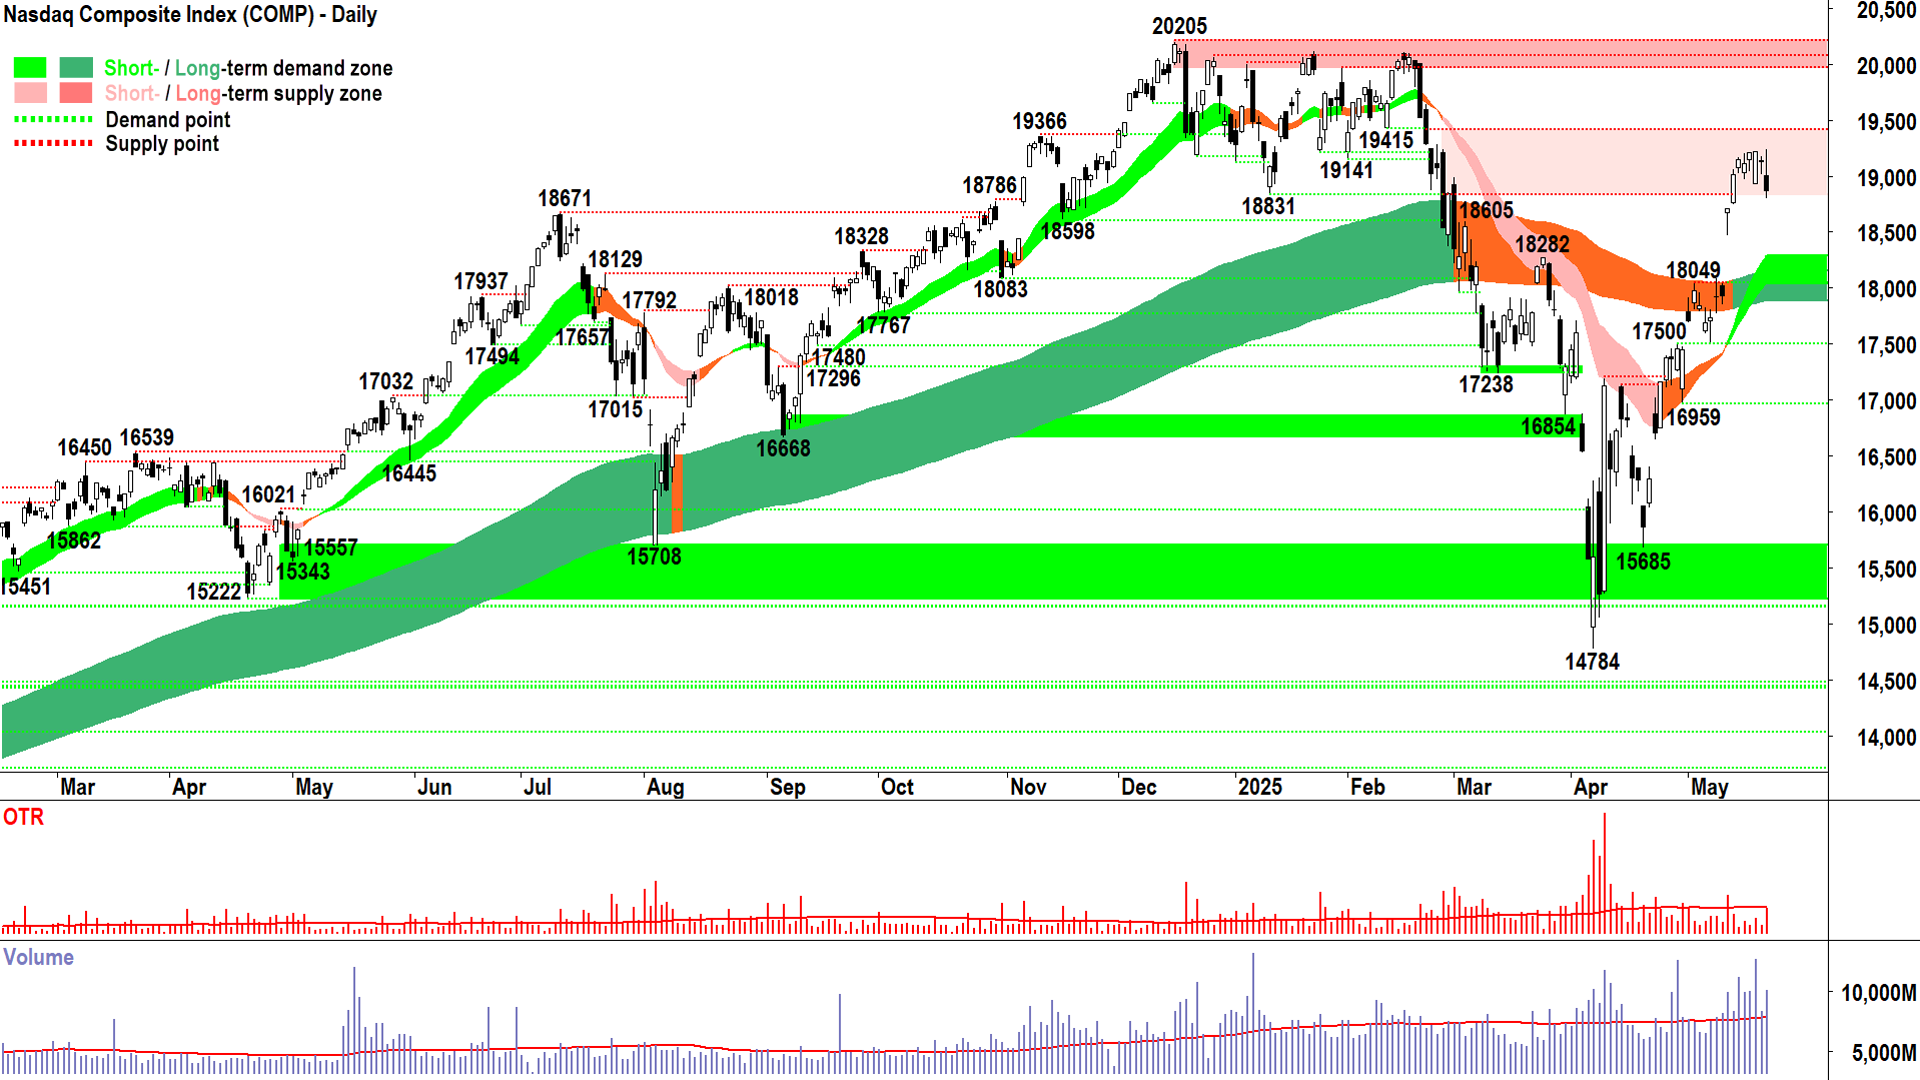
Yesterday I discussed the dynamics behind a downward pointing shadow: Buy the dip, consistent with demand-side control.
Due to the shenanigans in the bond market, we got the exact opposite last night on the Comp.
The Comp is about as risk-on as you can get – so when markets swing risk-off – we should expect the price action to show magnified impacts here.
Start with the fact that the Comp opened well down from Tuesday’s close, but then staged a strong rally until just before 1pm – a rally that saw it trading above the high of the recent cluster of demand side candles at 19242.
So, we had a look at the start of a continuation of the rally, and if we squinted, at 20205 and new highs.
I just want to get across the optimism washing through US stock markets at about 12.50 pm New York time. Looking at the volume, and from this chart we can’t see where along the candle the trading occurred, but I suggest given the significantly above average volume, there was some solid demand lurking in the system around then.
What happened at 1pm New York time?
Yep, Treasury released the results of the 20-year T-Bond auction.
Then we get the “rest of the candle” in that last three and half hours of trade. The bit that takes us from 19242, down through the opening price to create the upward pointing shadow and black body of Wednesday’s candle.
So, we have the smoking gun. The direct link between what flipped the market from days of demand-side dominated price action to a disturbingly strong supply-side showing – that long upward pointing shadow and engulfing candle.
Markets are worried about the bond market. The same bond market that sunk Trump’s Liberation Day Tariffs and made him back off his rhetoric about sacking Fed Chairman Jerome Powell.
You gotta remember: The bond market is the most important market on the planet…it sets the price of risk-free money and the price of risk-free money sets the price of every other asset.
Wednesday’s candle engulfed the prior 5 candles. On significant volume – signalling that probably quite a bit of demand was consumed / quite a bit of supply was around to consume it.
The low close suggests they might not be done.
Add it all up and what does it mean? 🤔
It means we found supply. We know where it is – it’s at 19242. We also know there’s a good chance we see at least some follow through today.
So, let’s talk potential demand zones, because talk of 20205 is off the table for a while. Clearly, the short term uptrend ribbon is the most logical area where we might see the demand-side reassert itself. That’s presently kicking in around 18290.
If we see another strong supply-side showing tonight (i.e., long black body and or long upward pointing shadow) the chances of tapping that short term trend ribbon grows very high.
Alternatively, we still are in a solid short and long term demand-side market – don’t underestimate the demand that is quite likely still lurking in the system – it got us up to 19242 in the first place!
It makes tonight pretty darn important I’d hazard to say. If the supply-side, emboldened by last night’s price action and volume, can be very firmly put in their place – then it may be the straw / candle that breaks their back.
S&P/ASX 200 (XJO)
%20chart%2022%20May%202025.png)
God bless value investors 🤓! (click here for full size image)
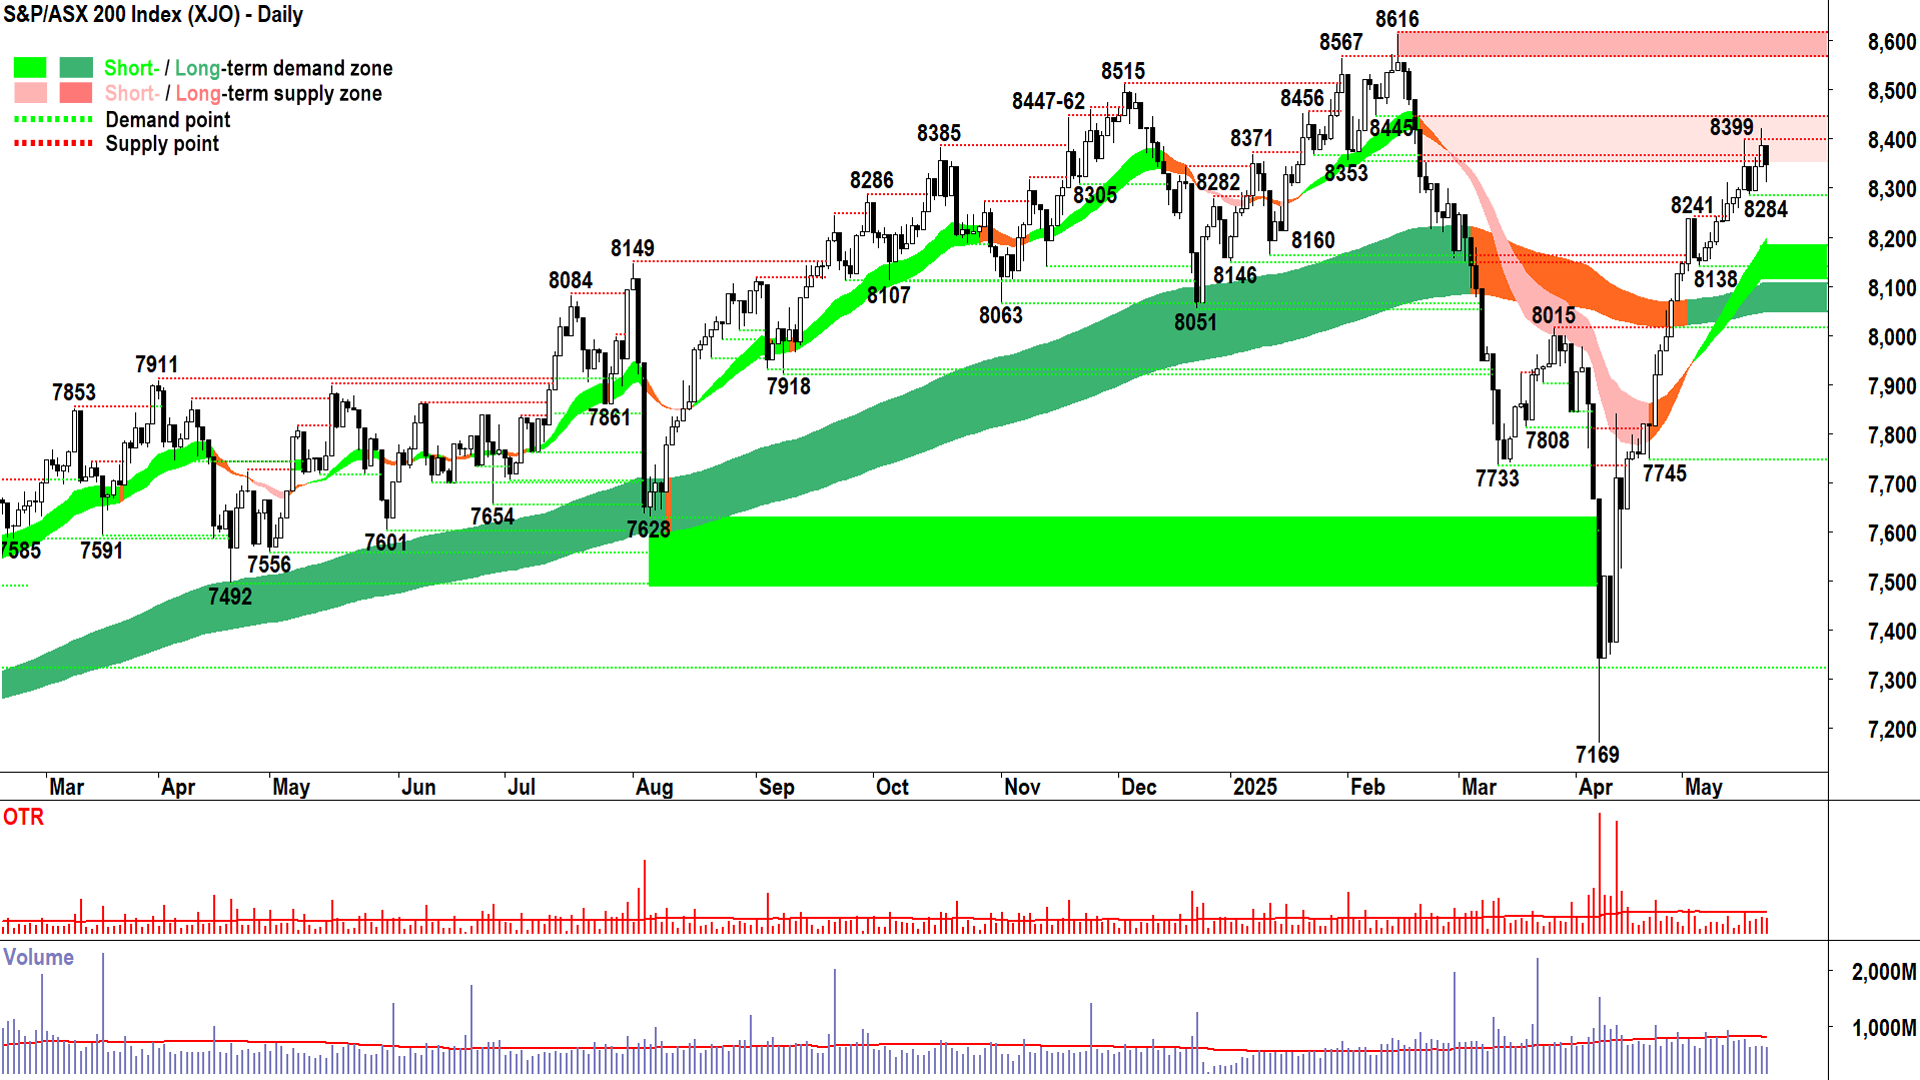
Hey, it could have been a whole lot worse today. I mean, given how lousy we’ve been compared to the Comp lately – much worse.
So, I take heart in today’s price action on the XJO. That downward pointing shadow, even though only roughly half the session’s range, still smacks of decent and persistent demand-side interaction.
It’s certainly nothing too dramatic compared to yesterday's candle in which we complained of a “pesky” supply-side that continues to nag away at anything that resembles and assertive move higher.
If anything, the candles of the last couple of sessions speak of a potentially growing equilibrium. We’ve had a massive rally from the 7169 low – more than we’d typically rise in a whole year (in a good year!).
This rally has created some doubt about valuations and the speed of the rally, diminishing the appetite of value investors (ahhh bless their little hearts…all intrinsic value and moats 🤓…gotta love ‘em!)
8284 is important now. Obviously, the short term uptrend ribbon is substantially more so (kicks in around 8197). A vibration between there and 8445 would do nothing to harm our chances of pushing back to new highs in due course.
It just might be the case that we’ve hit a little bit of turbulence in our recent plain-sailing rally, and therefore we must do a little work here…consuming the non-believers (and value investors)…before we can move on and tackle 8616.
Uranium Futures (Front month, back-adjusted) COMEX
%20COMEX%20chart%2021%20May%202025.png)
Long term trend ribbon is just going its job... (click here for full size image)
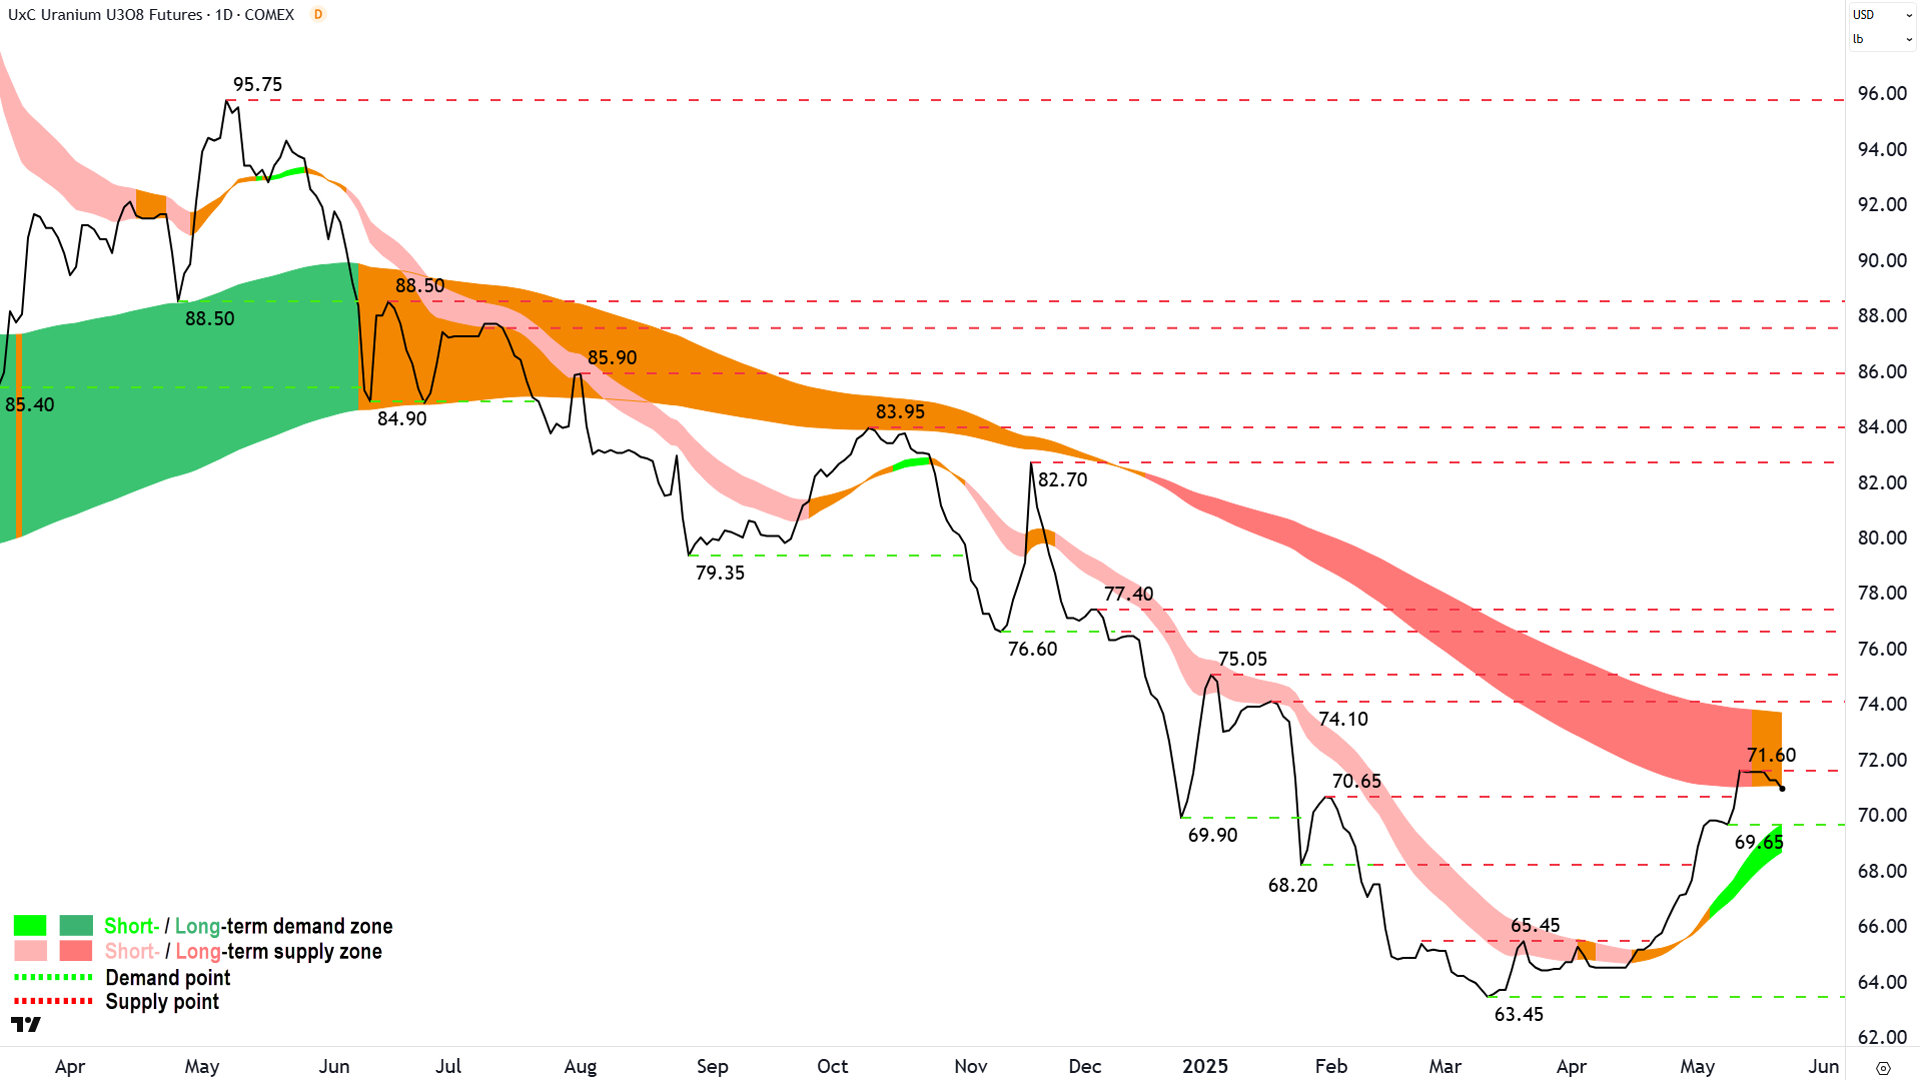
Don’t hate the long term trend ribbon for doing its job! You know, repelling short term uptrends during a bear market 💪.
The uranium price has hit a little snag, pulling back from the newly formed peak of 71.60.
One could get all dramatic and say that the sky is falling 🐔. Or we could say that the pullback is a necessary part of determining the next phase of this uranium bear to bull transition (or back to bear!).
A quickly set trough, followed by a close above 71.60 would go a long way to entrench the short term uptrend / long term equilibrium narrative.
And then all we really need is a close above the long term trend ribbon and one subsequent trough set at or above it to confirm the transition to a new long term uptrend.
In the meantime, the short term trend remains solid, as does the overall price action of rising peaks and rising troughs.
So, there’s really nothing to do here but await the next few candles of price action. The demand and supply will tell us everything we need to know – as it always does.
I should mention the bear case, as it’s still a very real possibility. Basically, we’ll know if it’s all coming undone for the uranium price if it closes below the short term uptrend ribbon.
Economy
Today
AUS Flash Manufacturing Purchasing Managers Index (PMI) May:
Manufacturing: 51.7 unchanged from April
Services: 50.5 vs 51.0 in April (revised down from 51.4)
Later this week
Thursday
18:00 EUR Flash Manufacturing PMI:
Manufacturing: 49.3 forecast and 49.0 in April
Services: 50.6 forecast and 50.1 in April
23:45 USA Flash Manufacturing PMI:
Manufacturing: 49.9 forecast and 50.2 in April
Services: 50.7 forecast and 50.8 in April
Friday
00:00 Existing Home Sales April (4.15 million forecast vs 4.02 million in March)
Saturday
00:00 New Home Sales April (696,000 forecast vs 724,000 in March)
Latest News
Interesting Movers
Trading higher
+67.9% New World Resources (NWC) – New World Enters Into A$185M Scheme With Central Asia Metals, rise is consistent with prevailing short term uptrend and long term trend is transitioning from down to up 🔎📈
+21.2% SKS Technologies Group (SKS) – Investor Presentation Rapid Insights Conference and SKS Announces $100M Data Centre Contract.
+14.5% Toubani Resources (TRE) – No news, general strength across the broader Gold sector today, rise is consistent with prevailing short and long term uptrends 🔎📈
+13.6% Dateline Resources (DTR) – No news, general strength across the broader Gold sector today, rise is consistent with prevailing short and long term uptrends, a regular in ChartWatch ASX Scans Uptrends list 🔎📈
+12.5% 29METALS (29M) – No news 🤔
+11.3% Koonenberry Gold (KNB) – Lion invests $1.0M in Koonenberry, general strength across the broader Gold sector today.
+8.4% Catapult Group International (CAT) – FY25 Results CEO & MD, CFO Addresses, rise is consistent with prevailing short and long term uptrends, a regular in ChartWatch ASX Scans Uptrends list 🔎📈
Trading lower
-16.6% Victory Metals (VTM) – Response to ASX Price and Volume Query.
-7.9% Cromwell Property Group (CMW) – ESR reduces ownership in Cromwell, fall is consistent with prevailing long term downtrend 🔎📉
-7.8% EBR Systems (EBR) – EBR successfully completes a A$55.9 million Placement and EBR Capital Raising Presentation, fall is consistent with prevailing short term downtrend and long term trend is transitioning from up to down, a recent regular in ChartWatch ASX Scans Downtrends list 🔎📉
-6.9% Coronado Global Resources (CRN) – No news, fall is consistent with prevailing short and long term downtrends, THE MOST Featured (highest conviction) stocks in ChartWatch ASX Scans Downtrends list 🔎📉
-6.5% Zip Co. (ZIP) – No news, repelled perfectly from long term downtrend ribbon! 🔎📉
-6.4% Nufarm (NUF) – Continued negative response to 21-Apr Nufarm HY25 results, fall is consistent with prevailing short and long term downtrends, a regular in ChartWatch ASX Scans Downtrends list 🔎📉
-5.1% Cettire (CTT) – No news, fall is consistent with prevailing short and long term downtrends, a regular in ChartWatch ASX Scans Downtrends list 🔎📉
-4.9% Paladin Energy (PDN) – No news, general weakness across the broader Uranium sector today (uranium price is pulling back a touch – see ChartWatch above).
-4.6% Deep Yellow (DYL) – No news, ditto general weakness across the broader Uranium sector today.
Broker Moves
Auckland International Airport (AIA)
Retained at neutral at UBS; Price Target: NZ$8.20
Antipa Minerals (AZY)
Retained at buy at Shaw and Partners; Price Target: $0.660
Catapult Group International (CAT)
Retained at hold at Bell Potter; Price Target: $5.00 from $4.40
Retained at buy at UBS; Price Target: $5.70 from $5.00
Cobram Estate Olives (CBO)
Retained at buy at Shaw and Partners; Price Target: $2.25
Corporate Travel Management (CTD)
Retained at buy at UBS; Price Target: $13.55
Dicker Data (DDR)
Retained at neutral at Goldman Sachs; Price Target: $9.05 from $9.80
Retained at buy at Jarden; Price Target: $11.00 from $10.88
Retained at overweight at JP Morgan; Price Target: $10.20 from $10.80
Retained at buy at UBS; Price Target: $9.30 from $10.20
Dexus Industria Reit. (DXI)
Retained at hold at Bell Potter; Price Target: $2.95 from $2.90
Flight Centre Travel Group (FLT)
Retained at buy at UBS; Price Target: $15.00
Insurance Australia Group (IAG)
Retained at outperform at Macquarie; Price Target: $8.50
James Hardie Industries (JHX)
Retained at neutral at Citi; Price Target: $41.50 from $43.20
Retained at neutral at Macquarie; Price Target: $39.80 from $40.20
Retained at overweight at Morgan Stanley; Price Target: $53.00 from $55.00
Retained at hold at Ord Minnett; Price Target: $40.00 from $41.00
Kogan.Com (KGN)
Retained at hold at Bell Potter; Price Target: $4.50 from $5.00
Light & Wonder (LNW)
Retained at buy at Citi; Price Target: $193.00
Retained at add at Morgans; Price Target: $200.00 from $193.00
Retained at buy at UBS; Price Target: $192.00
Metro Mining (MMI)
Retained at buy at Shaw and Partners; Price Target: $0.170
Nick Scali (NCK)
Retained at outperform at Macquarie; Price Target: $19.90
NIB (NHF)
Retained at underperform at Macquarie; Price Target: $5.55
Nufarm (NUF)
Retained at buy at Bell Potter; Price Target: $3.45 from $4.35
Retained at sell at Citi; Price Target: $2.60 from $3.75
Downgraded to underperform from hold at Jefferies; Price Target: $1.960 from $4.40
Retained at neutral at Macquarie; Price Target: $3.20 from $4.11
Retained at equal-weight at Morgan Stanley; Price Target: $2.80 from $3.90
Retained at sector perform at RBC Capital Markets; Price Target: $3.50 from $5.00
Nextdc (NXT)
Retained at buy at UBS; Price Target: $19.80
Qantas Airways (QAN)
Retained at neutral at UBS; Price Target: $9.30
Resmed Inc (RMD)
Retained at buy at Ord Minnett; Price Target: $46.50
Regis Resources (RRL)
Retained at hold at Bell Potter; Price Target: $4.72 from $4.57
Seek (SEK)
Retained at outperform at CLSA; Price Target: $29.00 from $28.00
Retained at positive at E&P; Price Target: $28.00 from $27.80
Retained at buy at Jarden; Price Target: $27.50
Retained at overweight at JP Morgan; Price Target: $27.00
Retained at buy at UBS; Price Target: $30.10
SGH (SGH)
Retained at outperform at Macquarie; Price Target: $59.25 from $56.10
Retained at buy at UBS; Price Target: $60.00 from $58.65
Serko (SKO)
Retained at buy at Citi; Price Target: $3.45 from $4.25
Sky Network Television (SKT)
Retained at outperform at Macquarie; Price Target: NZ$3.56 from NZ$3.03
Suncorp Group (SUN)
Retained at neutral at Macquarie; Price Target: $19.20
Syrah Resources (SYR)
Downgraded to neutral from outperform at Macquarie; Price Target: $0.300 from $0.270
Talga Group (TLG)
Retained at outperform at Macquarie; Price Target: $0.500 from $0.600
Technology One (TNE)
Downgraded to hold from outperform at CLSA; Price Target: $39.50 from $33.00
Treasury Wine Estates (TWE)
Downgraded to hold from buy at Ord Minnett; Price Target: $9.50 from $12.00
Tower (TWR)
Retained at outperform at Macquarie; Price Target: NZ$1.68 from NZ$1.58
WEB Travel Group (WEB)
Retained at neutral at UBS; Price Target: $6.15
Webjet (WJL)
Retained at outperform at CLSA; Price Target: $1.250 from $1.000
Retained at buy at Goldman Sachs; Price Target: $0.900 from $0.800
Downgraded to hold from buy at Jefferies; Price Target: $0.950 from $0.900
Retained at overweight at JP Morgan; Price Target: $0.950 from $0.800
Retained at hold at Morgans; Price Target: $0.900 from $0.650
Retained at buy at Ord Minnett; Price Target: $1.760 from $1.590
Worley (WOR)
Retained at add at Morgans; Price Target: $16.80 from $17.70
Scans
Top Gainers
Code | Company | Last | % Chg |
|---|---|---|---|
| NWC | New World Resources Ltd | $0.047 | +67.86% |
| CP8 | Canadian Phosphate Ltd | $0.031 | +55.00% |
| HTA | Hutchison Telecommunications (Australia) Ltd | $0.032 | +52.38% |
| POD | Podium Minerals Ltd | $0.034 | +36.00% |
| MKL | Mighty Kingdom Ltd | $0.012 | +33.33% |
Top Fallers
Code | Company | Last | % Chg |
|---|---|---|---|
| CRI | Critica Ltd | $0.013 | -23.53% |
| EQR | EQ Resources Ltd | $0.039 | -20.41% |
| PFT | Pure Foods Tasmania Ltd | $0.016 | -20.00% |
| VTM | Victory Metals Ltd | $0.855 | -16.59% |
| IAM | Income Asset Management Group Ltd | $0.021 | -16.00% |
52 Week Highs
Code | Company | Last | % Chg |
|---|---|---|---|
| NWC | New World Resources Ltd | $0.047 | +67.86% |
| OCN | Oceana Lithium Ltd | $0.068 | +25.93% |
| GHM | Golden Horse Minerals Ltd | $0.47 | +11.91% |
| MPW | Metal Powder Works Ltd | $0.65 | +10.17% |
| CAT | Catapult Group International Ltd | $5.30 | +8.38% |
52 Week Lows
Code | Company | Last | % Chg |
|---|---|---|---|
| AUG | Augustus Minerals Ltd | $0.023 | -14.82% |
| DUB | Dubber Corporation Ltd | $0.015 | -11.77% |
| KOB | Koba Resources Ltd | $0.038 | -9.52% |
| QML | Qmines Ltd | $0.034 | -8.11% |
| GTE | Great Western Exploration Ltd | $0.012 | -7.69% |
Near Highs
Code | Company | Last | % Chg |
|---|---|---|---|
| OZBD | Betashares Australian Composite Bond ETF | $44.70 | +0.02% |
| WVOL | Ishares MSCI World Ex Aust Minimum Volatility ETF | $44.18 | -0.32% |
| AII | Almonty Industries Inc | $2.75 | -2.83% |
| STK | Strickland Metals Ltd | $0.12 | +14.29% |
| IAGPF | Insurance Australia Group Ltd | $104.30 | +0.26% |
Relative Strength Index (RSI) Oversold
Code | Company | Last | % Chg |
|---|---|---|---|
| AVH | Avita Medical Inc | $2.05 | -3.30% |
| CRN | Coronado Global Resources Inc | $0.135 | -6.90% |
| AOF | Australian Unity Office Fund | $0.48 | 0.00% |
| SKC | Skycity Entertainment Group Ltd | $0.90 | -0.55% |
| NFNG | Nufarm Finance (NZ) Ltd | $84.99 | -2.42% |
