News | Market Wraps
Evening Wrap: ASX 200 closes out massively strong week as big banks & BHP, RIO, FMG hoover up safe-haven buying
The S&P/ASX 200 closed 47.7 points higher, up 0.60%.

Mentioned
The S&P/ASX 200 closed 47.7 points higher, up 0.60%.
Another strong performance from Australian shares today, led mainly by all the stuff you'd want to go up if you want to get back to the highs prior to President Trump pulling the lever on Anything Goes Trade Policy Month.
So, we're talking the big banks, like ANZ Group (ANZ) (+1.5%), Macquarie Group (MQG) (+1.2%), and Westpac Banking Corp. (WBC) (+1.1%). The big miners, like BHP Group (BHP) (+0.90%), Rio Tinto (RIO) (+0.95%), and Fortescue (FMG) (+1.0%). Even recent straggler CSL (CSL) (+0.90%) logged a decent gain.
Who cares if it smacks of flight to safety (and see our bonds, and see our currency – all explained in tonight's Wrap below), we'll take the gains any way we can! Forget Liberation Day, this was Liberation Week for the ASX!
To make sense of all the above, I have detailed technical analysis on the Nasdaq Composite, S&P/ASX 200, Australian Government Bonds and AUDUSD in today's ChartWatch.
Be sure to click/scroll through for the usual reporting of the major sector and stock-specific moves, the broker responses to them, as well as all the key upcoming economic data in tonight's Evening Wrap.
Let's dive in!
Today in Review
Thu 24 Apr 25, 4:56pm (AEST)
Name | Value | % Chg |
|---|---|---|
Major Indices | ||
| ASX 200 | 7,968.2 | +0.60% |
| All Ords | 8,175.1 | +0.61% |
| Small Ords | 2,996.0 | +1.04% |
| All Tech | 3,399.0 | +0.55% |
| Emerging Companies | 2,203.3 | +1.91% |
Currency | ||
| AUD/USD | 0.6366 | +0.11% |
US Futures | ||
| S&P 500 | 5,389.75 | -0.22% |
| Dow Jones | 39,614.0 | -0.40% |
| Nasdaq | 18,746.75 | -0.30% |
Name | Value | % Chg |
|---|---|---|
Sector | ||
| Health Care | 40,229.2 | +1.22% |
| Materials | 16,021.6 | +1.15% |
| Real Estate | 3,578.5 | +0.75% |
| Financials | 8,619.9 | +0.71% |
| Information Technology | 2,298.7 | +0.54% |
| Consumer Discretionary | 3,862.4 | +0.07% |
| Industrials | 7,807.9 | +0.04% |
| Utilities | 9,060.3 | +0.03% |
| Communication Services | 1,697.6 | -0.07% |
| Consumer Staples | 12,240.3 | -0.45% |
| Energy | 7,075.7 | -0.70% |
Markets
%20intraday%20chart%2024%20April%202025.png)
ASX 200 Session Chart
The S&P/ASX 200 (XJO) finished 47.7 points higher at 7,968.2, 0.60% from its session low and just 0.20% from its high. In the broader-based S&P/ASX 300 (XKO), advancers beat decliners by an emphatic 201 to 65. For the week, the XJO finished up 149.1 points or 1.9% higher, 2.9% from its intraweek low and just 0.2% from its intraweek high.
Settled down.
Is probably the best way to describe the Aussie stock market this week. It seems to have found a new sense of calm amidst the global trade war chaos.
And, looking at how our stocks, bonds, and even currency performed this week – arguably it has decided at least for now, to hitch its wagon to another horse.
The old horse being the gyrating US stock market, and the new horse being…China, Europe? I’m not sure, it’s probably just not the US anymore.

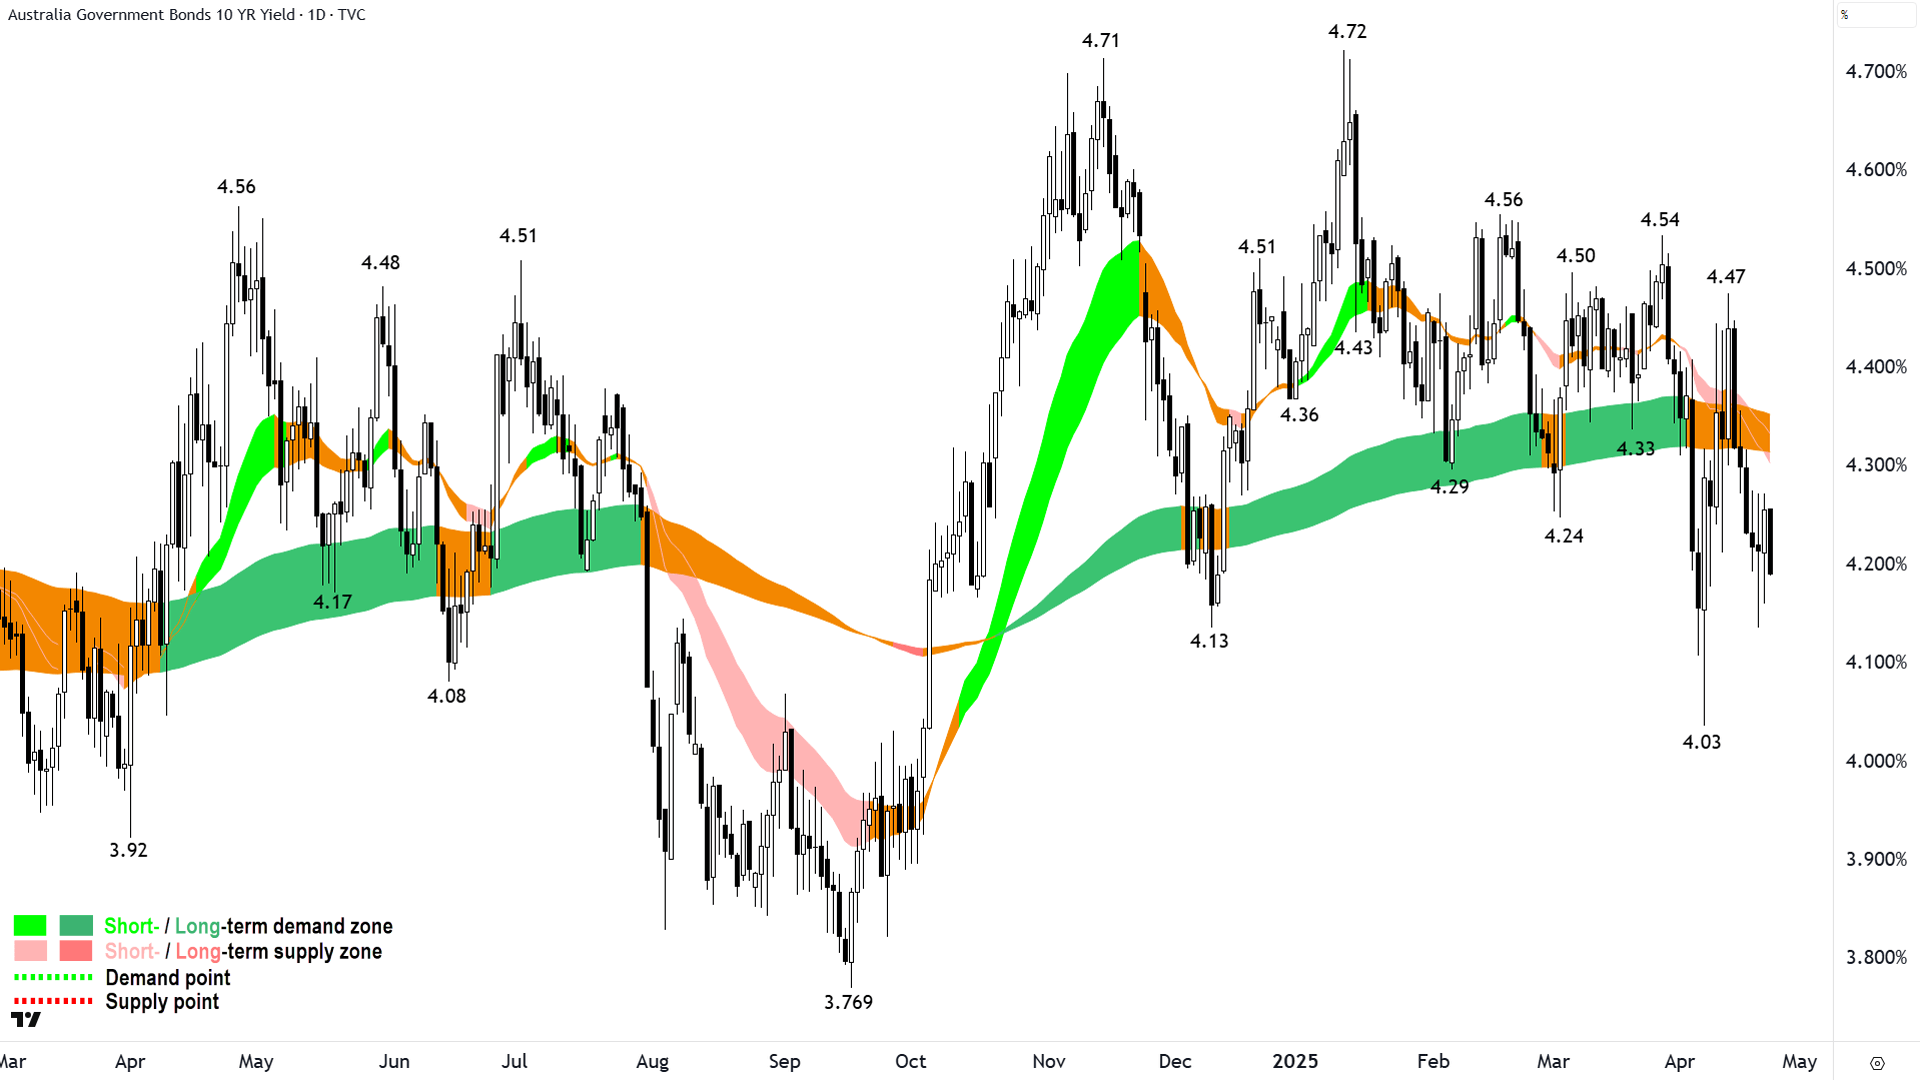
Australian 10-year Government Bond Yields (click here for full size image)
Aussie bond yields fell this week, compared to (at times this week) renewed danger levels achieved on the yields of US risk-frees. This indicates potentially some of the cash that was invested in US Treasuries has sought a safe-haven alternative here on our shores…International investors appear to trust Uncle Dale more than Uncle Sam (channelling Dale Kerrigan here – tell ‘em they’re dreaming!). As per the chart above.

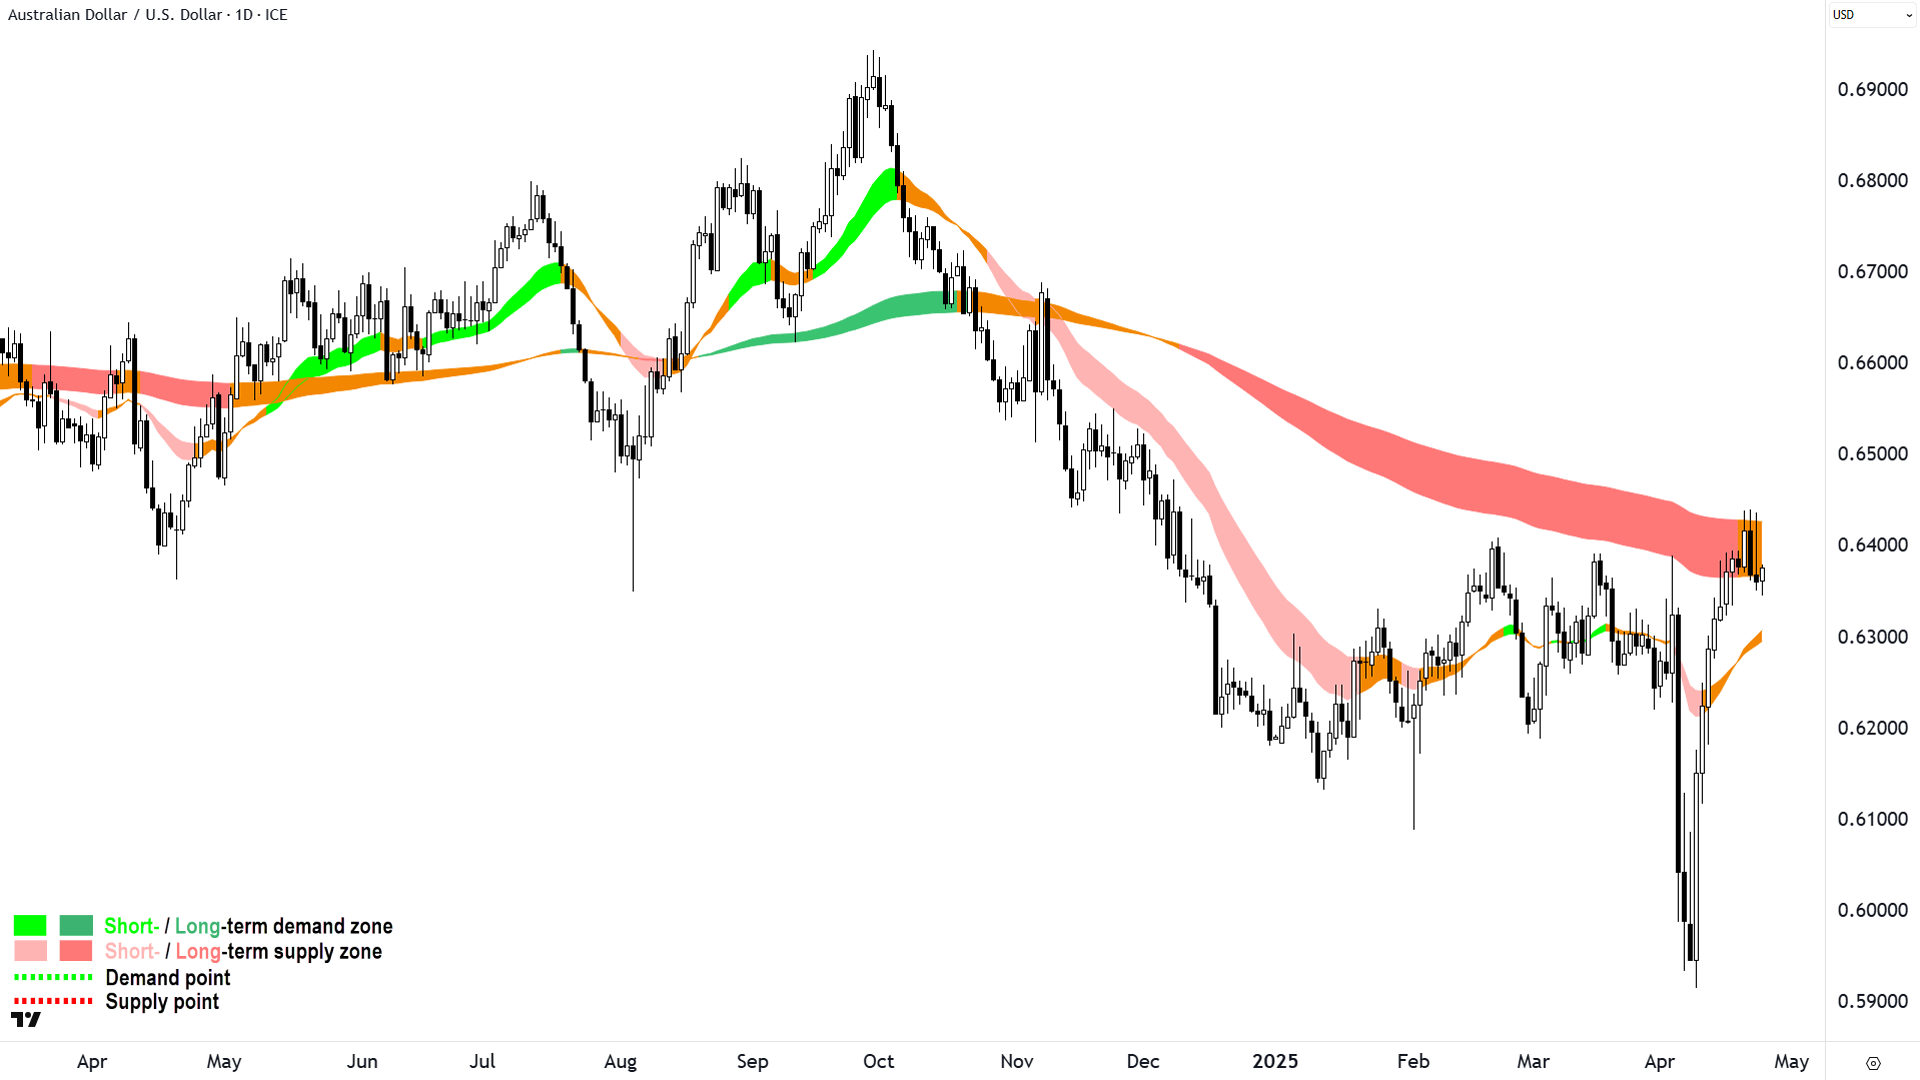
Australian dollar vs US dollar (AUDUSD) (click here for full size image)
If you’re a seller of US risk-frees (remember excess supply for US Treasuries will push prices down and yields up), and you’re a buyer of Aussie risk-frees (remember excess demand for Aussie Govt bonds will push prices up and yields down) – at some point you’re going to have to sell greenbacks and buy Aussie dollars. This means the AUDUSD is likely to rise. As per the chart above.
So here we are. Seemingly on a more stable footing than we were just a week ago – and certainly two weeks ago. Does that mean it’s safe to go back in the water? The charts seem to be pointing more and more that way – well specifically for the ASX that is. As per the charts in ChartWatch below 👇!
ChartWatch
NASDAQ Composite Index

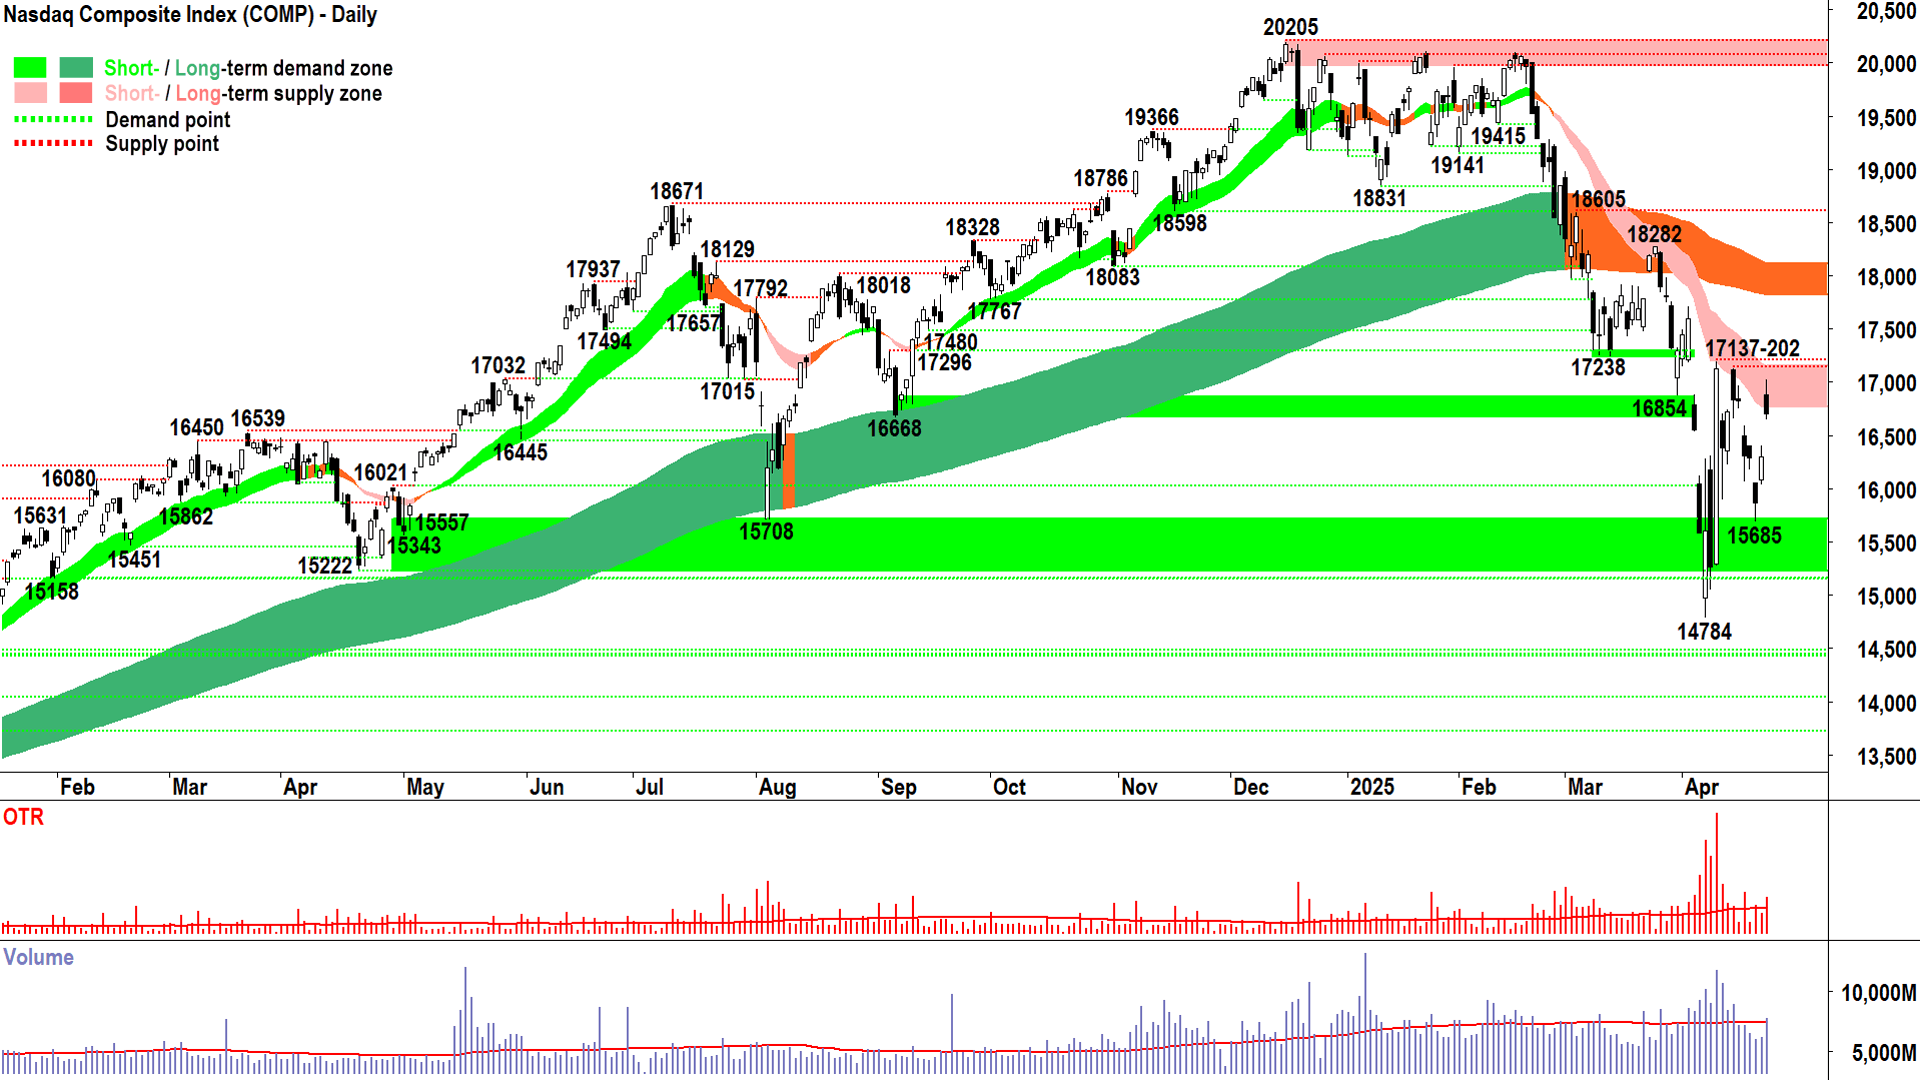
Get MOTN right, the rest will take care of itself! ⚖️ (click here for full size image)
If you believe in Santa Claus, the tooth fairy and the Easter Bunny, then you are also likely prone to believing that my short and long term trend ribbons have any predictive ability.
They don’t. They’re just squiggly lines on a chart.
But, as it turns out, they have an uncanny knack of somehow defining – more often than not (“MOTN”) – areas of what I call “dynamic demand” and “dynamic supply”.
“Dynamic” – because the trend ribbons naturally move with the price of the underlying security they are attached to.
“Demand” – or more specifically excess demand – i.e., where the price tends to rebound from (MOTN) in an uptrend.
“Supply” – or more specifically excess supply – i.e., where the price tends to be repelled from (MOTN) in a downtrend.
MOTN. Not always. Not every time. Not 100%.
But MOTN is the most powerful concept in investing.
It’s far more powerful than 100%. Because 100% is an illusion. It’s unobtainable. It’s an impossibility that not even the greatest investors of all time…yes, even Warren Buffet, can aspire to!
Don’t kid yourself that you’re going to operate at anywhere near 100% in this game.
Accept MOTN. Embrace it. Wrap yourself in it and snuggle up to it as you fall asleep each night.
That’s right! Understanding the math of MOTN and knowing it’s on your side, facilitates an extremely powerful investing mindset.
For example, consider a trading system that operated at a MOTN rate of 55% wins.
(Hahaha that sucks Carl, Buffett’s is way higher than that!).
Now consider for every dollar risked, when this system gets it right, it wins an average of $0.50 and when it gets it wrong it loses an average of $0.25 – because, say for example, we’d adopted some crazy scheme of letting our profits run and cutting our losses short!
Now, using this model, over 100 trades you’d be (55 x +$0.50) – (45 x -$0.25) = $27.50 - $11.25 = $16.25 ahead.
You risked $100 over 100 trades and came out $16.25, or 16.25% in front.
Who gives a stuff if your MOTN win rate was only 55%? And who gives a stuff about that 43rd trade that tanked as soon as you got in – or that 58th trade that rocketed as soon as you dutifully cut your loss?
No individual trade matters anymore.
All that matters is the math of MOTN trading. Get this right, and the rest will take care of itself.
I better do some analysis on the Comp chart or you’ll all get distracted by funny cat videos on TikTok, like this one:
(What happened in markets after President Trump’s April 2 Liberation Day “reciprocal” tariffs were announced!)
As noted in yesterday’s Wrap, a higher open was on the cards for the Comp – but also as noted yesterday – the close turned out to be far more important than the open.
Despite the headlines showing another strong, follow-up gain to Tuesday, Wednesday’s candle is less than ideal for the demand-side. It smacks of sell the rally, and at a point we’d typically associate with latent excess supply – the short term downtrend ribbon.
So, as great as it is the Comp is trying to solidify the potential bear market low of 14784, by logging and now holding well-enough a higher trough at 15685 – it has not yet dispensed with the nagging sell the rally supply that lingers at higher prices and into liquidity events such as yesterday’s higher open.
In many ways, the easier part of the rally is dispensed with. Buying the dip lower down probably felt safe enough for value-based fundies and those looking for a quick turn in an oversold market. But buying up here is a very different proposition. With those easy gains now gone, you’d have to be pretty confident in where the market is headed from here.
This notion also suggests that if the Comp can continue this rally, it deserves due credit. Particularly if the rise can close us back above 17137 – with some emphatic demand-side candles (not last night’s indifferent showing) – then I’d take it very, very seriously.
Until then, I remain of the mindset this is all a bunch of meaningless gyration within an equilibrium market, and therefore I am still happy to observe – hands firmly wedged under buttocks!
On the other hand, a solid supply-side candle that confirms last night's supply-sided inklings – would be particularly telling. It would likely steel the excess supply sampled in the short term downtrend ribbon and set the Comp up for a retest of at least 15685.
S&P/ASX 200 (XJO)
%20chart%2024%20April%202025.png)
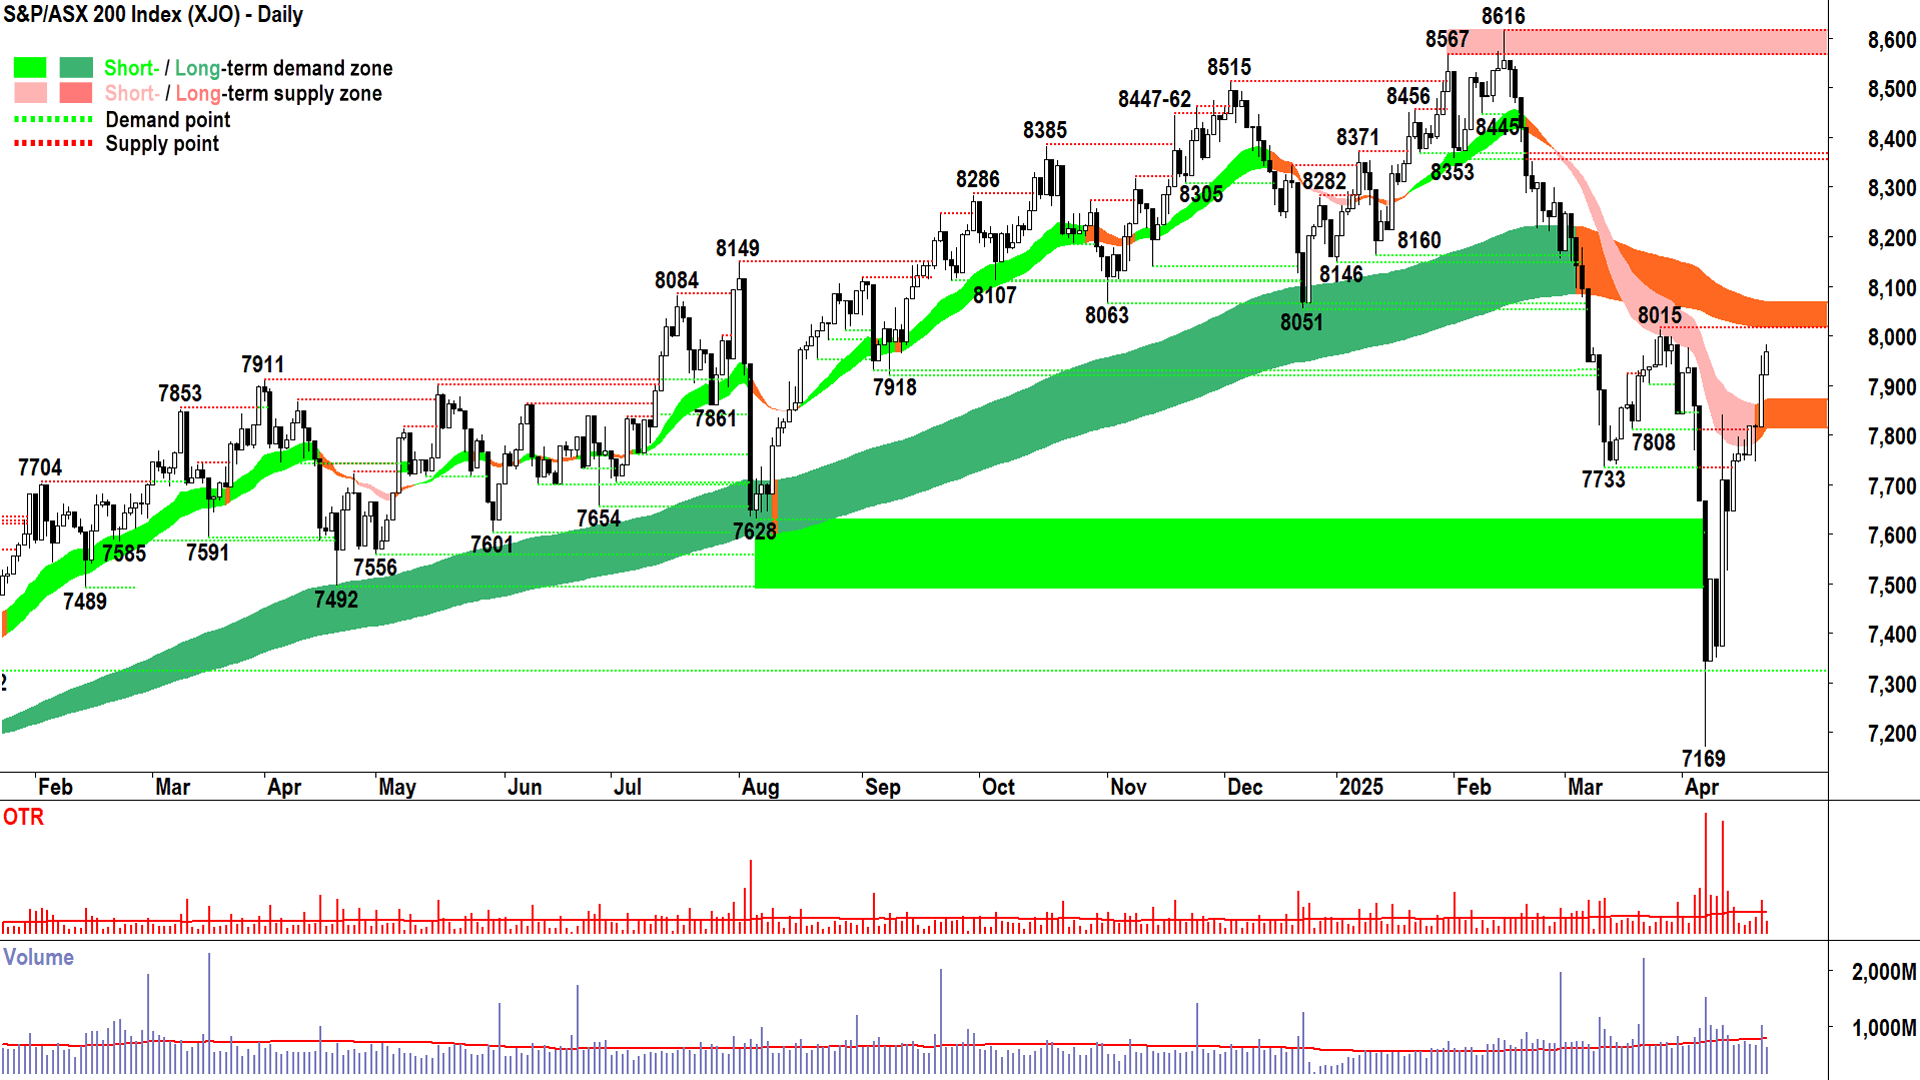
far more indicative of a return to demand-side control (click here for full size image)
It’s important to understand that the Comp analysis is separate from the XJO analysis.
Horses for courses. For example, the Comp’s chart could dictate your allowable capital allocation for the portion of funds you have devoted to investing in US stocks.
At the same time, operating independently, the XJO is doing the same for your ASX allocated funds.
If this was the case, then you’d be more inclined to increase risk exposure here than there. As in, personally, for the Comp I still prefer the most conservative risk setting (for me this is max 1/3 allowable capital invested with any long-side allocation balanced by short exposure).
The price action and candles here are far more indicative of a return to demand-side control:
The bounce from the corresponding 7169 major trough is steeper and far more V-shaped. It doesn’t have a higher trough – because the excess supply did not exist in the system push down to cause one – think about that for a second.
There are a greater number and magnitude of demand-side candles (i.e., white-bodied and or with downward pointing shadows).
The close above the short term trend ribbon is more emphatic and the short term trend ribbon has neutralised.
We’re closing in on the long term trend ribbon.
So, for here, I’d be more inclined to use all one-third of my maximum risk allocation allowed and be less inclined to use the full allocation of shorts to balance them out.
But that’s just me. And it’s an indication of how conservative I remain. The goal of a trend follower is not to pick the bottom, it’s to avoid downside volatility. If I can get back to fully invested at roughly the same point I moved to maximum cash – but have avoided all the downside volatility in the meantime – then I reckon I would have done a ripper job.
Harping back to the “aspiring to 100% accuracy is stupid” argument above…trend followers know that trying to pick the exact top and exact bottom is a waste of valuable time and brain power, and it will tie your stomach up in knots!
Looking back to the XJO chart – there’s some credible price action and candles here. I’d like to see it stay that way and for the short term trend ribbon to be confirmed as a new zone of dynamic demand. That would set us up nicely for tackling the long term uptrend ribbon – which once accomplished – would set me up for a move to a higher capital allocation.
Economy
Today
There weren't any major data releases in our time zone today
Thursday
20:30 USA Core Durable Goods Orders March (+0.3% m/m forecast vs +0.7% m/m in February)
22:00 USA Existing Home Sales March (4.14 million forecast vs 4.26 million in February)
Friday
All day AUS ANZAC Day Public Holiday
Latest News
Interesting Movers
Trading higher
+15.4% Koonenberry Gold (KNB) – No news since 23-Apr Multiple zones of visible gold in fifth drill hole at Enmore, bounced in the wake of the recent sharp selloff, a regular in ChartWatch ASX Scans Uptrends list 🔎📈
+13.3% Lotus Resources (LOT) – Continued positive response to 23-Apr Change in substantial holding, general strength across the broader Uranium sector today (after Sprott Inc. buying spree in several ASX uranium stocks came to light yesterday).
+12.1% Paladin Energy (PDN) – Continued positive response to 23-Apr Change in substantial holding, general strength across the broader Uranium sector today (after Sprott Inc. buying spree in several ASX uranium stocks came to light yesterday), also several broker notes today, generally positive – see Broker Moves for details.
+10.1% Clarity Pharmaceuticals (CU6) – No news, bounced in the wake of the recent sharp selloff.
+9.6% Deep Yellow (DYL) – Continued positive response to 23-Apr Change in substantial holding, general strength across the broader Uranium sector today (after Sprott Inc. buying spree in several ASX uranium stocks came to light yesterday).
+8.5% Resmed Inc (RMD) – Resmed Announces Results for the Third Quarter of FY2025.
+8.4% Boss Energy (BOE) – Continued positive response to 23-Apr Change in substantial holding, general strength across the broader Uranium sector today (after Sprott Inc. buying spree in several ASX uranium stocks came to light yesterday).
+7.0% Pantoro (PNR) – No news, general strength across the broader Gold sector today, rise is consistent with prevailing short and long term uptrends, a regular in ChartWatch ASX Scans Uptrends list 🔎📈
+7.0% Capstone Copper Corp. (CSC) – No news, general strength across the broader Copper sector today, (copper price rallied strongly earlier in the week).
+6.7% Bannerman Energy (BMN) – Continued positive response to 23-Apr Change in substantial holding, general strength across the broader Uranium sector today (after Sprott Inc. buying spree in several ASX uranium stocks came to light yesterday).
+6.3% Fleetwood (FWD) – No news, rise is consistent with prevailing short and long term uptrends, a regular in ChartWatch ASX Scans Uptrends list 🔎📈
+6.3% WA1 Resources (WA1) – No news, general strength across the broader Critical Minerals sector today.
+5.9% Mineral Resources (MIN) – No news, general strength across the broader Lithium sector today.
+5.9% Southern Cross Gold (SX2) – SX2 Drills 28.6m @ 10.3 g/t Gold at Sunday Creek, general strength across the broader Gold sector today, rise is consistent with prevailing short and long term uptrends, a regular in ChartWatch ASX Scans Uptrends list 🔎📈
Trading lower
-14.8% Generation Development Group (GDG) – March quarter update.
-5.7% PWR Holdings (PWH) – PWR Founder and Managing Director Takes Medical Leave, fall is consistent with prevailing short and long term downtrends, a regular in ChartWatch ASX Scans Downtrends list 🔎📉
-4.3% Coronado Global Resources (CRN) – No news, general weakness across the broader Energy sector today, fall is consistent with prevailing short and long term downtrends, one of the most Featured (highest conviction) stocks in ChartWatch ASX Scans Downtrends list 🔎📉
-4.0% Cettire (CTT) – Continued negative response to 23-Apr Q3 FY25 Trading & Market Update and today's Change in substantial holding (likely some increased short seller activity here), fall is consistent with prevailing short and long term downtrends, one of the most Featured (highest conviction) stocks in ChartWatch ASX Scans Downtrends list 🔎📉
-2.0% Woodside Energy Group (WDS) – No news since 23-Apr First Quarter 2025 Report, several broker updates today – see Broker Moves for more details, fall is consistent with prevailing short and long term downtrends, a regular in ChartWatch ASX Scans Downtrends list 🔎📉
Broker Moves
Aristocrat Leisure (ALL)
Upgraded to buy from neutral at UBS; Price Target: $74.50 from $75.50
Atlas Arteria (ALX)
Retained at buy at Citi; Price Target: $5.70
Retained at equal-weight at Morgan Stanley; Price Target: $5.28
Retained at hold at Morgans; Price Target: $5.09 from $4.60
Aurelia Metals (AMI)
Retained at outperform at Macquarie; Price Target: $0.320 from $0.310
Retained at buy at Ord Minnett; Price Target: $0.410 from $0.380
AMP (AMP)
Upgraded to outperform from neutral at Macquarie; Price Target: $1.340 from $1.640
Cobram Estate Olives (CBO)
Retained at hold at Bell Potter; Price Target: $1.950
Capricorn Metals (CMM)
Retained at hold at Bell Potter; Price Target: $8.77 from $8.61
Cettire (CTT)
Downgraded to speculative buy from positive at E&P; Price Target: $1.870 from $3.27
Caravel Minerals (CVV)
Retained at buy at Canaccord Genuity; Price Target: $0.600
Cygnus Metals (CY5)
Retained at buy at Shaw and Partners; Price Target: $0.250
Droneshield (DRO)
Retained at buy at Bell Potter; Price Target: $1.500 from $1.300
Genesis Minerals (GMD)
Retained at neutral at Citi; Price Target: $4.00 from $3.90
Insignia Financial (IFL)
Retained at hold at CLSA; Price Target: $3.90 from $4.50
Retained at neutral at JP Morgan; Price Target: $4.10 from $4.25
Retained at hold at Ord Minnett; Price Target: $5.00
Retained at neutral at UBS; Price Target: $4.00
Iluka Resources (ILU)
Retained at neutral at Citi; Price Target: $4.40
Retained at outperform at Macquarie; Price Target: $6.50
Imricor Medical Systems (IMR)
Retained at buy at Morgans; Price Target: $2.28
Latitude Group (LFS)
Retained at equal-weight at Morgan Stanley; Price Target: $1.300
Light & Wonder (LNW)
Retained at buy at UBS; Price Target: $196.00 from $198.00
Lynas Rare Earths (LYC)
Retained at outperform at Macquarie; Price Target: $7.30
Mader Group (MAD)
Upgraded to buy from hold at Bell Potter; Price Target: $6.70 from $6.50
Meteoric Resources (MEI)
Retained at negative at Macquarie; Price Target: $0.360
Monadelphous Group (MND)
Initiated at sector perform at RBC Capital Markets; Price Target: $15.75
Predictive Discovery (PDI)
Retained at buy at Canaccord Genuity; Price Target: $0.560
Retained at buy at Euroz Hartleys; Price Target: $0.550
Retained at buy at SCP Equity Research; Price Target: $0.800
Paladin Energy (PDN)
Retained at buy at Canaccord Genuity; Price Target: $12.80 from $13.35
Retained at buy at Citi; Price Target: $10.20
Retained at hold at Jefferies; Price Target: $5.50 from $5.00
Retained at overweight at JP Morgan; Price Target: $5.90
Retained at outperform at Macquarie; Price Target: $8.45 from $8.25
Retained at overweight at Morgan Stanley; Price Target: $5.00
Retained at buy at Ord Minnett; Price Target: $9.50 from $9.00
Retained at sector perform at RBC Capital Markets; Price Target: $5.75 from $5.50
Retained at buy at UBS; Price Target: $9.10
Proteomics International Laboratories (PIQ)
Retained at hold at Morgans; Price Target: $0.430 from $0.500
QBE Insurance Group (QBE)
Retained at buy at Goldman Sachs; Price Target: $25.00
Resmed Inc (RMD)
Upgraded to overweight from market-weight at Wilsons; Price Target: $43.50 from $42.82
South32 (S32)
Upgraded to hold from sell at Canaccord Genuity; Price Target: $2.60
Superloop (SLC)
Retained at buy at Citi; Price Target: $2.65
Telix Pharmaceuticals (TLX)
Retained at buy at Bell Potter; Price Target: $36.00
Retained at outperform at CLSA; Price Target: $33.25
Retained at buy at Jefferies; Price Target: $35.30 from $33.00
Retained at buy at UBS; Price Target: $36.00
Retained at overweight at Wilsons; Price Target: $35.00
Woodside Energy Group (WDS)
Retained at neutral at Citi; Price Target: $21.50
Retained at neutral at Goldman Sachs; Price Target: $24.20 from $23.90
Retained at overweight at Jarden; Price Target: $23.85 from $23.75
Retained at overweight at JP Morgan; Price Target: $26.80 from $27.50
Retained at negative at Macquarie; Price Target: $24.00
Retained at equal-weight at Morgan Stanley; Price Target: $27.00
Retained at neutral at UBS; Price Target: $23.20 from $23.50
Scans
Top Gainers
Code | Company | Last | % Chg |
|---|---|---|---|
| AVR | Anteris Technologies Global Corp | $7.50 | +33.45% |
| BGE | Bridge Saas Ltd | $0.023 | +27.78% |
| TNC | True North Copper Ltd | $0.24 | +23.08% |
| SRK | Strike Resources Ltd | $0.039 | +21.88% |
| NVO | Novo Resources Corp | $0.12 | +20.00% |
Top Fallers
Code | Company | Last | % Chg |
|---|---|---|---|
| SVY | Stavely Minerals Ltd | $0.012 | -20.00% |
| CMG | Critical Minerals Group Ltd | $0.11 | -18.52% |
| GT1 | Green Technology Metals Ltd | $0.032 | -15.79% |
| OLY | Olympio Metals Ltd | $0.045 | -15.09% |
| SCN | Scorpion Minerals Ltd | $0.017 | -15.00% |
52 Week Highs
Code | Company | Last | % Chg |
|---|---|---|---|
| ERM | Emmerson Resources Ltd | $0.15 | +7.14% |
| PNR | Pantoro Gold Ltd | $3.05 | +7.02% |
| FWD | Fleetwood Ltd | $2.69 | +6.32% |
| AQN | Aquirian Ltd | $0.35 | +6.06% |
| NMG | New Murchison Gold Ltd | $0.018 | +5.88% |
52 Week Lows
Code | Company | Last | % Chg |
|---|---|---|---|
| SVY | Stavely Minerals Ltd | $0.012 | -20.00% |
| CMG | Critical Minerals Group Ltd | $0.11 | -18.52% |
| GT1 | Green Technology Metals Ltd | $0.032 | -15.79% |
| OLH | Oldfields Holdings Ltd | $0.04 | -13.04% |
| HIO | Hawsons Iron Ltd | $0.012 | -7.69% |
Near Highs
Code | Company | Last | % Chg |
|---|---|---|---|
| BILL | Ishares Core Cash ETF | $100.69 | +0.01% |
| GLDN | Ishares Physical Gold ETF | $41.68 | +1.21% |
| NHF | Nib Holdings Ltd | $6.91 | +0.44% |
| MTO | Motorcycle Holdings Ltd | $2.15 | +2.87% |
| GXLD | Global X Gold Bullion ETF | $52.33 | +1.43% |
Relative Strength Index (RSI) Oversold
Code | Company | Last | % Chg |
|---|---|---|---|
| WAA | Wam Active Ltd | $0.775 | 0.00% |
| NWSLV | News Corporation | $41.80 | 0.00% |
| CRN | Coronado Global Resources Inc | $0.225 | -4.26% |
| HMC | HMC Capital Ltd | $4.67 | +1.52% |
| CTT | Cettire Ltd | $0.475 | -4.04% |
