The ASX Market Filter
How to Apply a Basic Market Filter to the S&P/ASX 200 to Reduce Portfolio Risk and Limit Losses.
Important Note
The ASX Filter should not be used as a trading system on individual stocks to generate buy and sell signals. Moving averages are a lagging indicator and simply provide a way to determine the underlying longterm trend of the market and identify periods of higher risk.
Investors are exposed to an element of risk (uncertainty) with every type of investment, whether it’s purchasing Government Bonds, real estate or a micro-cap stock. Depending on the investor’s goal and risk tolerance, various strategies can be implemented to keep portfolio volatility within an acceptable range.
The most common form of risk control is diversification.
Diversification involves investing across multiple asset classes (e.g. property, bonds, equities etc.) because it’s presumed that not all asset classes will react in the same way to a major event or catastrophe. If one asset provides poor returns, the other unrelated assets will hopefully counteract the negative impact.
The problem is that diversification can be a terrible form of risk management for the average share market investor. While it works well to reduce risk in a portfolio containing multiple asset classes, it’s not effective on a portfolio containing just shares.
Many ASX investors believe that by “diversifying” their share portfolio between 8, 10 or even 15 different companies they are reducing their “risk”, but this really isn’t accurate.
"Wide diversification only guarantees ordinary results."
- Charlie Munger
Buying multiple ASX listed companies is a great way to prevent one “bad apple” from causing a game-ending loss (although it also prevents one great stock from significantly increasing your portfolio’s return), but what happens if the whole stock market falls? The answer is simple; your portfolio’s value will also fall.
Only Buy Shares when the Market is Rising
Successful investors know when to place their money in the market and when it’s best to sit on the sidelines in cash. For novice investors, however, it's difficult to establish exactly when market conditions are considered “favourable”.
For simplicity, we presume that favourable market conditions are when the market is trending up.
Why? Due to the positive correlation between the major indices and the stocks that constitute them, a bullish or bearish move in an index will likely see a similar movement in your portfolio. To reduce exposure to a poorly performing market (thus limiting your risk and potential for capital loss), it's logical to only buy shares when the benchmark index is trending up.
So how can you determine when the market is trending up?
ASX Market Filter: Put the Odds in your Favour
To determine the trend of the ASX, a Market Filter (or Index Filter) can be applied to a major index to unambiguously tell you what you should be doing with your money. Should you be looking for buying opportunities or keeping your money in the bank?
NOTE
There is no “buy” and “sell” signal as such. A filter simply tells us whether
market conditions are favourable (i.e. we can buy shares) or not (i.e. do not buy more shares).
There's an unlimited selection of index filters that can be applied, ranging from the absurd (Gann Fans) to the logical (30, 50 or 200 period moving average).
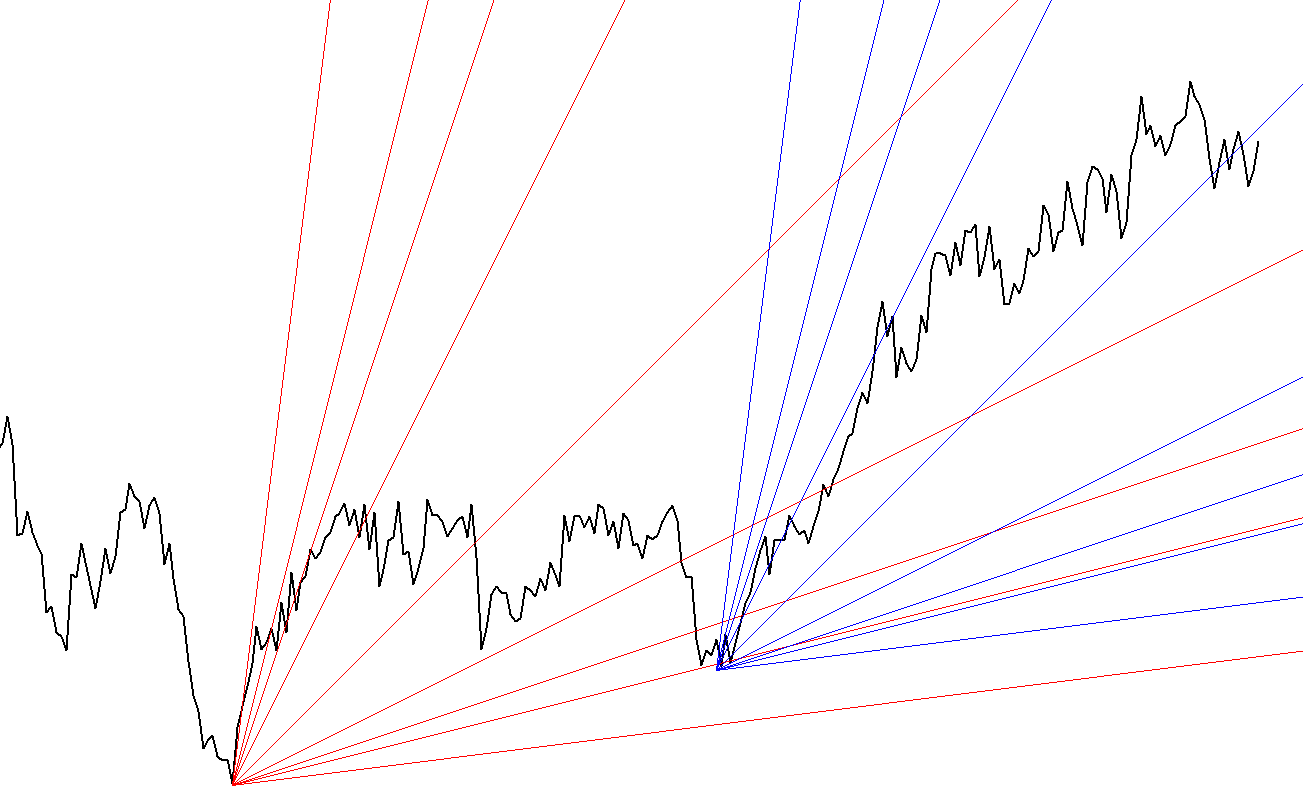
“Gann analysis – the precise guide to nowhere”
Which Index should you use?
Investors should use the index that best represents the holdings of their portfolio.
For example, if you only invest in high yield blue chips, you might select the S&P/ASX 50 as your portfolio’s benchmark.
If you only invest in gold stocks, you might choose the S&P/ASX All Ordinaries Gold Index.
As a general rule, most Australian investors and financial institutions rely on either the S&P/ASX 200 (“ASX 200”) or the All Ordinaries (“All Ords”). Both are highly correlated so it doesn’t really matter which you choose, just keep in mind that the All Ords contains 300 smaller-cap companies not present in the ASX 200, so it can be affected by strong movements in the small to mid-cap sector.
The Golden Cross
Market Index's filter of choice is the “Golden Cross” and it features on our homepage.
Although not reliable as a stand alone trading system on stocks (due to its delay in producing signals), moving averages are widely used to establish underlying trend.
Signals are derived from a crossover of the 9 and 21 period Exponential Moving Average (EMA) when applied to a weekly chart of the ASX 200.
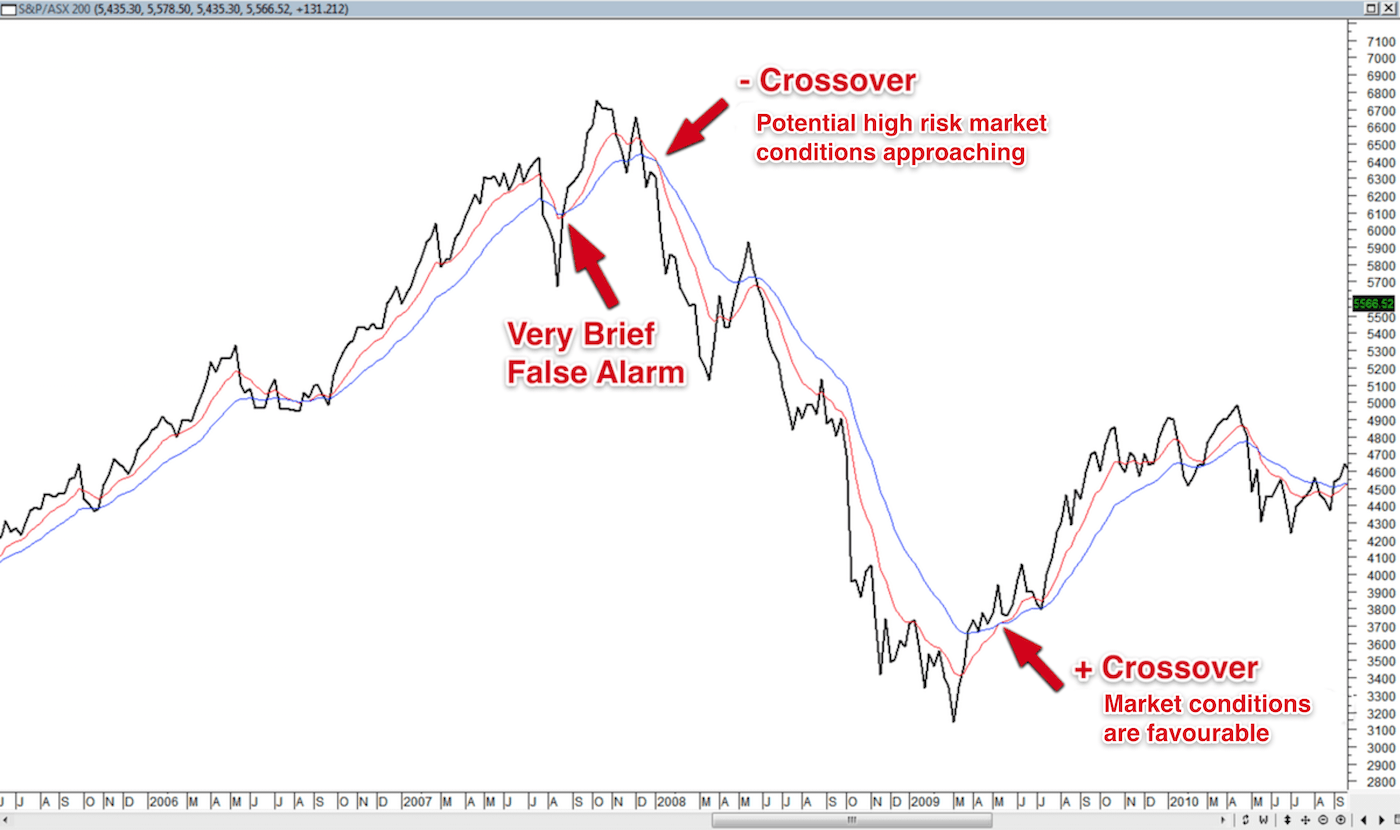
Golden Cross Filter (click to enlarge)
When can we buy?
We look for buying opportunities when the 9 period EMA (red) is ABOVE the 21
period EMA (blue) on the ASX 200.
When should we avoid buying additional shares?
We stop buying shares and closely monitor our
stop-losses when the 9 period EMA (red) is BELOW the 21 period EMA (blue) on the ASX 200.
Investors with foreign exposure or a higher risk tolerance may look for a retreat on both the ASX 200 and the American S&P 500 to warn of unsavoury market conditions.
The crossover strategy is based on moving averages and technical analysts consider it a “lagging” indicator. The disadvantage of a lagging indicator is that in sideways and choppy markets it has a tendency to “whipsaw” and give us conflicting signals. During these times the market is probably not ideal for investment anyway, but more suitable for a shorter-term trading strategy. Nevertheless, it does ensure that when the market begins to trend up we can jump on the ride relatively early and stay invested until there is evidence the trend has weakened or reversed.
Trying to pick exact turning points in the market to get 100% of the trend is a fruitless exercise. One should simply aim to capture a majority of the trend and ride it until given evidence to the contrary. Many succumb to the temptation of over-optimising and trying to “out smart” the market by picking the market tops and bottoms. The end result is a system that works perfectly in hindsight, but poorly in real-time. The less optimised your filter, the better it will perform in the future.
Why did we choose the numbers 9 & 21? They were arbitrary selections (and our favourite combination) that just so happen to perform extremely well on the Australian market. Other popular moving average parameters include the 30 week (made popular by Stan Weinstein), the 50 day and the 200 day moving average (used widely in the finance industry).
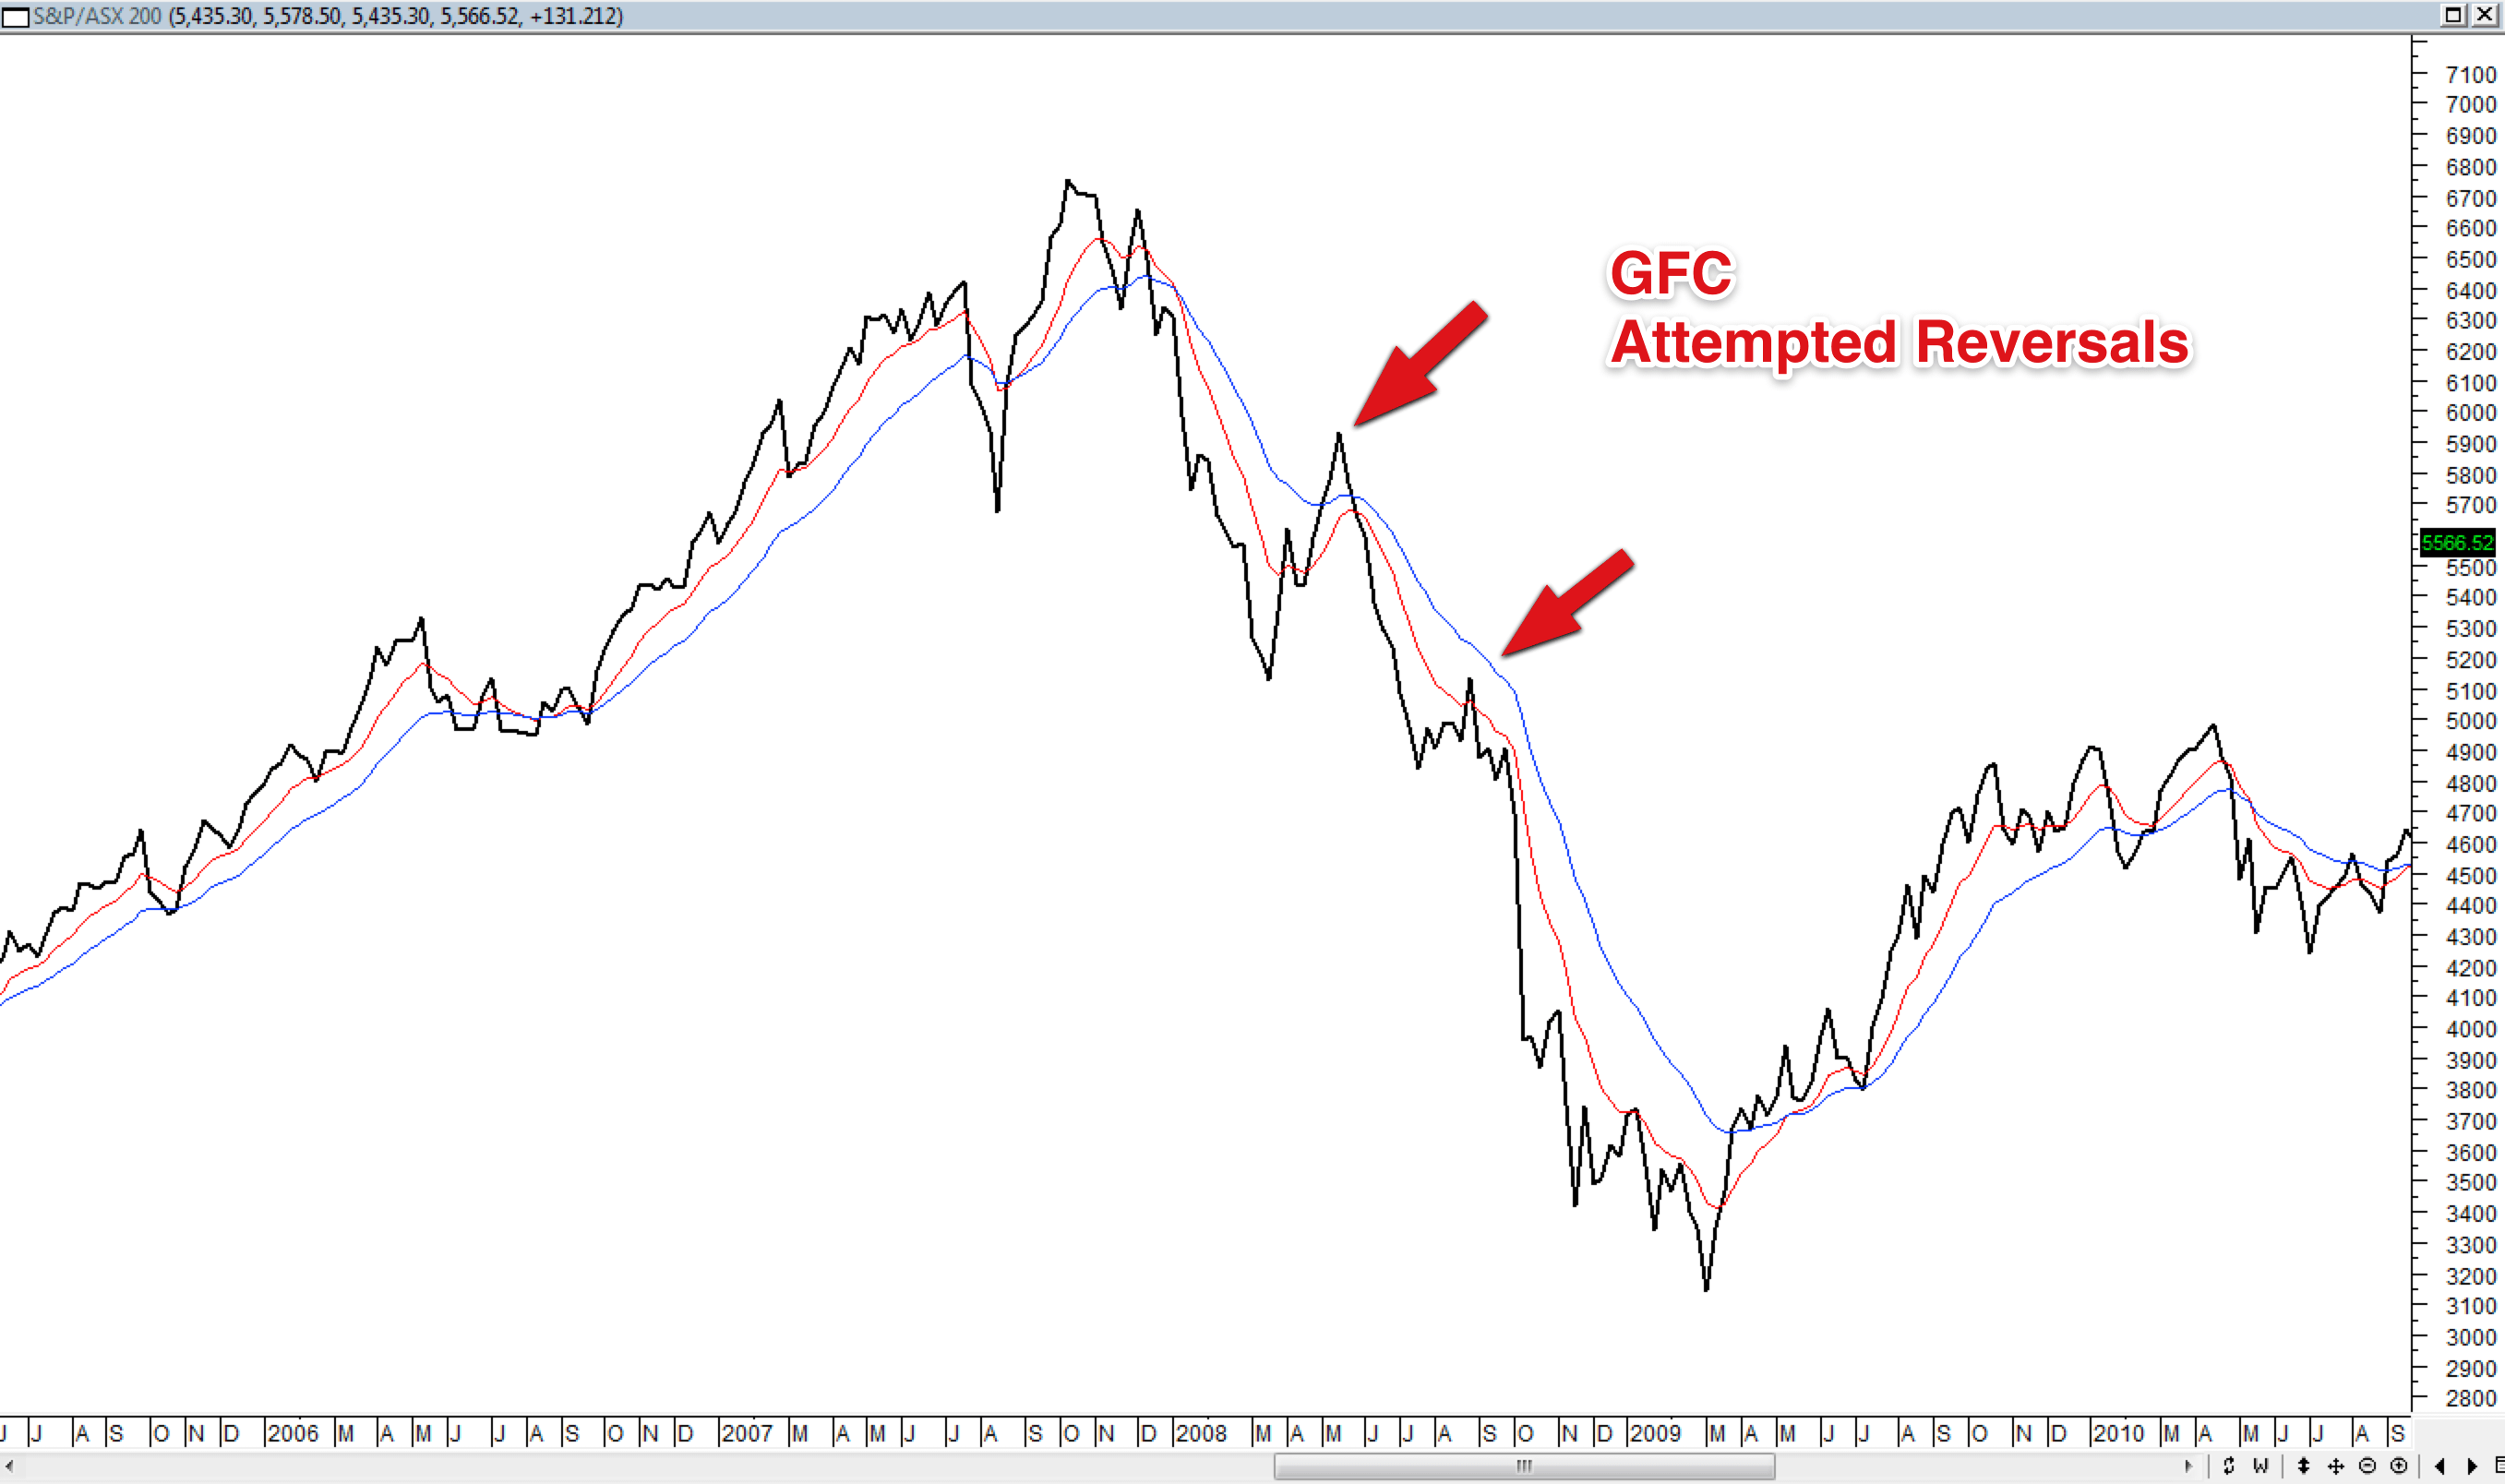
2008/09 Crash (click to enlarge)
Notice how the market attempted several unsuccessful reversals in 2008 but the moving average crossovers kept us out for the majority of the downtrend. This limited our downside risk as the filter was clearly indicating that we should keep our money in the bank or move funds into investments where the returns looked more promising. Coincidently, during this time you would have heard many people crying out how “the market couldn’t get any worse” and that “there’s only one way for the market to go from here!”.
"Trying to time the market bottom is like trying to catch a falling knife."
- Stockbroker Phrase
The chart below shows a similar thing happening during the Tech Crash.

2002/03 Tech Crash (click to enlarge)
The current bull run that commenced in June 2012 has seen the ASX 200 advance 39% from 4,000 to 5,550 (August 2014). The moving average crossovers have served their purpose by alerting us to these positive market conditions and indicating we remain invested during the majority of the rally. Only briefly (4 weeks in June 2014) were we made to sit on the sidelines.
How has the ASX Filter Performed?
Since 1992 the ASX Filter has performed exceptionally well.
| ASX Filter | Buy & Hold | |
| Profit/Risk Ratio | 17.9 to 1 | 5.5 to 1 |
| Total Profit | 149.5% | 294.0% |
| Maximum Risk | 8.4% | 53.4% |
The Buy & Hold (294.0%) strategy has outperformed the ASX Filter (149.5%) almost twofold in Total Profit since 1992. It would be easy to presume the Buy & Hold is therefore the superior system, but total return is only a small piece of the puzzle. The Profit/Risk Ratio is a far better indicator of a trading system's robustness.
The Profit/Risk Ratio indicates the average profit on a winning trade divided by the average loss on a losing trade. So a 17:1 ratio of the ASX Filter indicates that (in theory and on average) you can expect the average win to be 17 times larger than the average loss.
The benefit of a high Profit/Risk Ratio is best explained by looking at the following two charts. They both display the ASX 200 from 1992 - 2014 along with the equity curve for each system underneath. The green histogram depicts the portfolio's profit, while the red histogram depicts the portfolio's drawdown (loss in portfolio value).

Buy & Hold Strategy (click to enlarge)
A Buy & Hold strategy has no mechanism in place to limit losses, so during the crisis of 2008/09 your portfolio would have fallen 53.4%. There are two obvious problems here:
1. A loss of 53.4% is difficult to handle psychologically
2. Timing becomes crucial to profitability (those who invested six years ago would still be underwater, ex. dividends)

ASX Filter (click to enlarge)
The ASX Filter on the other hand has prevented investment during broad share market declines. The green arrows indicate when the filter turned "on" and the red stamps indicate when the filter turned "off". Note how major market corrections only experienced a small loss in capital before the system turned off. The largest drawdown was during the 2002/03 Tech Crash and limited to just 8.4%, a level that can be tolerated by all but the most conservative investors.
On the balance of probabilities, if the market is in a longterm downtrend and the crossovers are signaling us to stand aside and monitor our stop-losses, that's what we should do. Be patient and wait for a positive moving average crossover to occur before adding additional capital to the share market.
What are the Crossovers Saying Today?
Market Index conducts a scan every Saturday on the S&P/ASX 200 using weekly data / charts.
If the 9 period EMA is above the 21 period EMA then on the homepage you will see:
If the 9 period EMA is below the 21 period EMA then you will see:

The strategy is a guide only and definitely not fool proof. Use common sense and remember the old adage “If in doubt, stay out!”.
Additional Reading
Investopedia - Summary of moving averages in
simple terms
Stock
Charts - A more detailed explanation of moving averages