Australian Mineral Resources
Statistics on this page are from Geoscience Australia.
Economic Demonstrated Resources (EDR)
As defined by the Australian Bureau of Statistics (ABS): "EDR is a measure of the resources that are established, analytically demonstrated or assumed with reasonable certainty to be profitable for extraction or production under defined investment assumptions. Classifying a mineral resource as EDR reflects a high degree of certainty as to the size and quality of the resource and its economic viability."
Australian Operating Mines Map (PDF)
A large 19MB file with significant detail that outlines all operating mines in Australia as at 2021. You will need to zoom in with your browser or Adobe Reader.
Note: The PDF below is very large. It will take a while to download.
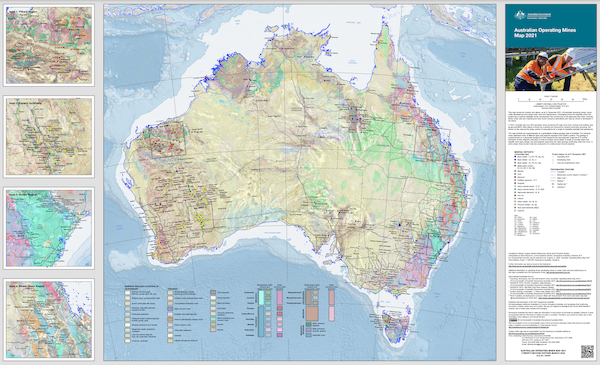
Click for a large 19MB hi-def PDF.
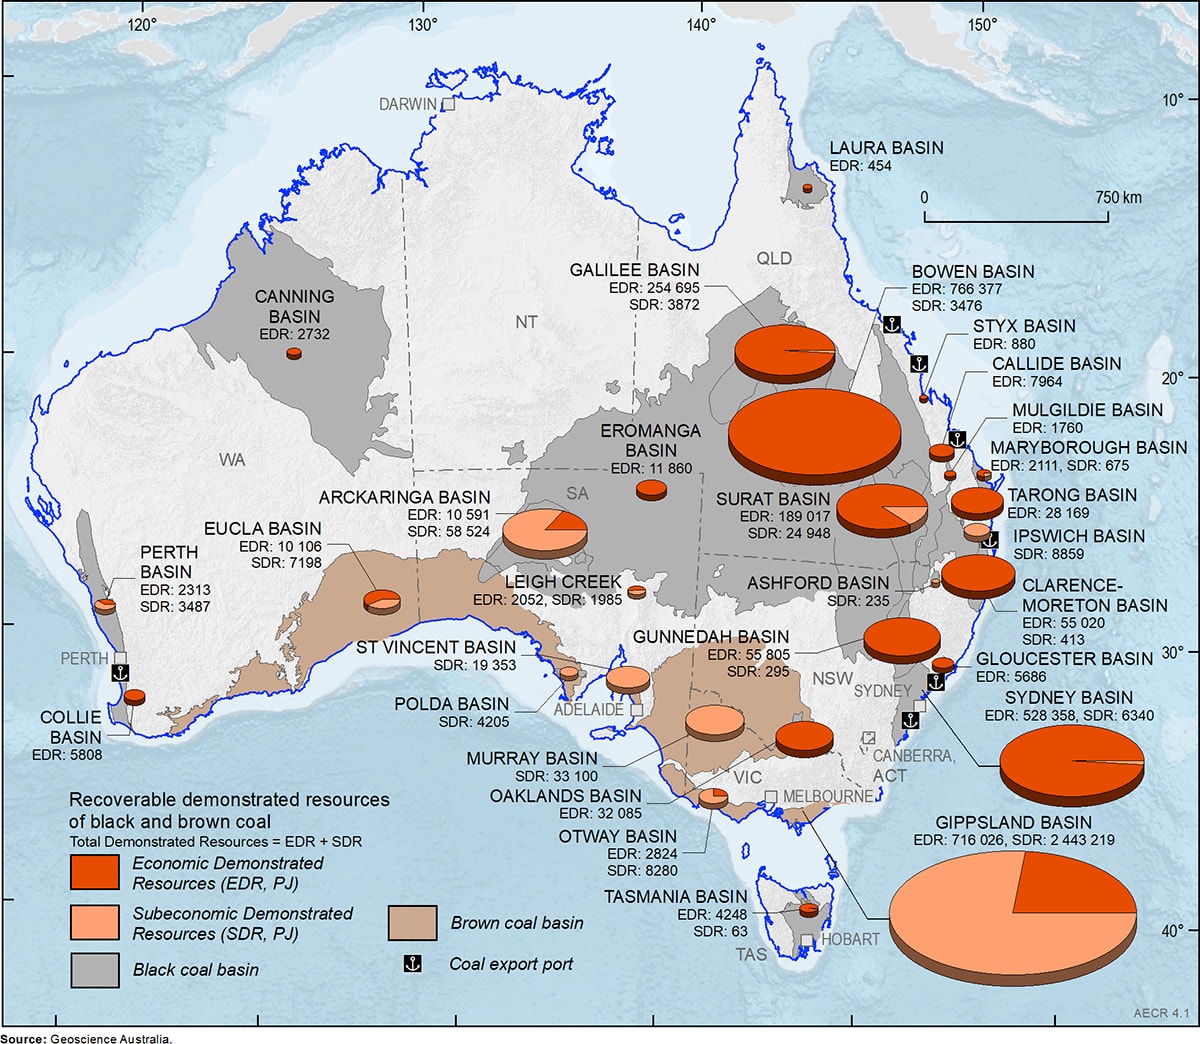
Coal
Australia is estimated to have 14% of the world's coal reserves (black and brown) and ranked third in the world behind the United States of America and Russia.GA 2019
Click for large version
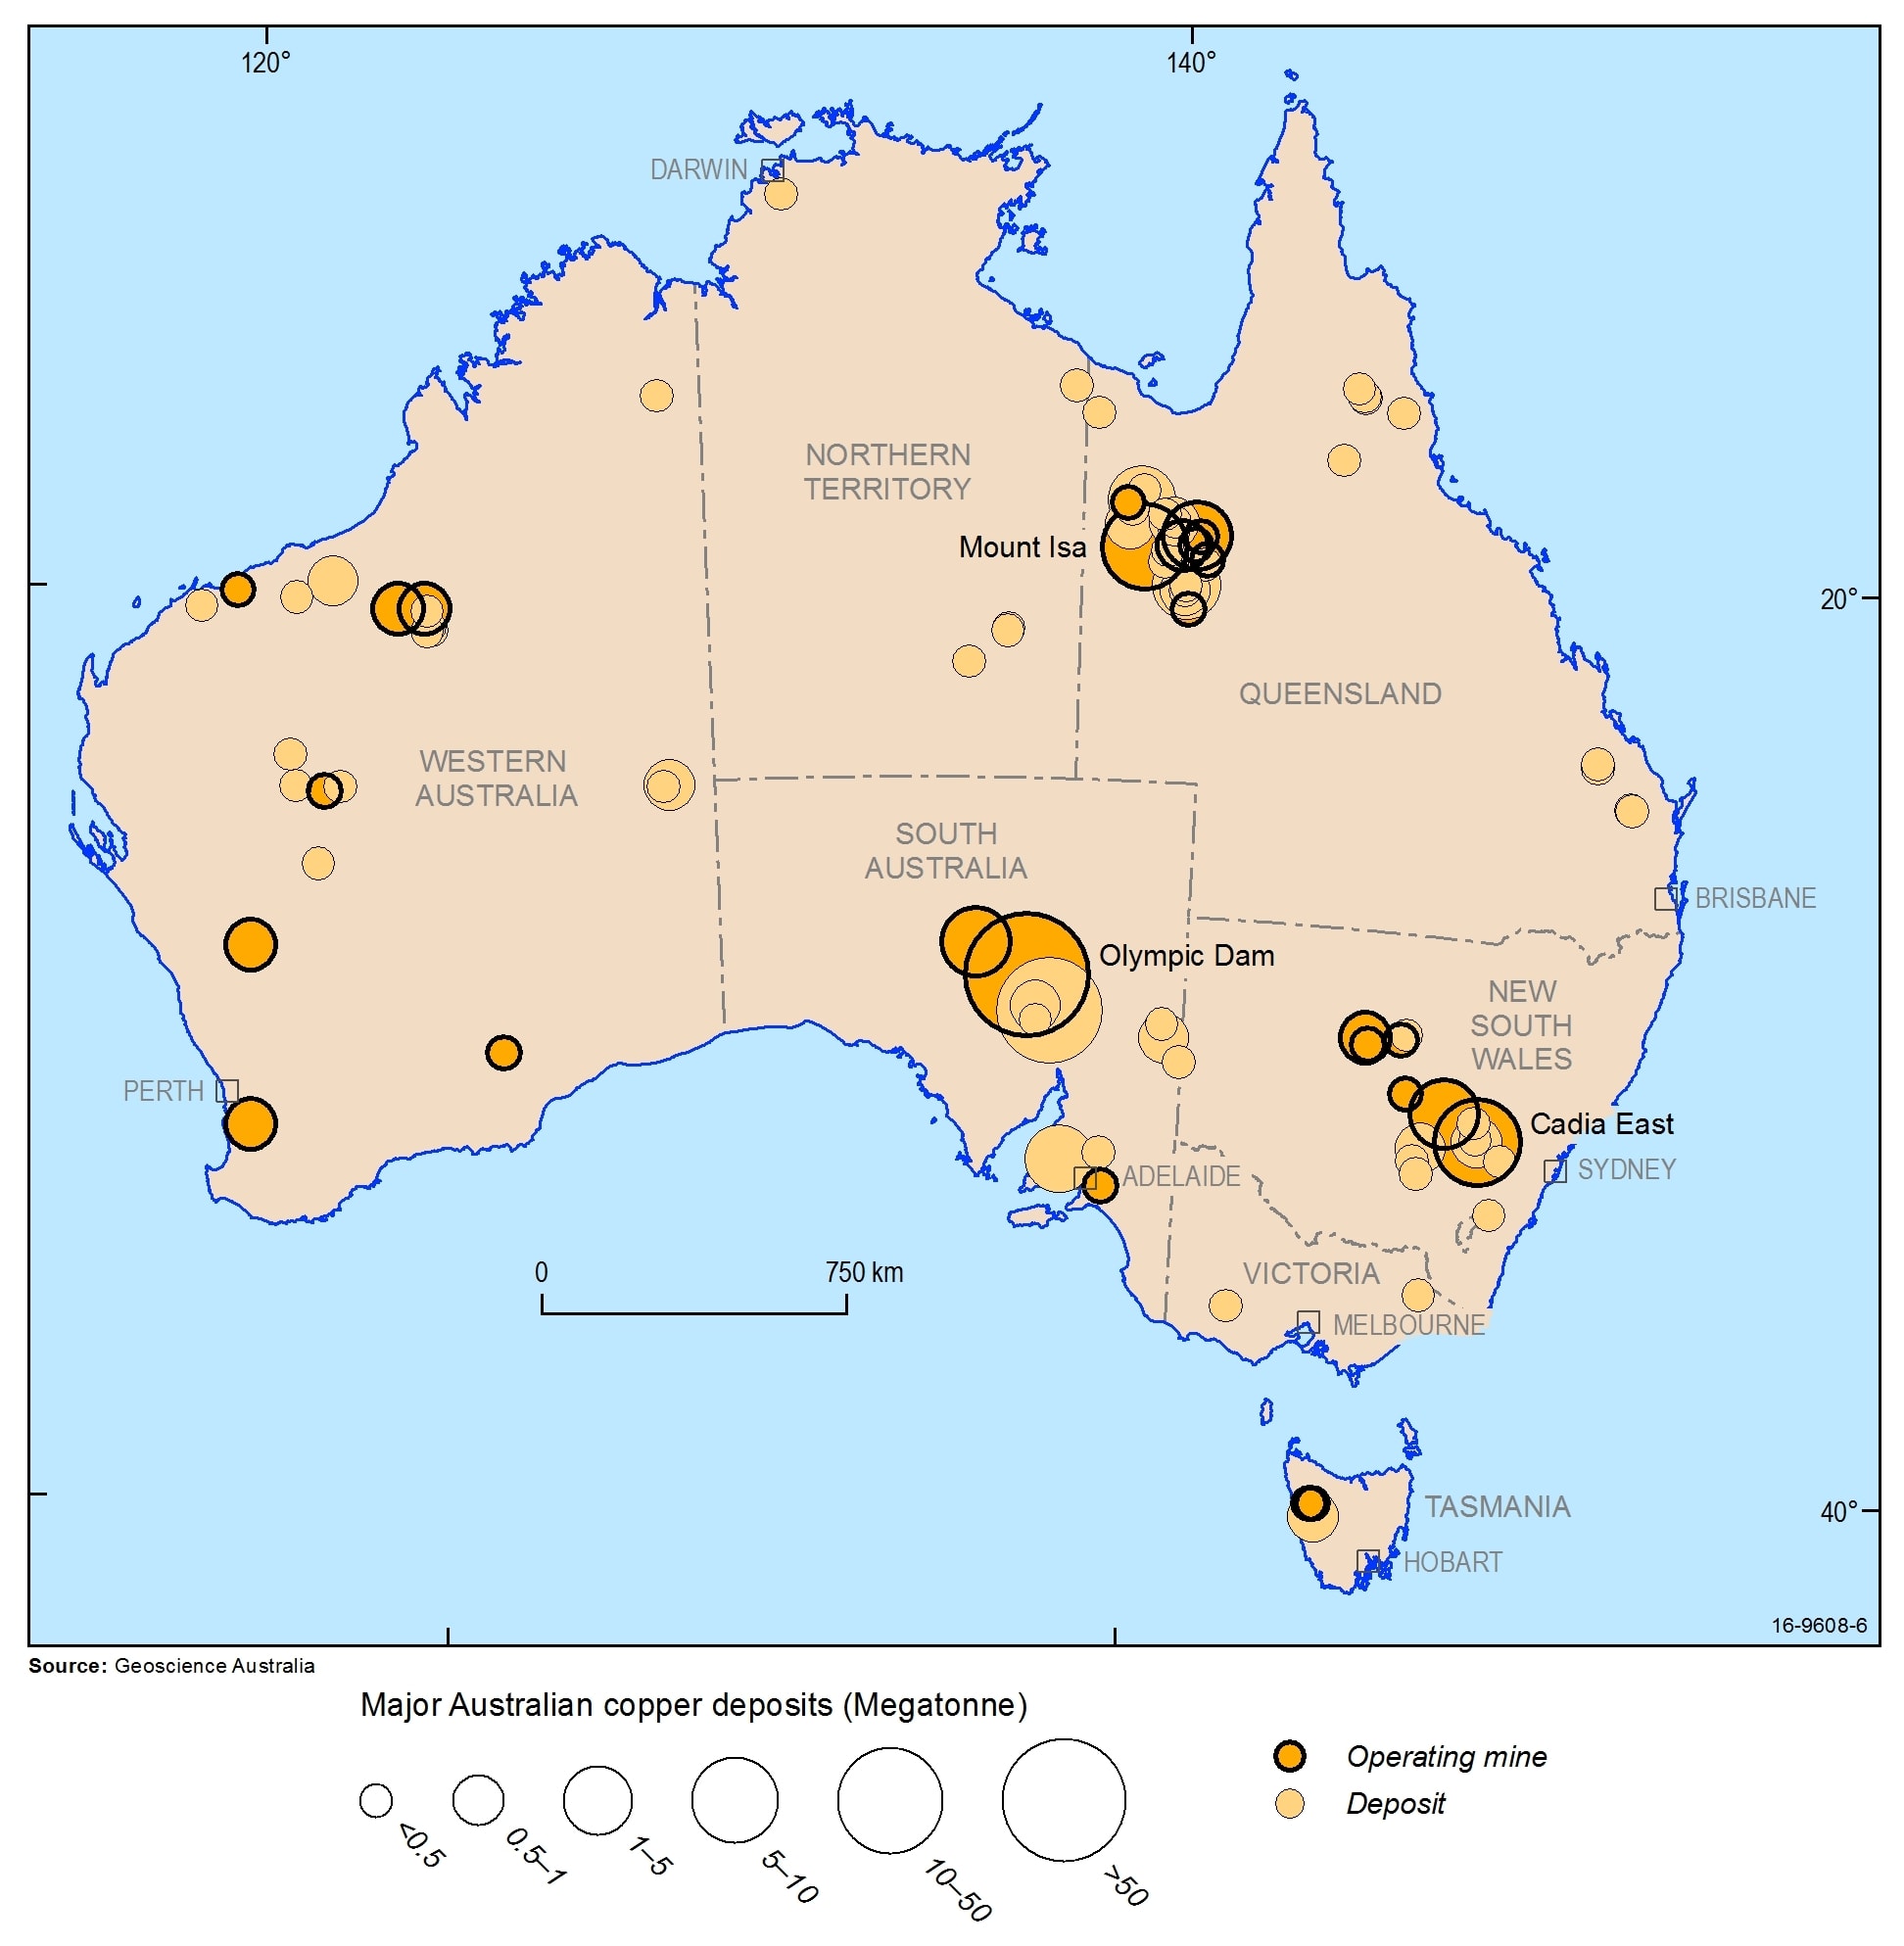
Copper
Australia has several significant copper mines including Mt Isa in QLD and the Olympic Dam in SA. Australia is ranked 2nd behind Chile in world copper reserves.GA 2016
Click for large version
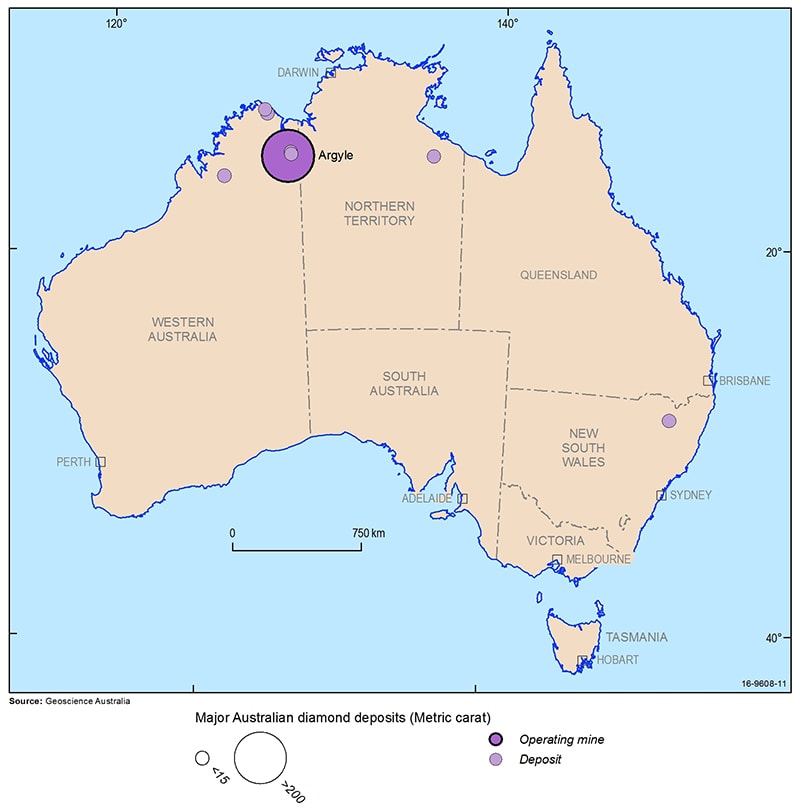
Diamond
The Argyle mine in north west of Australia was the world's largest volume producer every year since the 1980s. It supplied approximately a third of the world's diamonds and 90% of pink diamonds.GA 2016 Mining ceased operations in November 2020.
Click for large version.
Gold
Australia is estimated to have 19% of the world’s Economic resource of gold and ranked first in the world ahead of South Africa, Russia and USA.GA 2018
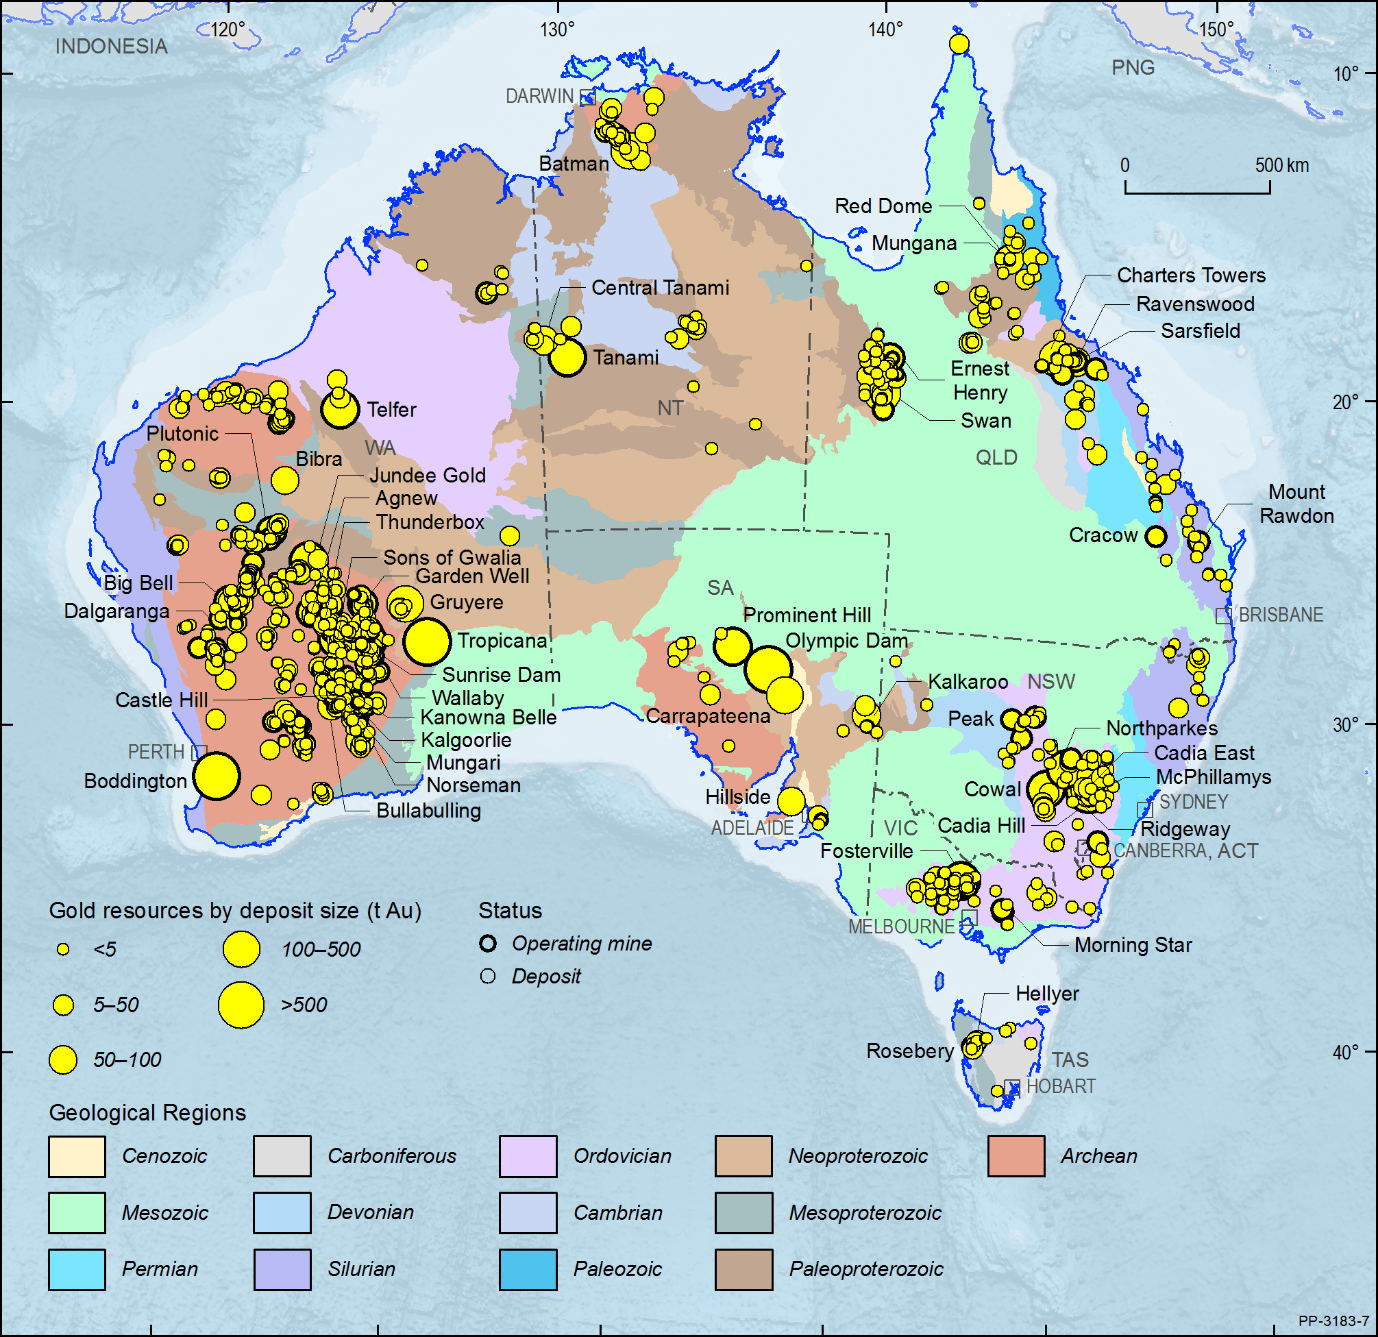
Click for large version.
Iron Ore
Australia is estimated to have 29% of the world’s economic resource of iron ore and ranked first in the world ahead of Brazil (18%) and Russia (14%).GA 2018
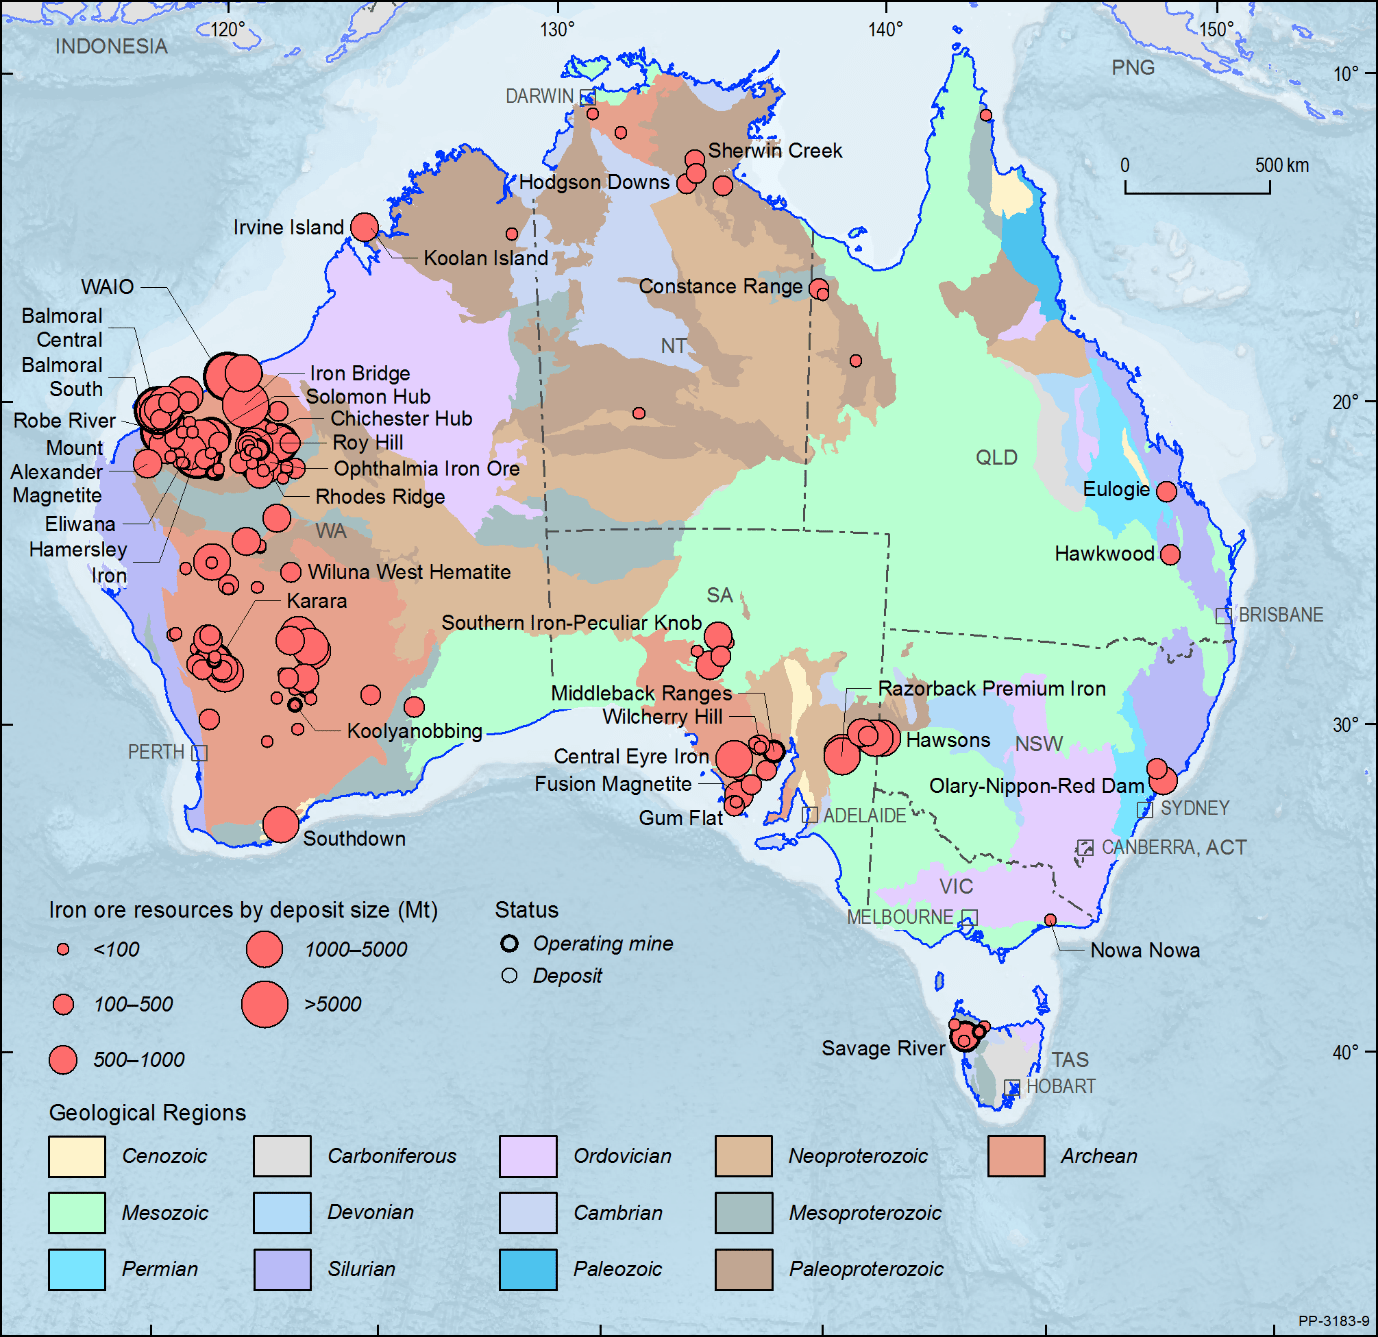
Click for large version
Lead and Zinc
Australia is estimated to have 38% of the world’s economic resource of lead, and 29% of the world’s economic resource of Zinc.GA 2018
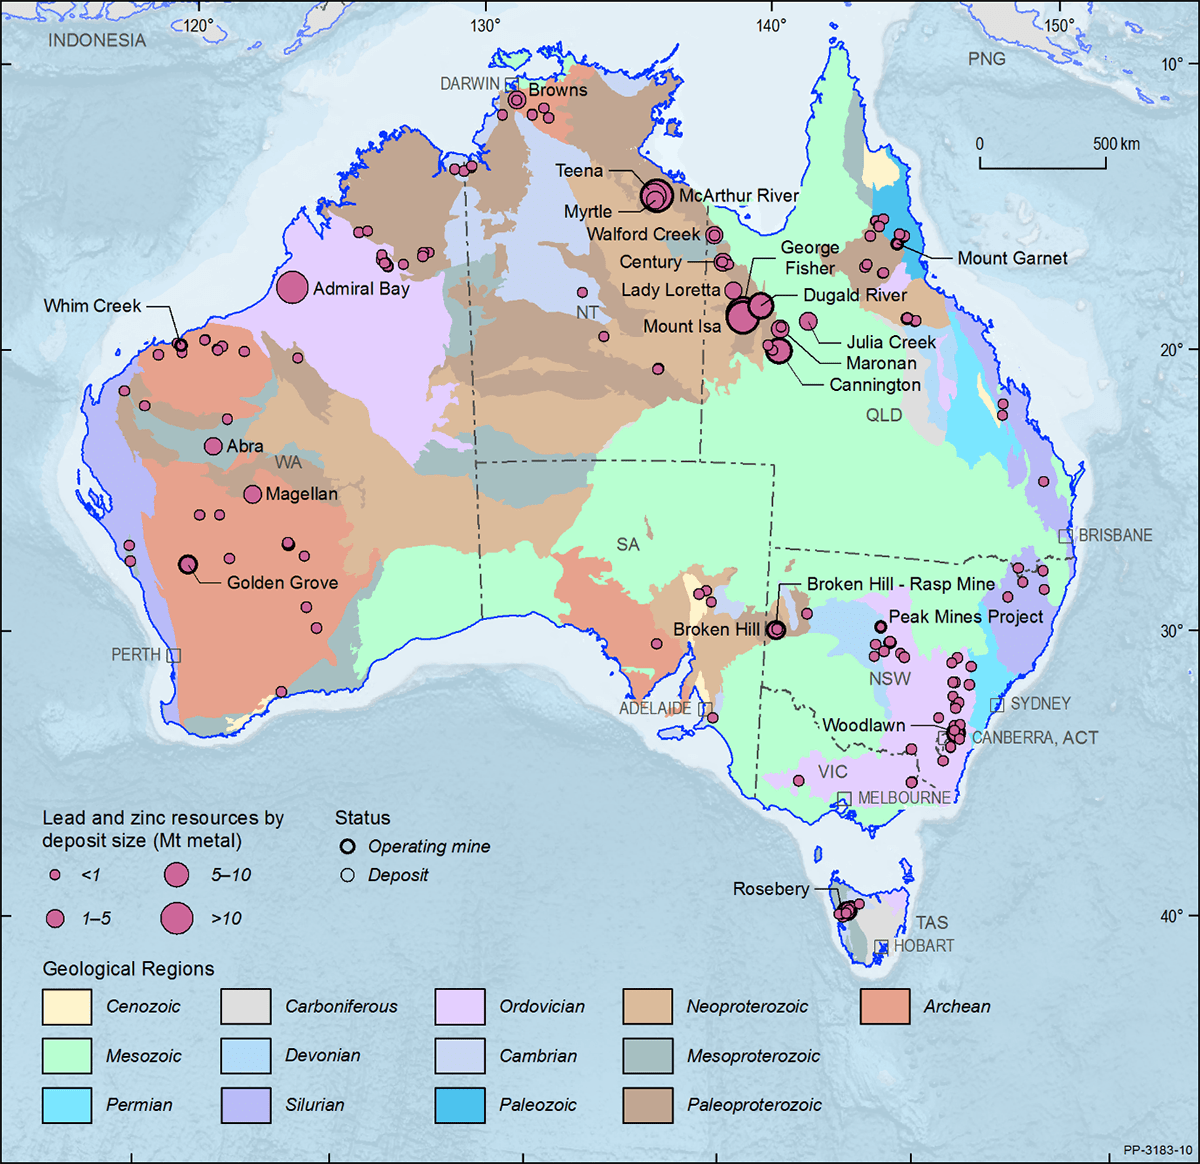
Click for large version
Silver
Australia is estimated to have 16% of the world’s economic resource of silver, behind Peru and Poland with 20% each.GA 2018
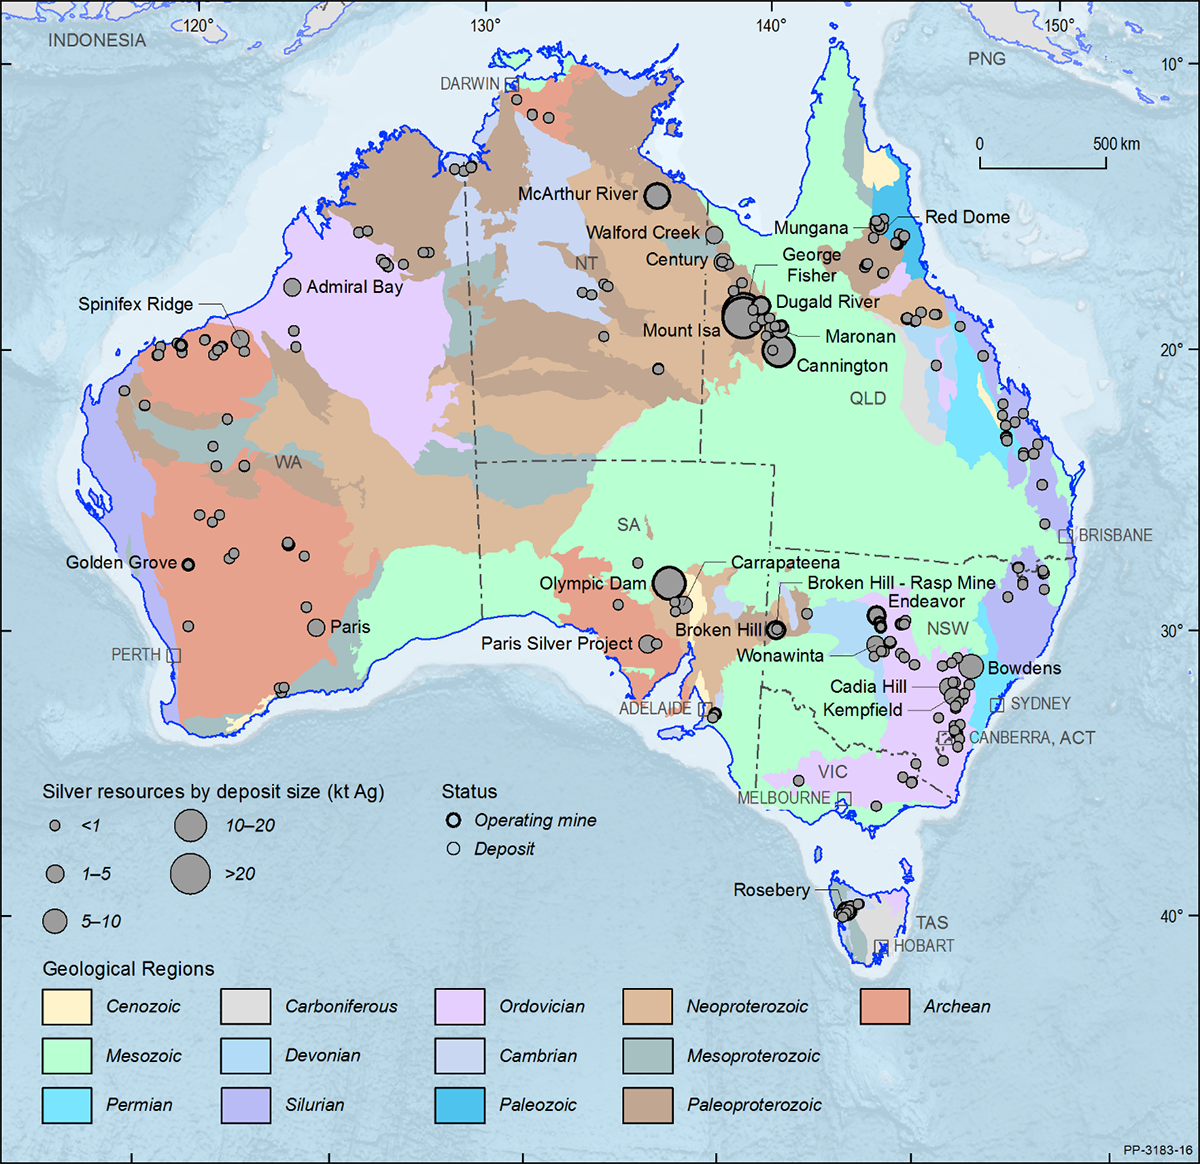
Click for large version
Nickel
Australia is estimated to have 24% of the world’s economic resource of nickel and ranked first in the world ahead of Indonesia, Brazil and Russia.GA 2019
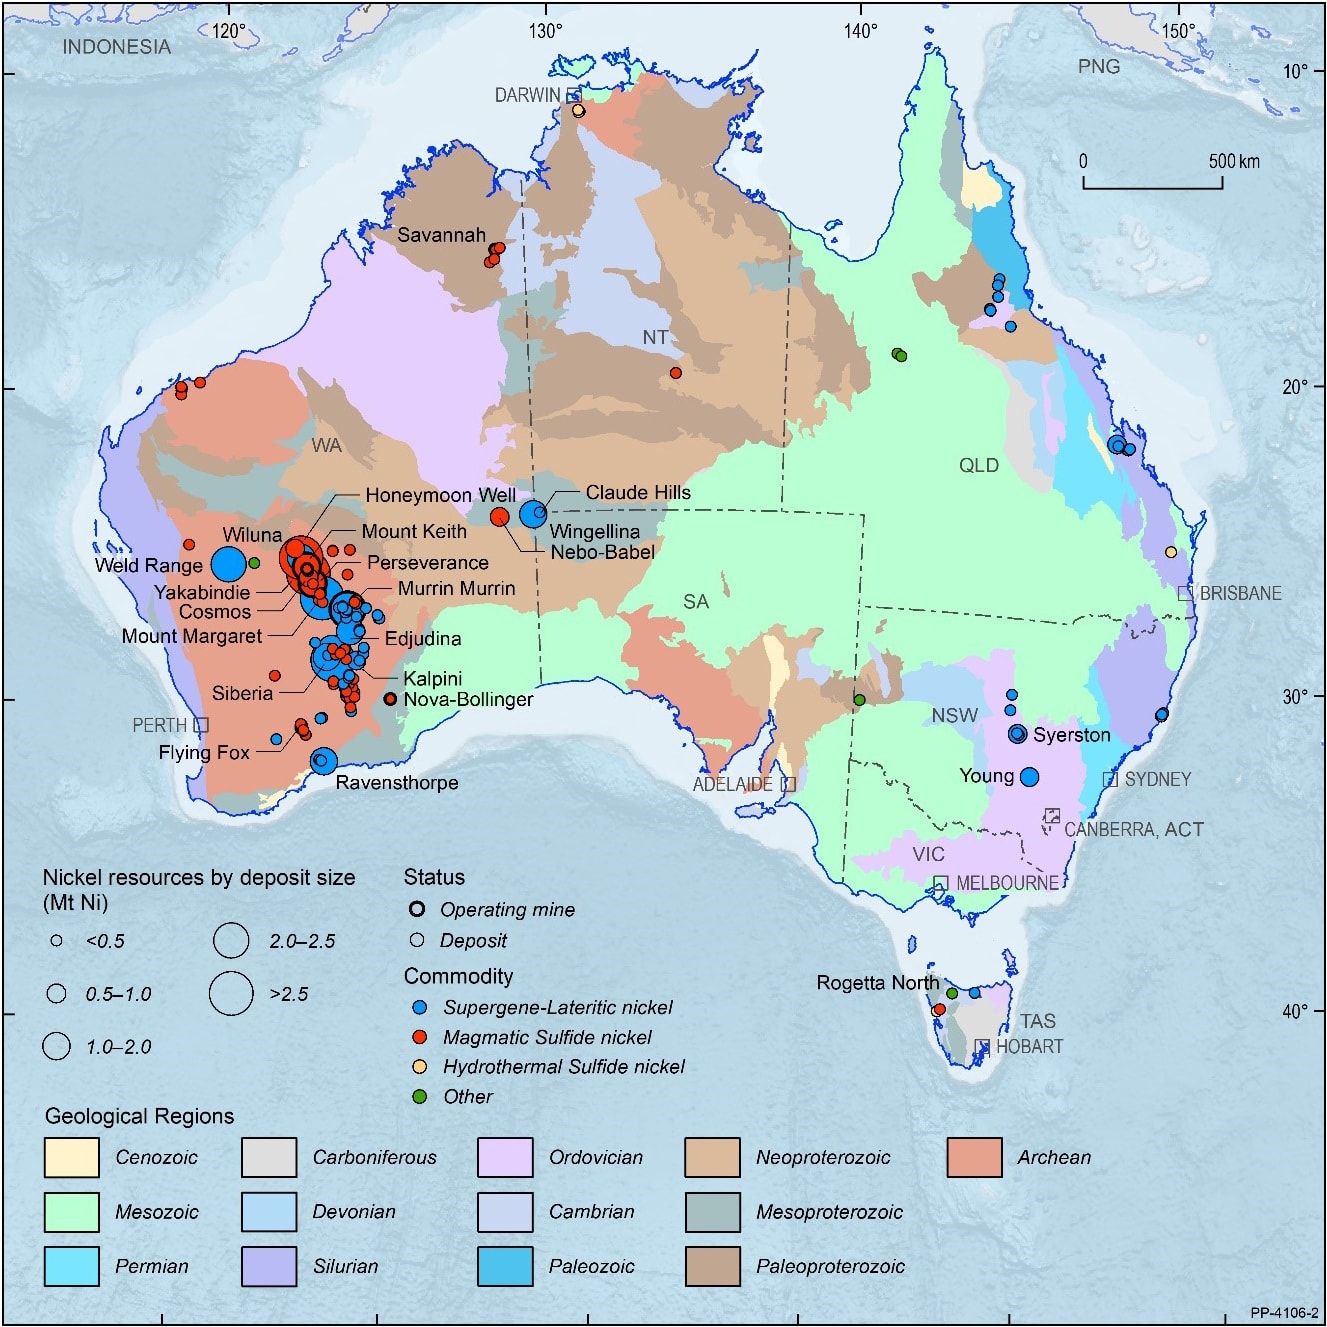
Click for large version
Uranium
Australia is estimated to have 31% of the world's uranium at a recoverable cost of less than US$130/kg and ranked first in the world ahead of Canada and Kazakhstan.GA 2019
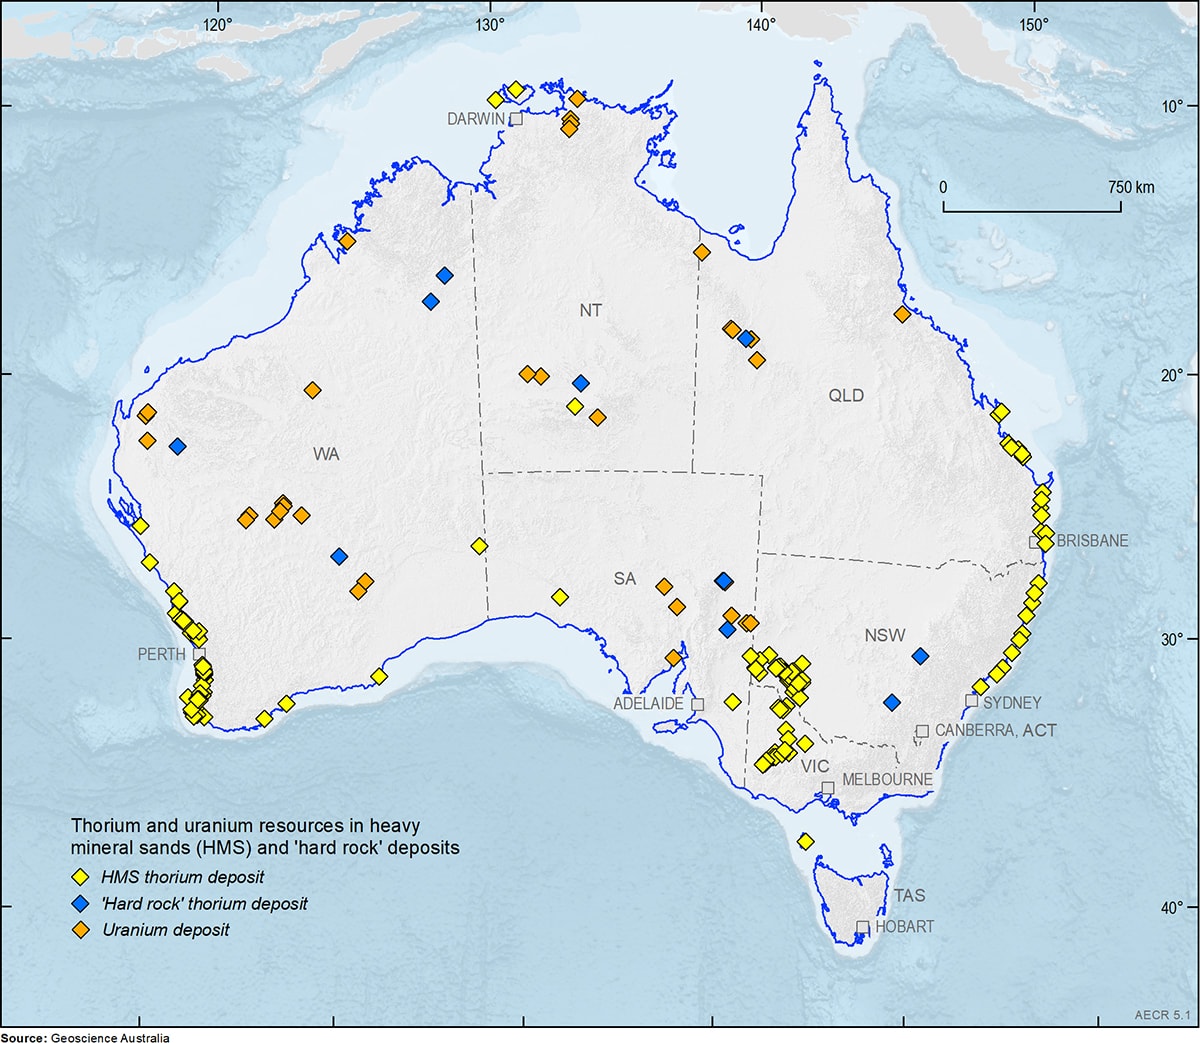
Click for large version
Resources
Spreadsheet of all mines including their synonyms, state, GPS co-ordinates and commodities type.
Annually released report by Geoscience Australia. The historical 2020, 2019, 2018, 2016, 2015, 2014 and 2013 editions are also available.
A 202 page document prepared by the U.S. Geological Survey (USGS) that contains global statistical data for all minerals. Annual figures, country breakdowns and trend identification. Geoscience Australia use USGS for foreign country data when doing their calculations.
 Gold
Gold  Silver
  Copper
  Crude Oil
  Iron Ore