Silver Logo

Silver

Commodity · USD/oz
25.32
0.08
(0.30%)
DAY HIGH
25.36
DAY LOW
25.22
PREV CLOSE
25.34
1 YR RETURN
+12.08%
52 WEEK RANGE
20.94
-
26.44

Silver Chart

About & Performance

Silver(Ag) is a precious metal that's around 1 / 80 the price of gold.

Demand for silver comes equally from both industrial and investment avenues(significantly more than gold's 11% industrial demand). This unique balance means that the economic outlook for the world economy can directly affect the price.

The U.S. Geological Survey (2015) states the global usage of silver is:

  • Electrical & Electronics - 29%
  • Coins & Medals - 25%
  • Photography - 8%
  • Jewellery & Silverware - 7%
  • Other - 31%

The London bullion market (LBMA) is regarded as the industry benchmark with the spot price set once daily at 12:00pm GMT in US dollars. COMEX Futures are usually quoted online as they are transparent and trade 24 hours a day.

The ETFs Physical Silver (ETPMAG) is the only ASX listed ETF that tracks the physical price of silver.

Market Index tracks the COMEX Futures.

Silver Prices AUD USD
Troy ounce (oz) $38.75 $25.32
Pound (lb) $565.03 $369.25
Gram (g) $1.25 $0.814
Kilogram (kg) $1,245.69 $814.06

2:45 pm 19/03 AEDT USD/oz

Performance USD/oz Amount Change
1 Week +0.98 +4.03%
1 Month +1.85 +7.86%
3 Month +1.00 +4.11%
6 Month +1.77 +7.52%
1 Year +2.73 +12.08%

2:45 pm 19/03 AEDT USD/oz

ASX Silver Companies

Closed - 03/2024
-
Company Price Chg % Chg High Low Volume Mkt Cap 1 Year
29M
29METALS Ltd
$0.520 +0.055 +11.83% $0.525 $0.470 4,473,815 $364.88 M -54.99%
AAU
Antilles Gold Ltd
$0.020 +0.001 +5.26% $0.020 $0.020 710,719 $17.97 M -47.37%
ADT
Adriatic Metals Plc
$3.70 -0.065 -1.73% $3.75 $3.58 171,485 $909.39 M -1.20%
AGD
Austral Gold Ltd
$0.026 0.00 0.00% $0.000 $0.000 - $15.92 M -40.91%
AML
Aeon Metals Ltd
$0.006 -0.001 -14.29% $0.008 $0.006 1,052,361 $6.58 M -76.00%
AQI
Alicanto Minerals Ltd
$0.030 0.00 0.00% $0.000 $0.000 - $18.46 M -28.57%
ARD
Argent Minerals Ltd
$0.010 -0.001 -5.00% $0.010 $0.010 371,492 $12.27 M -20.83%
AZS
AZURE Minerals Ltd
$3.61 0.00 0.00% $3.63 $3.61 279,646 $1.66 B +1237.04%
BML
Boab Metals Ltd
$0.120 -0.005 -4.00% $0.125 $0.120 25,076 $22.02 M -36.84%
BSM
Bass Metals Ltd
$0.200 0.00 0.00% $0.000 $0.000 - $17.54 M 0.00%
EQE
EQUUS Mining Ltd
$0.050 0.00 0.00% $0.000 $0.000 - $12.65 M 0.00%
HRZ
Horizon Minerals Ltd
$0.035 +0.002 +6.06% $0.035 $0.034 130,000 $24.53 M -30.00%
IVR
Investigator Resources Ltd
$0.041 -0.001 -2.38% $0.041 $0.041 178,800 $64.94 M 0.00%
KCN
Kingsgate Consolidated Ltd
$1.24 0.00 0.00% $1.24 $1.22 124,453 $318.32 M -29.63%
KSN
Kingston Resources Ltd
$0.078 -0.001 -1.27% $0.082 $0.078 144,414 $38.84 M -13.33%
MKR
Manuka Resources Ltd
$0.075 -0.006 -7.41% $0.079 $0.075 327,693 $49.36 M +38.89%
MTH
Mithril Resources Ltd
$0.002 0.00 0.00% $0.000 $0.000 - $6.74 M +33.33%
NCM
Newcrest Mining Ltd
$23.35 0.00 0.00% $0.000 $0.000 - $20.88 B +20.30%
NCZ
New Century Resources Ltd
$1.10 0.00 0.00% $0.000 $0.000 - $148.48 M -45.00%
OZL
OZ Minerals Ltd
$28.19 0.00 0.00% $0.000 $0.000 - $9.51 B +17.61%
PNX
PNX Metals Ltd
$0.006 0.00 0.00% $0.006 $0.006 658 $32.28 M +100.00%
RDM
Red Metal Ltd
$0.180 -0.01 -5.26% $0.195 $0.175 878,780 $53.85 M +158.93%
RIM
Rimfire Pacific Mining Ltd
$0.041 +0.001 +2.50% $0.042 $0.040 1,184,624 $91.03 M +583.33%
RNX
Renegade Exploration Ltd
$0.006 -0.001 -14.29% $0.006 $0.006 45,355 $6.02 M -40.00%
SFR
Sandfire Resources Ltd
$8.54 -0.06 -0.70% $8.63 $8.49 568,068 $3.9 B +49.30%
SKN
Skin Elements Ltd
$0.004 0.00 0.00% $0.000 $0.000 - $2.36 M -73.53%
SVL
Silver Mines Ltd
$0.150 0.00 0.00% $0.153 $0.148 3,394,909 $226.21 M -11.77%
TMZ
Thomson Resources Ltd
$0.005 0.00 0.00% $0.000 $0.000 - $4.88 M 0.00%
VXR
Venturex Resources Ltd
$0.570 0.00 0.00% $0.000 $0.000 - $397.61 M +541.31%

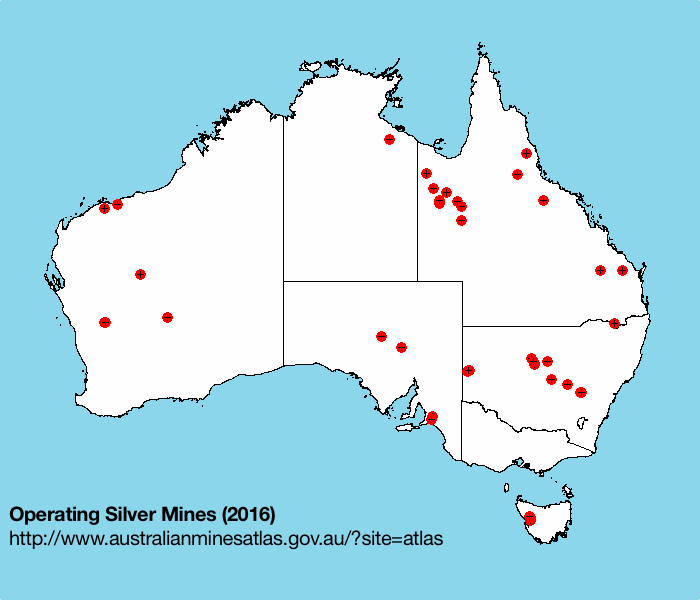
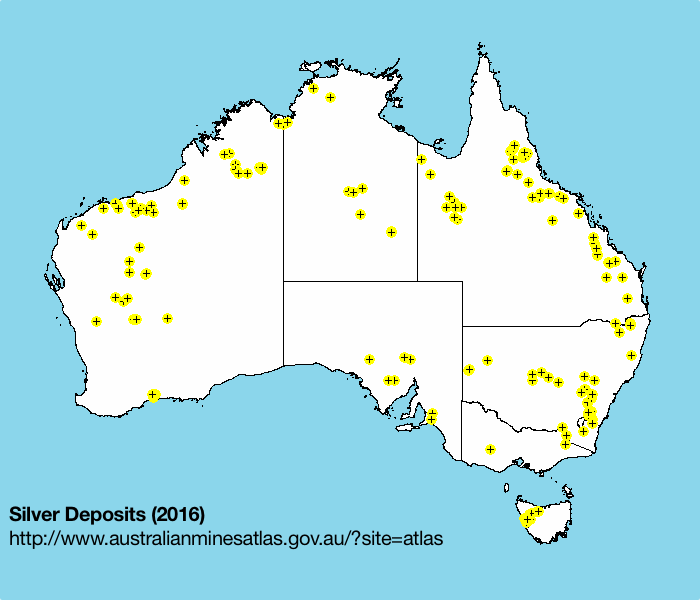
The ASX doesn't have many silver companies. Most companies mine silver as a by-product of producing other metals (e.g. lead, zinc, copper and gold). Australia holds around 16% of the world's silver resources with 55% located in Queensland [1]. View an image of Australia's 2016 silver deposits and operating mines .

Quick Quote - instant share price

()

20min delayed

- (-)

Volume:
Turnover:
Market Cap:

FAQs

Historical Chart

Resources

Excel Icon

Comodities Workbook

(Spreadsheet)

Download a spreadsheet of the official silver price (USD/oz) since 1968.

Map Icon

All Australian Mineral Resources (9 Maps)

(High-Definition Map)

A list of Australia's major minerals with statistics and maps outlining all known deposits and operating mines.