
Aussie shares faltered today, but they didn't flop. Investors went back to the tried and true "defence" playbook which meant buying financials, consumer staples, and utilities... but selling back some of the mining stocks they so eagerly scooped up yesterday.
Be sure to click/scroll through for the usual reporting of the major sector and stock-specific moves, the broker responses to them, as well as all the key economic data in tonight's Evening Wrap. Also, I have detailed technical analysis on the Nasdaq Composite and the S&P/ASX 200 in today's ChartWatch.
Let’s dive in!
Today in Review
Name | Value | % Chg |
|---|---|---|
Major Indices | ||
| ASX 200 | 9,020.8 | -0.49% |
| All Ords | 9,144.7 | -0.66% |
| Small Ords | 3,199.3 | -2.23% |
| All Tech | 3,012.6 | -1.16% |
| Emerging Companies | 2,741.3 | -2.43% |
Currency | ||
| AUD/USD | 0.6889 | -0.59% |
US Futures | ||
| S&P 500 | 7,380.5 | -0.03% |
| Dow Jones | 51,114.0 | -0.97% |
| Nasdaq | 26,964.75 | +0.80% |
Name | Value | % Chg |
|---|---|---|
Sector | ||
| Consumer Staples | 13,813.6 | +1.41% |
| Financials | 9,808.3 | +0.56% |
| Communication Services | 1,656.7 | +0.30% |
| Utilities | 10,673.9 | +0.20% |
| Industrials | 8,421.0 | -0.02% |
| Energy | 10,233.8 | -0.08% |
| Health Care | 35,258.3 | -0.20% |
| Consumer Discretionary | 3,827.4 | -0.52% |
| Information Technology | 1,783.5 | -0.78% |
| Real Estate | 3,493.6 | -0.86% |
| Materials | 22,604.4 | -2.51% |
ASX 200 Intraday Chart
Markets
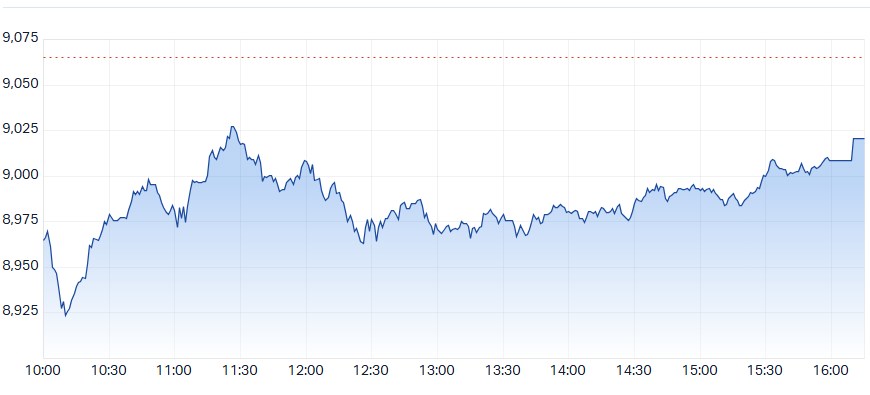
The S&P/ASX 200 (XJO) finished 44.3 points lower at 9,020.8, 1.1% from its session low and 0.5% from its high. In the broader-based S&P/ASX 300 (XKO) advancers lagged decliners by a near about-face to yesterday — 75 to 208.
For the week, the XJO finished up 113 points or 1.3% higher, 2.5% from its intraweek low and 0.5% from its intraweek high.
Today's best ASX Top 300 gainers
Company | Last Price | Change $ | Change % | 1mo % | 1yr % |
|---|---|---|---|---|---|
| Nine Entertainment Co. Holdings (NEC) | $0.815 | +$0.085 | +11.6% | +22.6% | -28.5% |
| NEXTDC (NXT) | $10.40 | +$0.55 | +5.6% | -2.3% | -30.1% |
| Amcor Plc (AMC) | $65.01 | +$2.90 | +4.7% | +7.8% | +1.7% |
| Latitude Group Holdings (LFS) | $0.865 | +$0.035 | +4.2% | +10.2% | -24.1% |
| QBE Insurance Group (QBE) | $26.75 | +$0.86 | +3.3% | +13.5% | +35.0% |
| National Australia Bank (NAB) | $40.00 | +$1.04 | +2.7% | +4.2% | -7.1% |
| TPG Telecom (TPG) | $4.10 | +$0.09 | +2.2% | +7.9% | -25.5% |
| Contact Energy (CEN) | $7.04 | +$0.14 | +2.0% | +2.8% | -13.9% |
| Coles Group (COL) | $22.60 | +$0.40 | +1.8% | -1.7% | +2.7% |
| Woolworths Group (WOW) | $42.45 | +$0.73 | +1.8% | +10.9% | +50.6% |
| Tuas (TUA) | $1.46 | +$0.025 | +1.7% | -14.9% | -79.2% |
| GPT Group (GPT) | $5.18 | +$0.08 | +1.6% | +18.5% | -4.1% |
| Bendigo and Adelaide Bank (BEN) | $10.83 | +$0.16 | +1.5% | +5.9% | -16.2% |
| Endeavour Group (EDV) | $3.60 | +$0.05 | +1.4% | +21.6% | -1.6% |
| Telstra Group (TLS) | $5.10 | +$0.07 | +1.4% | +6.0% | +3.2% |
| Cromwell Property Group (CMW) | $0.365 | +$0.005 | +1.4% | +12.3% | -22.3% |
| Computershare (CPU) | $42.99 | +$0.56 | +1.3% | +7.9% | +17.4% |
| Storage King Group (SKG) | $1.155 | +$0.015 | +1.3% | +7.9% | -17.2% |
| Charter Hall Retail REIT (CQR) | $3.94 | +$0.05 | +1.3% | +18.0% | -4.8% |
| Transurban Group (TCL) | $14.60 | +$0.17 | +1.2% | +11.9% | -0.5% |
Today's worst ASX Top 300 losers
Company | Last Price | Change $ | Change % | 1mo % | 1yr % |
|---|---|---|---|---|---|
| Develop Global (DVP) | $3.55 | -$0.40 | -10.1% | -18.9% | +8.6% |
| EQ Resources (EQR) | $0.28 | -$0.03 | -9.7% | -29.1% | +536.4% |
| News Corporation (NWS) | $43.07 | -$4.41 | -9.3% | -5.2% | -4.3% |
| Minerals 260 (MI6) | $0.75 | -$0.07 | -8.5% | -12.3% | +141.9% |
| Sunrise Energy Metals (SRL) | $11.58 | -$1.04 | -8.2% | -43.3% | +162.6% |
| Metals X (MLX) | $1.52 | -$0.135 | -8.2% | -26.9% | +84.2% |
| St Barbara (SBM) | $0.74 | -$0.065 | -8.1% | -4.5% | +49.5% |
| FireFly Metals (FFM) | $1.32 | -$0.115 | -8.0% | -19.5% | -24.5% |
| Sims (SGM) | $19.65 | -$1.53 | -7.2% | -18.8% | +23.2% |
| Silex Systems (SLX) | $2.97 | -$0.23 | -7.2% | -31.7% | -68.4% |
| GR Engineering Services (GNG) | $6.75 | -$0.51 | -7.0% | -11.2% | +74.4% |
| Imdex (IMD) | $3.20 | -$0.24 | -7.0% | -6.7% | -6.4% |
| Southern Cross Electrical Engineering (SXE) | $3.53 | -$0.26 | -6.9% | -33.6% | +54.1% |
| Turaco Gold (TCG) | $0.72 | -$0.05 | -6.5% | -21.7% | +75.6% |
| Mesoblast (MSB) | $2.03 | -$0.14 | -6.5% | 0.0% | -11.4% |
| Arafura Rare Earths (ARU) | $0.145 | -$0.01 | -6.5% | -14.7% | -42.0% |
| Pantoro Gold (PNR) | $3.06 | -$0.21 | -6.4% | +5.9% | -36.9% |
| Southern Cross Gold Consolidated (SX2) | $8.59 | -$0.57 | -6.2% | -24.8% | +7.6% |
| James Hardie Industries Plc (JHX) | $39.20 | -$2.60 | -6.2% | +8.9% | +52.2% |
| Benz Mining Corp (BNZ) | $4.10 | -$0.27 | -6.2% | -11.4% | +178.9% |
Chartwatch
Nasdaq Composite Index
Nasdaq Composite Index chart
Analysis
If you've been suffering through my ChartWatch rants for a long time...
Then you know.

ChartWatch readers just know...
If you're new...
Then you're probably surprised by the events of the last 24 hours, possibly even concerned.
Certainly, it seems the global financial media community is surprised and concerned! 😱
But that's not how we do things here.
Demand.
Supply.
Price.
Manage Risk.
We do the work. We allocate capital. And most importantly, we sleep well at night.
I suggest, there's a few US investors and portfolio managers that didn't sleep well last night! 😉
Okay, checklist time! 📋
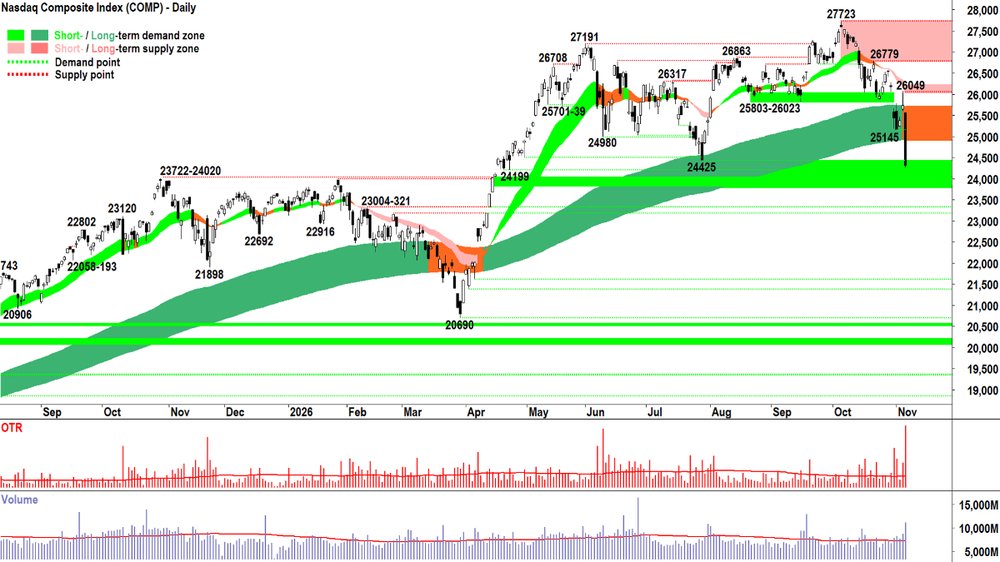
ST Trend: ⬇️ = ⚠️
ST trend ribbon is pink ⬇️
Price is below the ST trend ribbon
ST trend ribbon is acting as a zone of dynamic supply
LT Trend: ⬇️ = ⚠️
LT trend ribbon is amber ➡️ (but!)
Price is below the LT trend ribbon
LT trend ribbon is acting as a zone of dynamic supply*
Price action: ⬇️ = ⚠️
Falling peaks = STR, 🚫FOMO, 🚫HOFU
Falling troughs = NUTE, FOHO
Candles: ⬛ = ⚠️
Predominantly supply side in nature (i.e., long black bodies and or long upward pointing shadows) = STR, 🚫FOMO, 🚫HOFU, NUTE, FOHO
Volatility: Downside volatility well above average 💥 = ⚠️
Volume: Above average vs close near low = BTD but the dip kept dipping! Creates latent supply within Thursday's candle. Above average volume within 25145-26049 sets that zone as a major potential latent supply zone = ⚠️
There's no panic here. There's only resting heart rate! 😁
Investing and trading is HARD. That's why you must always listen to the experts... they know best!
Really? What we just did here... thousands of experts couldn't do... and we did it without any fanfare... just by looking at a few lines, squiggles, and black and white boxes on a chart.
This is the power of D vs S = P ladies and gentlemen. It's real. And anyone can do it.
Anyways, enough of the trend following vitriol! Let's finish off today's Analyse component with: ⚠️⚠️⚠️⚠️⚠️⚠️ = MOTN P ⬇️
Not guaranteed P ⬇️. P is gonna do whatever P is gonna do. The future is unknown. Prediction is futile. We don't predict.
But we DO Accept that MOTN is the safest and most sensible approach. So, if we accept all of the D vs S stuff implies P ⬇️, then what should we do about it!? 🤔
That's simple. We Act accordingly by reducing our risk!
View
I am moving to 1/3RP on US stocks (RP = Risk Position – it reflects my personal allowable capital allocation limit for my investments in US stocks. So 1/2RP is 50%, 2/3RP is 67% and FRP is 100%).
Key Levels
The long term trend ribbon is the closest (dynamic) zone of supply (presently 24909-25712) but 26049 is likely the critical go-no-go for the current short term downtrend. There appears to be a substantial zone of potential latent demand between 23722-24425.
*this is arguably still unclear... the peak at 26049 certainly "feels" like dynamic supply in the LT trend ribbon. Another peak formed in the ribbon, particularly in the bottom half of the ribbon or below, will confirm... and it will commence the next bear market as far as my model is concerned! 🐻
S&P/ASX 200 (XJO)
Analysis
Don't fret.
It's standard practice for the OTP to drop the day after I increase my portfolio RP! 🤣
But it didn't really go down today, did it? 🤷 It was... well the AI trade's unwound... I gotta go down a bit... at least at the open.
But then we saw the pervasive D > S that we've been observing for weeks now kick in... blissfully carefree of any AI concerns... because it's the Old Tin Pot were dealing with here... not the NEW AI TIN POT 🤖!
So, we didn't close anywhere near the worst levels of the day.
Now that doesn't mean if the you know what in the US really hits the fan... that we'll be completely immune. At some point, if it gets bad enough, the AI crash may transform into a credit crisis — and that's when the OTP absolutely WILL feel it! ⚠️
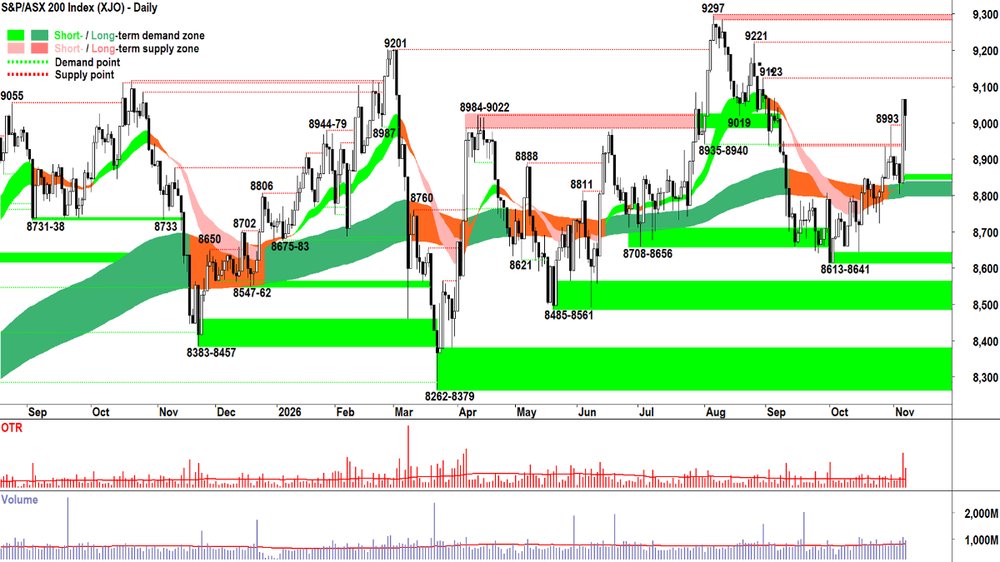
I don't know if the you know what is going to go that way — I don't predict, I react, remember!? So, I can only look at the chart above and consider what the trends, price action, candles, volatility and volume imply about D vs S = P.
And right now, at the conclusion of the Friday 6 November candle, it looks more like:
Yeah, there's definitely some you know what in close proximity to the spinning blades... but there's no need to panic and dump risk here just yet.
Given today's downward pointing shadow, particularly all things considered (I mean... it's a Friday, too!)... one really must stay the course here for now. Nothing has materially changed in the OTP's demand-supply environment between yesterday's candle and today's.
View
I am at 2/3RP on Australian shares (i.e., 67% cash vs 33% invested, with some of the invested portion allocated to shorts). Still transitioning from 1/2RP... it may take some time to get there. No rush!
Key Levels
9123-9297 is the closest zone of supply. The short-long term trend ribbons are the closest zone of (dynamic) demand (presently 8795-8845).
(Glossary of acronyms! Old Tin Pot (OTP): S&P/ASX 200 | MOTN: More Often Than Not | FOMO: Fear Of Missing Out | HOFU: Holding On For Upside | BTD: Buy The Dip | NUTE: No Urgency To Enter | FOHO: Fear Of Holding On | STR: Sell The Rally | RP: Risk Position | FFS: Fund Flow Shenanigans!)
***CHARTWATCH LIVE — LITHIUM & COPPER ON ALERT! 🚨📺***
ChartWatch LIVE Webinars – WEEKLY Wednesday's @ 12pm AEDT
Learn more about technical analysis and trend following through real case studies on ASX stocks. Australia's premier technical analyst, Carl Capolingua, shares his unique insights on stocks as requested by viewers. Ask about a company in your portfolio or anything related to trading and investing and get Carl's expert opinion.
Places are limited so >REGISTER NOW!<
Economy
TODAY
There weren't any major economic data releases in our time zone today.
LATER THIS WEEK
FRIDAY
21:30 USA October Non-Farm Payroll Data
Employment change: +63,000 forecast v s+29,000 in September
Average hourly earnings: +0.3% m/m forecast vs +0.1% m/m in September
Unemployment rate: +4.2% forecast, unchanged
Interesting Movers
Trading higher
- Mayne Pharma Group (MYX) $3.08+13.7%
Agreed to sell its international business, including the Adelaide manufacturing site, to Evaris Pharma for $55.5 million. MYX will retain its US women’s health and dermatology businesses.
- Nine Entertainment Co. Holdings (NEC) $0.82+11.6%
Issued a trading update at the company's AGM held today. First quarter digital subscription revenue growth was 7% vs previous corresponding period ("pcp"). Management said it expects first-half outdoor media revenue growth in the mid-teens, and flagged improved three-year cost reduction target to at least $180 million. Stan EBITDA growth expectations maintained.
- Tourism Holdings (THL) —
Announced it has received revised non-binding takeover proposals from BGH Capital and Indie Campers after due diligence. Takeover price not disclosed while board negotiates in a competitive process.
- Macquarie Group (MQG) —
Released first half FY27 results. Half-year net profit was $2.48 billion (up 50% vs pcp) and interim dividend $3.25 per share (35% franked). Separately, APRA has applied a $100 million capital penalty to MQG for miscalculating internal capital requirements for its non-bank business.
Trading Lower
- Develop Global (DVP) $3.55-10.1%
No news. Performance reflected general weakness in the broader materials sector. DVP is a regular in the ChartWatch ASX Scans Downtrends List. 📉
- News Corporation (NWS) $43.07-9.3%
No news today. US investors traded on the company's September quarter earnings released yesterday our time. Clearly, also, some fallout here from the big drop in US stocks overnight.
- James Hardie (JHX) —
Released its September quarter results. Management said US new home construction is likely to be even weaker over the next few months, though the group is less exposed after the Azek buyout.
Broker Moves
Company | Broker | Action | Rating | Price Target |
|---|---|---|---|---|
AARAstral Resources NL | Shaw and Partners | Retained | Buy | $0.30 |
AMCAmcor Plc | Morgan Stanley | Retained | Equal Weight | $68.57 |
| Morgans | Retained | Hold | $62.50(from $65.30) | |
| Ord Minnett | Retained | Hold | $62.00(from $64.00) | |
APEEagers Automotive | Bell Potter | Retained | Buy | $21.50(from $27.50) |
| Macquarie | Retained | Outperform | $22.20(from $26.60) | |
| Morgan Stanley | Retained | Overweight | $26.00 | |
| Morgans | Retained | Buy | $19.50(from $26.30) | |
| UBS | Retained | Neutral | $22.30 | |
ARBARB Corporation | Ord Minnett | Retained | Buy | $28.00 |
AS1Asara Resources | Canaccord Genuity | Retained | Speculative Buy | $0.35 |
ASXASX | UBS | Downgraded | Neutral(from Buy) | $68.60(from $65.50) |
BGABega Cheese | Macquarie | Retained | Outperform | $6.70 |
BRGBreville Group | Morgan Stanley | Retained | Overweight | $38.00 |
COGCOG Financial Services | Bell Potter | Retained | Buy | $2.20(from $2.10) |
| Morgans | Retained | Buy | $2.19(from $2.00) | |
| Shaw and Partners | Retained | Buy | $2.30 | |
GPTGPT Group | Citi | Retained | Buy | $6.00 |
HUMHumm Group | Shaw and Partners | Retained | Buy | $0.80 |
LNWLight & Wonder Inc. | Bell Potter | Retained | Buy | $176.00(from $183.00) |
| Canaccord Genuity | Retained | Buy | $181.00(from $186.00) | |
| Morgan Stanley | Retained | Overweight | $181.00 | |
| UBS | Retained | Buy | $212.00 | |
MGRMirvac Group | Morgan Stanley | Retained | Equal Weight | $2.05 |
MPKMany Peaks Minerals | Barrenjoey | Retained | Overweight | $2.20(from $1.60) |
MQGMacquarie Group | UBS | Retained | Neutral | $265.00 |
NABNational Australia Bank | Citi | Retained | Buy | $43.20(from $42.10) |
| Morgans | Retained | Trim | $34.19(from $35.67) | |
| Ord Minnett | Retained | Hold | $35.00(from $37.00) | |
| UBS | Retained | Buy | $45.00(from $48.50) | |
NEMNewmont Corporation | Citi | Retained | Buy | $200.00 |
NEUNeuren Pharmaceuticals | Bell Potter | Retained | Buy | $26.50(from $25.50) |
| Canaccord Genuity | Retained | Buy | $25.90(from $24.76) | |
| Macquarie | Retained | Outperform | $26.00 | |
| Ord Minnett | Retained | Buy | $27.80(from $27.60) | |
NWSNews Corporation | UBS | Retained | Buy | $60.00(from $58.00) |
NXTNEXTDC | Morgan Stanley | Retained | Equal Weight | $9.50(from $6.70) |
| Morgans | Downgraded | Accumulate(from Buy) | $11.50(from $7.50) | |
PDNPaladin Energy | Barrenjoey | Retained | Overweight | $13.00(from $13.10) |
| Morgans | Retained | Buy | $13.10 | |
REAREA Group | Bell Potter | Retained | Hold | $183.00(from $148.00) |
| Citi | Retained | Neutral | $179.25 | |
| Macquarie | Retained | Neutral | $170.00 | |
| Morgans | Downgraded | Accumulate(from Buy) | $203.00 | |
| UBS | Retained | Neutral | $184.00(from $164.00) | |
TLXTelix Pharmaceuticals | Canaccord Genuity | Retained | Buy | $31.50 |
VCXVicinity Centres | Citi | Retained | Neutral | $2.70 |
VMMViridis Mining and Minerals | Bell Potter | Retained | Speculative Buy | $6.05 |
| Ord Minnett | Retained | Speculative Buy | $6.50 | |
WDSWoodside Energy Group | Citi | Retained | Neutral | $32.90 |
| Ord Minnett | Upgraded | Accumulate(from Hold) | $31.50(from $29.75) | |
WTMWaratah Minerals | Shaw and Partners | Retained | Buy | $2.10(from $1.55) |
XROXero | Macquarie | Retained | Outperform | $158.50(from $235.80) |
Scans
Top Gainers
Code | Company | Last | % Chg |
|---|---|---|---|
| AAL | Alfabs Australia Ltd | $0.24 | +33.33% |
| IAM | Income Asset Management Group Ltd | $0.012 | +33.33% |
| RCR | Rincon Resources Ltd | $0.013 | +30.00% |
| CCR | Credit Clear Ltd | $0.18 | +28.57% |
| ITS | Infotrust Ltd | $0.25 | +25.00% |
Top Fallers
Code | Company | Last | % Chg |
|---|---|---|---|
| FTI | Fortifai Ltd | $0.245 | -23.44% |
| AD1 | Adneo Ltd | $0.012 | -20.00% |
| CTO | Citigold Corporation Ltd | $0.014 | -17.65% |
| S66 | Star Combo Pharma Ltd | $0.14 | -17.65% |
| CAE | Cannindah Resources Ltd | $0.02 | -16.67% |
52 Week Highs
Code | Company | Last | % Chg |
|---|---|---|---|
| AMX | Aerometrex Ltd | $0.335 | +8.07% |
| WRX | Western Ridge Resources Ltd | $0.058 | +4.51% |
| QBE | QBE Insurance Group Ltd | $26.75 | +3.32% |
| CUP | Count Ltd | $1.70 | +2.41% |
| EMB | Embelton Ltd | $11.80 | +2.17% |
52 Week Lows
Code | Company | Last | % Chg |
|---|---|---|---|
| AD1 | Adneo Ltd | $0.012 | -20.00% |
| CAE | Cannindah Resources Ltd | $0.02 | -16.67% |
| FDR | Finder Energy Holdings Ltd | $0.20 | -14.89% |
| FXG | FELIX Gold Ltd | $0.10 | -13.04% |
| GRE | Greentech Metals Ltd | $0.027 | -12.90% |
Near Highs
Code | Company | Last | % Chg |
|---|---|---|---|
| EXUS | Betashares Global Shares Ex US ETF | $38.01 | +2.51% |
| GLPR | iShares Ftse GBL Property Ex Aus (Aud Hedged) ETF | $28.42 | +3.01% |
| RHC | Ramsay Health Care Ltd | $56.01 | +1.38% |
| OZBD | Betashares Australian Composite Bond ETF | $43.31 | +0.30% |
| AN3PI | Australia and New Zealand Banking Group Ltd | $102.60 | -0.26% |
Relative Strength Index (RSI) Oversold
Code | Company | Last | % Chg |
|---|---|---|---|
| SEMI | Global X Semiconductor ETF | $30.61 | -5.03% |
| ATOM | Global X Uranium ETF | $15.25 | +0.73% |
| ALD | Ampol Ltd | $36.23 | -3.59% |
| BCOM | Global X Bloomberg Commodity Complex ETF | $12.47 | -2.35% |
| POL | Polymetals Resources Ltd | $0.465 | +2.20% |