
It was another day of haves and have nots on the Australian share market. Haves: Consumer discretionary (big time!), and defensives like staples and healthcare. Have nots: Any stock involved in digging or pumping something out of the ground!
Be sure to click/scroll through for the usual reporting of the major sector and stock-specific moves, the broker responses to them, as well as all the key economic data in tonight's Evening Wrap. Also, I have detailed technical analysis on the Nasdaq Composite and the S&P/ASX 200 in today's ChartWatch.
Let’s dive in!
Today in Review
Name | Value | % Chg |
|---|---|---|
Major Indices | ||
| ASX 200 | 8,748.7 | -0.68% |
| All Ords | 8,951.6 | -0.68% |
| Small Ords | 3,428.4 | -1.40% |
| All Tech | 2,931.4 | +0.08% |
| Emerging Companies | 2,912.1 | -2.70% |
Currency | ||
| AUD/USD | 0.689 | -0.15% |
US Futures | ||
| S&P 500 | 7,480.75 | +0.71% |
| Dow Jones | 52,362.0 | +0.16% |
| Nasdaq | 30,110.5 | +2.02% |
Name | Value | % Chg |
|---|---|---|
Sector | ||
| Health Care | 25,912.8 | +2.56% |
| Consumer Discretionary | 3,952.9 | +2.11% |
| Consumer Staples | 13,254.7 | +1.41% |
| Real Estate | 3,754.7 | +1.12% |
| Utilities | 9,799.0 | +0.71% |
| Communication Services | 1,625.3 | +0.27% |
| Industrials | 8,524.1 | +0.24% |
| Information Technology | 1,765.2 | -0.82% |
| Financials | 9,258.4 | -1.22% |
| Materials | 23,380.6 | -2.28% |
| Energy | 9,342.8 | -2.48% |
ASX 200 Intraday Chart
%20intraday%20chart_25%20Jun.png)
Markets
The S&P/ASX 200 (XJO) finished 59.7 points lower at 8,748.7, 0.68% from its session high and smack–bang on its session low. Despite the rather terrible performance at benchmark level, in the broader-based S&P/ASX 300 (XKO) advancers lagged decliners by only a modest 142 to 148.
Normally I'd waffle on here about how on bad days 'defensive' sectors tend to do better while 'growth-oriented' and 'cyclical' stocks tend to falter. You know... the drill for about the last 3 weeks...
FYI, defensive sectors are those whose earnings are less impacted by global economic downturns or just plain investor nerves, as they deal in stuff we all need all the time. Groceries, utilities, health care, booze... you know.
Growth oriented and cyclical sectors are those whose earnings largely depend on the strength of the global economy, and failing that, investor optimism that it's at least getting better. So, mining, energy, building materials... That sort of stuff.
Anyways, no waffle today: let's just look at the charts. Because they say it all! (They usually do! 💪)
CHARTS OF DEFENSIVE STUFF:
Health Care (XHJ) (+2.6%)
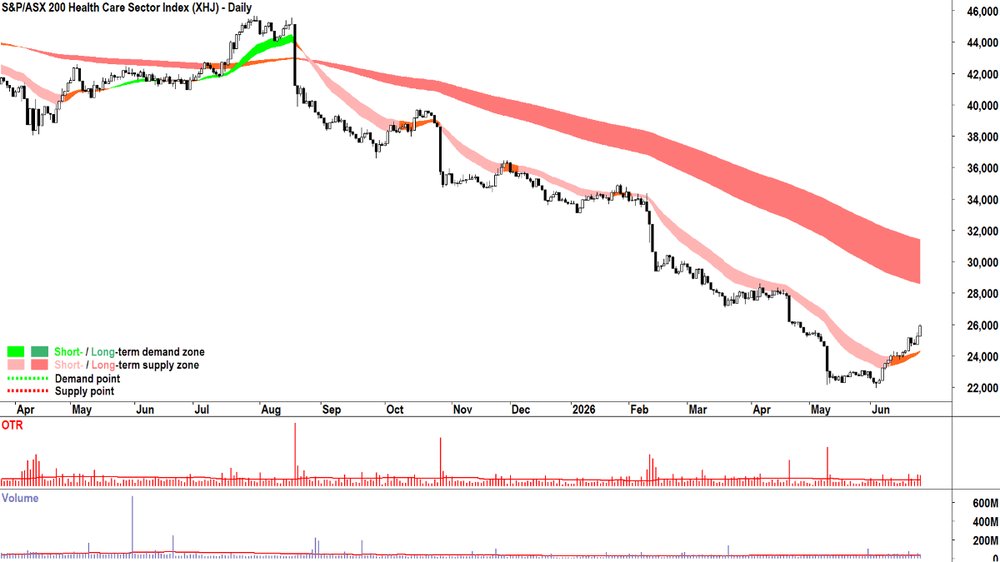
S&P/ASX 200 Health Care Sector Index chart
Consumer Staples (XSJ) (+1.4%)
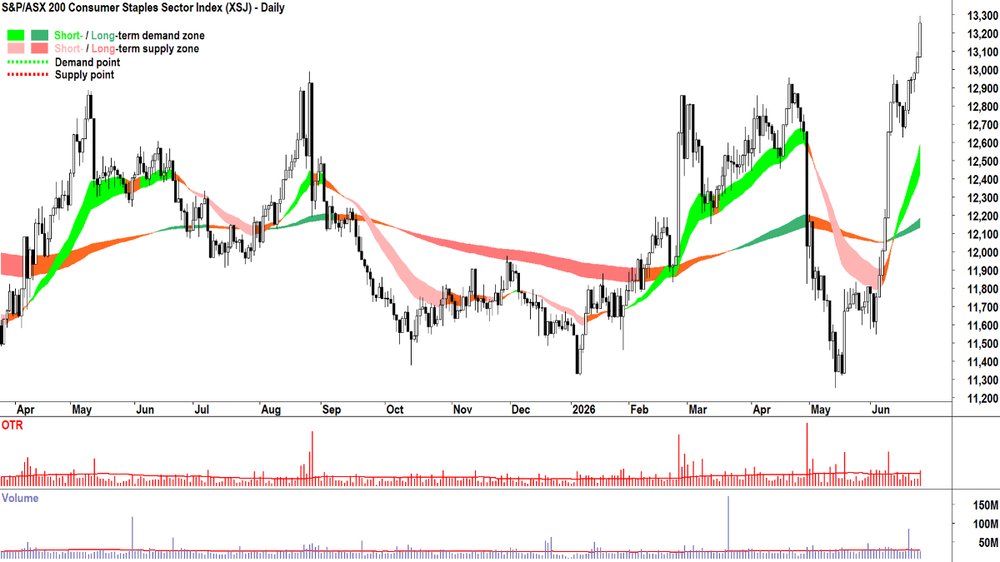
S&P/ASX 200 Consumer Staples Sector Index chart
Bond proxies sectors Real Estate (XPJ) (+1.1%) and Utilities (XUJ) (+0.7%) were also stronger today, as local 10-year bond yields traded to their lowest since the start of the Middle East conflict and ensuing oil price spike.
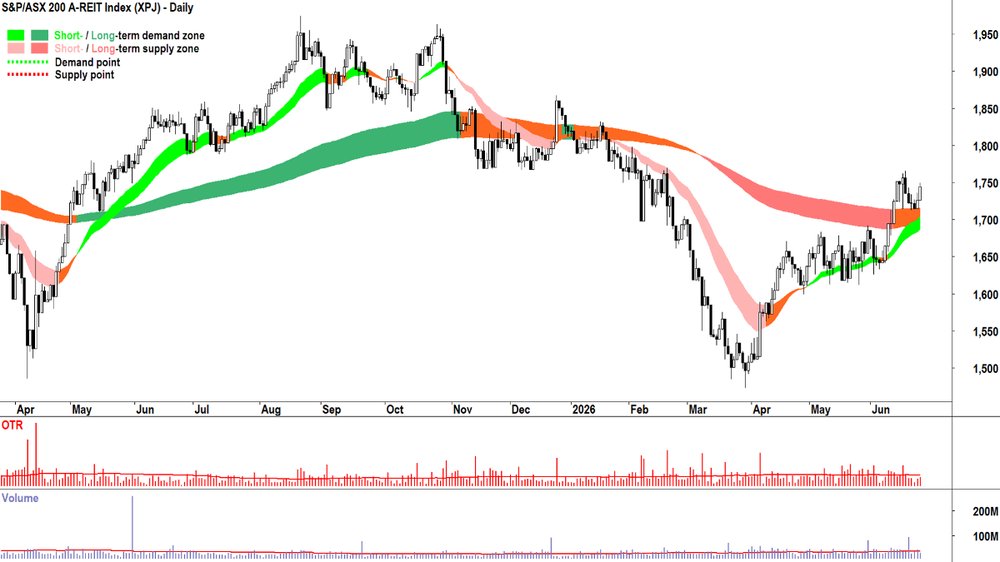
S&P/ASX 200 Real Estate Sector Index chart
CHARTS OF CYCLICAL STUFF:
Materials (XMJ) (-2.3%)
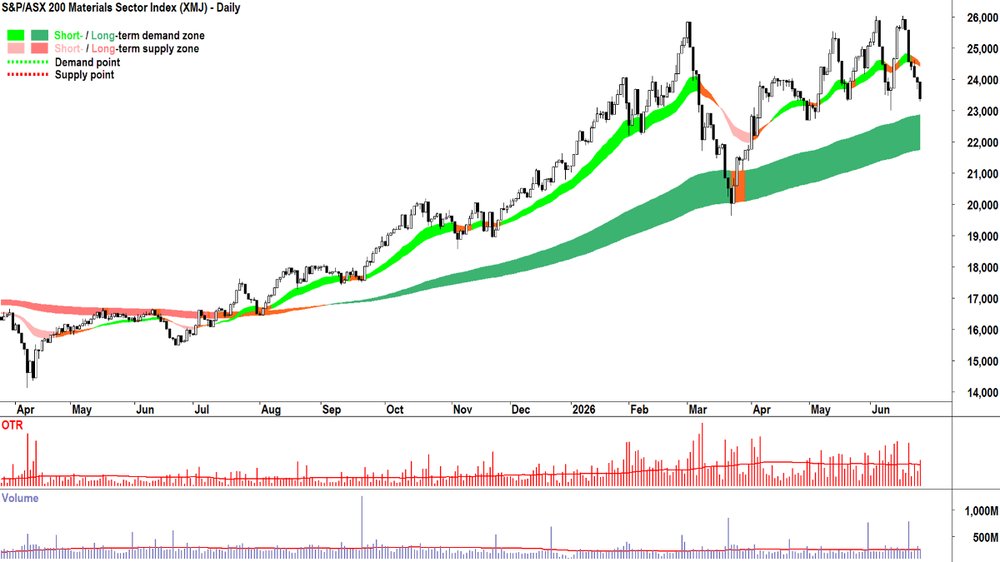
S&P/ASX 200 Materials Sector Index chart
Energy (XEJ) (-2.5%)
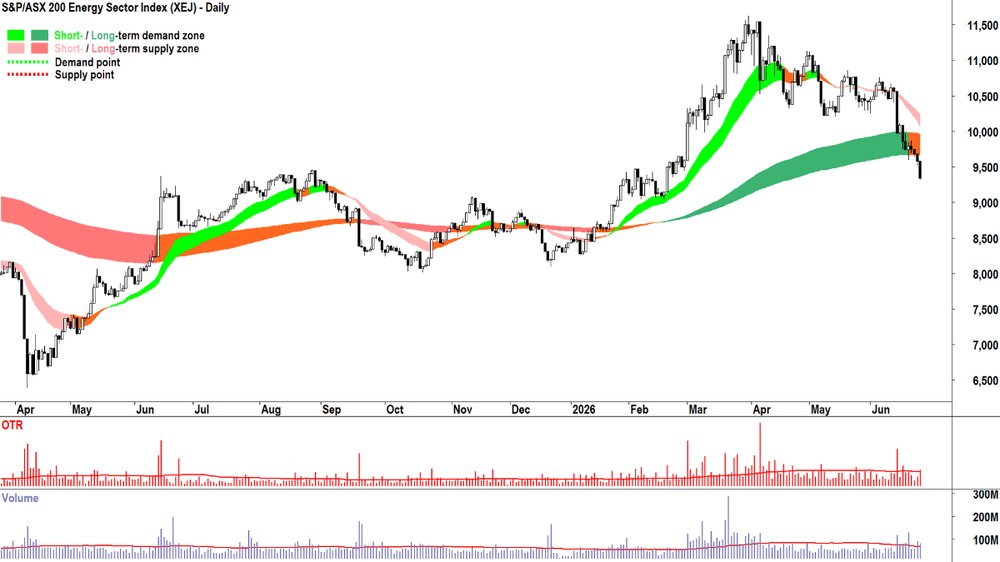
S&P/ASX 200 Energy Sector Index chart
The only odd one out is Consumer Discretionary (XDJ) (+2.1%). If you've been following my commentary in ChartWatch webinars , you'll know that I've been looking for aggressive setups in the sector for several weeks, and indeed, I've flagged many in recent editions of ChartWatch ASX Scans (e.g., ALL, FLT, HVN, NCK, JBH, KGN, SUL and WES (continuation)).
Is the XDJ defensive or is it cyclical? In some ways it shares traits of both ends of the spectrum: greater exposure to Australian domestic economy rather than global economic trends, but undoubtedly, it prefers a stronger economic backdrop than a weaker one.
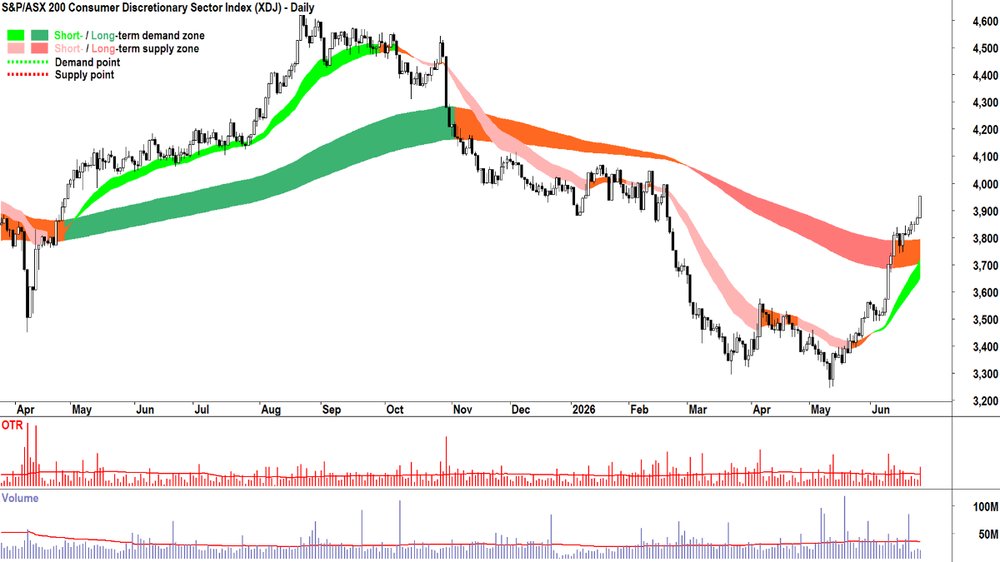
S&P/ASX 200 Consumer Discretionary Sector Index chart
So, why is it rallying with the defensives? We could mention things like: strong local economic data released today (see Economy section below for analysis), growing confidence that the RBA's hiking cycle is done, robust employment supporting domestic consumption, easing cost of living pressures via lower crude price/fuel prices... But those would be narratives = words put in the right order to provide a plausible explanation for why something might be happening.
I hate narratives. Heard enough of them to last me a lifetime! You know that I prefer D vs S = P to any narrative. At the end of the day: IT JUST IS. The XDJ is just going up... Deal with it!
The takeaway is this: We've just come out of 12 months of the most vicious period of sector rotations in at least 26 years (read that article and I'll prove it to you!). If the last few weeks is anything to go by, it's going to keep happening – just with a different set of winners and losers.
The Old Tin Pot at its finest! 🤦
Today's best ASX Top 300 gainers
Company | Last Price | Change $ | Change % | 1mo % | 1yr % |
|---|---|---|---|---|---|
| Echo IQ (EIQ) | $1.615 | +$0.375 | +30.2% | +15.4% | +617.8% |
| LendLease Group (LLC) | $3.17 | +$0.26 | +8.9% | +12.4% | -41.8% |
| Guzman Y Gomez (GYG) | $20.69 | +$1.69 | +8.9% | +4.4% | -28.7% |
| Virgin Australia Holdings (VGN) | $3.04 | +$0.22 | +7.8% | +24.1% | -9.0% |
| Reece (REH) | $16.80 | +$1.14 | +7.3% | +23.1% | -1.9% |
| James Hardie Industries Plc (JHX) | $36.85 | +$1.83 | +5.2% | +29.5% | -4.0% |
| Qualitas (QAL) | $3.08 | +$0.15 | +5.1% | +5.5% | -3.7% |
| Lovisa Holdings (LOV) | $23.09 | +$1.11 | +5.1% | +5.5% | -25.3% |
| ResMed Inc. (RMD) | $29.20 | +$1.27 | +4.5% | -0.6% | -26.1% |
| Spark New Zealand (SPK) | $1.515 | +$0.065 | +4.5% | -7.6% | -30.2% |
| Block, Inc. (XYZ) | $109.88 | +$4.63 | +4.4% | +13.3% | +9.9% |
| Insurance Australia Group (IAG) | $8.21 | +$0.34 | +4.3% | +4.3% | -9.7% |
| Premier Investments (PMV) | $14.79 | +$0.60 | +4.2% | +26.3% | -24.6% |
| Qantas Airways (QAN) | $10.71 | +$0.42 | +4.1% | +23.4% | +3.0% |
| JB Hi-Fi (JBH) | $81.60 | +$3.20 | +4.1% | +12.2% | -25.0% |
| SiteMinder (SDR) | $3.92 | +$0.14 | +3.7% | +41.0% | -12.7% |
| Ramsay Health Care (RHC) | $42.74 | +$1.51 | +3.7% | +12.3% | +20.0% |
| The a2 Milk Company (A2M) | $7.10 | +$0.25 | +3.7% | +25.4% | -9.4% |
| Sonic Healthcare (SHL) | $20.58 | +$0.72 | +3.6% | +10.2% | -21.3% |
| Pro Medicus (PME) | $185.39 | +$6.40 | +3.6% | +44.9% | -33.1% |
Today's worst ASX Top 300 losers
Company | Last Price | Change $ | Change % | 1mo % | 1yr % |
|---|---|---|---|---|---|
| Judo Capital Holdings (JDO) | $0.915 | -$0.62 | -40.4% | -33.7% | -41.0% |
| Predictive Discovery (PDI) | $0.72 | -$0.11 | -13.3% | 0.0% | +92.0% |
| Minerals 260 (MI6) | $0.83 | -$0.115 | -12.2% | -1.8% | +621.7% |
| Worley (WOR) | $11.08 | -$1.19 | -9.7% | -11.2% | -15.4% |
| IperionX (IPX) | $3.83 | -$0.40 | -9.5% | -25.3% | -15.8% |
| Elevra Lithium (ELV) | $10.51 | -$1.01 | -8.8% | -23.5% | +400.5% |
| Pantoro Gold (PNR) | $2.35 | -$0.20 | -7.8% | -24.9% | -20.9% |
| Liontown (LTR) | $1.76 | -$0.14 | -7.4% | -24.1% | +158.8% |
| Greatland Resources (GGP) | $11.94 | -$0.93 | -7.2% | -8.4% | +65.8% |
| Catalyst Metals (CYL) | $5.20 | -$0.40 | -7.1% | -2.1% | -3.5% |
| MA Financial Group (MAF) | $6.00 | -$0.46 | -7.1% | -6.8% | -20.9% |
| Capstone Copper Corp. (CSC) | $13.17 | -$0.98 | -6.9% | -4.2% | +47.2% |
| Core Lithium (CXO) | $0.275 | -$0.02 | -6.8% | -6.8% | +216.1% |
| Mesoblast (MSB) | $2.08 | -$0.15 | -6.7% | -1.9% | +29.2% |
| Kingsgate Consolidated (KCN) | $5.16 | -$0.37 | -6.7% | -13.6% | +130.4% |
| Nickel Industries (NIC) | $0.89 | -$0.06 | -6.3% | -11.9% | +26.2% |
| Develop Global (DVP) | $6.12 | -$0.41 | -6.3% | +9.3% | +34.8% |
| Brazilian Rare Earths (BRE) | $4.51 | -$0.30 | -6.2% | -30.1% | +101.3% |
| Zimplats Holdings (ZIM) | $12.67 | -$0.83 | -6.1% | -22.7% | -17.7% |
| Deep Yellow (DYL) | $1.455 | -$0.09 | -5.8% | -10.2% | -13.1% |
Chartwatch
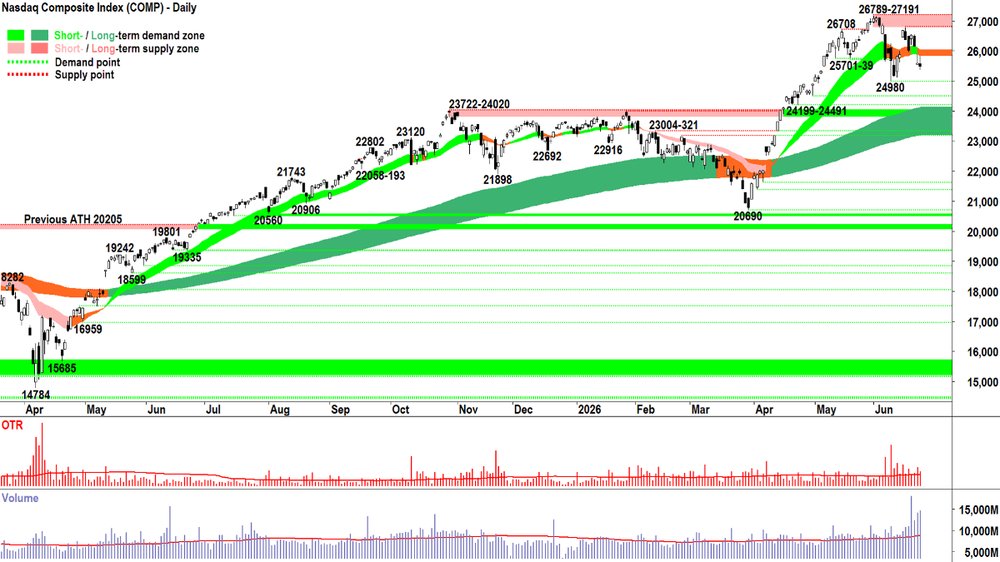
Nasdaq Composite Index
Analysis
Keep in mind that my trend ribbons don't exist in space and time. They have no physical attributes, they can't do anything.
And yet, they did a pretty good job of doing their job last night on the Comp:
When the price is above the trend ribbon (short- or long-term), MOTN it acts as a zone of dynamic excess demand – meaning the price tends to bounce up from the trend ribbon. ⬆️
When the price is below the trend ribbon (short- or long-term), MOTN it acts as a zone of dynamic excess supply – meaning the price tends to bounce down from the trend ribbon. ⬇️
Why this tends to occur MOTN beats me, but to be fair, I don't know how the transmission in my car works, either. 🤷
It just does. Thankfully! 😉
But the biggest problem for the Comp last night was not some imaginary trend ribbon, it was the upward pointing shadow and low session close. We know that:
Upward pointing shadows are the manifestation of excess supply in the system at higher prices – in simple terms: SELL THE RALLY (STR)
A low session close suggests that excess supply was sustained into the end of the trading session – it implies there was likely so much supply that not all of the supply side's wishes could have been filled during the session, and therefore may extend into the next.
Add to the above, another monster volume day – as in, MASSIVE engagement by both the demand and supply sides – and we can infer that something very substantial is going on.
We aren't witnessing a scenario where supply is hitting a demand vacuum... "Oh, that's why prices are going down... Buyers are on strike and the bit of motivated supply around is having an outsized impact on the price..."
Nope. There's a truckload of demand around! Why? Well there's a truckload of cash around. It's been trying to get into the Comp for ages, but for much of the +6,000 point rally since April, it's been forced to bid up price to entice supply out.
There's no need to entice now. Supply is everywhere. So the demand side is getting its fill, and a little more.
Demand is getting set here, i.e., cash is being converted to stock – and it doesn't seem to care too much that supply is up to the task. Either that's a good sign – because there's so much demand around it just doesn't care that there's plenty of supply around to meet it.
Or, in my experience, it means we're at a major market top. ⚠️🚨
Massive amounts of demand (cash) is entering and immediately being put into losing positions. In my experience, this creates latent demand at higher prices (points of supply). This can be an overhang on higher prices for weeks or months.
And if demand is forced to withdraw due to deteriorating fundamentals, the wall of prevailing supply will no longer have a ready pool of buyers to accommodate them. They will be forced to accept lower, and lower prices to entice demand out.
There's two assumptions here, though:
There's a finite amount of demand – the rate at which the available pool of cash is being converted to stock is occurring rapidly now... If the pool of cash is finite, the remaining pool of demand is shrinking and the pool of loss making supply is increasing (remember, stock is latent supply!) .
The assumption that loss making supply will be motivated to transform itself back into cash assumes deteriorating fundamentals. That bit is always up for debate. Some would say we're already there (i.e., the existing supply!), while others might never arrive at that view (i.e., the current demand side resilience may prevail!).
But this is all moot. And I've wasted too much of my time typing this, and if you're a sucker for punishment – you've wasted too much time reading it! 🥱
The market is going to do what the market is going to do... And there's absolutely nothing we can do about it. It's not worth bending our tiny little brains as to what it's going to do next: NEXT = FUTILE! 🚫🔮
Our responsibility is to form an opinion of what's likely to happen MOTN from our Analysis. For me, I look at the above chart of the Comp and simply say:
Nope, definitely not total demand side control = P⬆️ MOTN
Uh-uh, definitely not total supply side control = P⬇️ MOTN
Hmmm, yep, that's about right: D ~= S = P ➡️ MOTN
Okay, if that's the case, then I Accept banging my head against a brick wall trying to predict the unpredictable is FUTILE. I better just pull my head in and run at a BALANCED risk position.
View
And that's the Act part! Sorry for taking so long to get here today... But sometimes ChartWatch is just me clearing my head and figuring out what I need to do next! Which is remain at 1/2RP. ⚖️
Key Levels
26789-27191 is the key zone of supply. 24980 is the key point of demand. The short term uptrend ribbon (presently 25875-26102) could now begin to act as a zone of dynamic excess supply.
S&P/ASX 200 (XJO)
%20chart_25%20Jun.png)
Analysis
I will keep this very brief! 🏃💨
1/2RP. 🤦
View
My personal allowable capital allocation limit for my investments in Australian stocks is 50%.
Key levels
8984-9022 is the key zone of supply. Beyond that, it's 9201. Demand is in the 8485-8561 range, but the short- and long-term trend ribbons (presently 8696-8776) will likely also increasingly come into play as a dynamic zone of excess demand.
(Glossary of acronyms! OTP (Old Tin Pot): S&P/ASX 200 | MOTN: More Often Than Not | FOMO: Fear Of Missing Out | HOFU: Holding On For Upside | BTD: Buy The Dip | NUTE: No Urgency To Enter | FOHO: Fear Of Holding On | STR: Sell The Rally | RP: Risk Position)
***NEW VIDEO DROPPED!!! 📺***
BHP & RIO vs CSL battle royale! Is the ASX Resources run over!? Copper, Iron Ore, Lithium and more
ChartWatch LIVE Webinar
ChartWatch LIVE Webinars – WEEKLY Wednesday's @ 12pm AEDT
Learn more about technical analysis and trend following through real case studies on ASX stocks. Australia's premier technical analyst, Carl Capolingua, shares his unique insights on stocks as requested by viewers. Ask about a company in your portfolio or anything related to trading and investing and get Carl's expert opinion.
Places are limited so >REGISTER NOW!<
Economy
Today
AUS May Employment Data
Change: +40,300 m/m vs +30,300 m/m forecast and -18,600 m/m in April
Reader: Stronger than expected, but part-time employment (+35,200) did all the heavy lifting as full-time employment rose by a modest 5,200.
Unemployment rate: 4.4% as forecast and vs 4.5% in April (Down a notch! Might have helped that XDJ along today! 😉)
AUS May Household Spending
Result: +1.3% m/m vs +0.6% m/m forecast and -1.1% m/m in April
Reader: A snap back was expected after April's Middle East conflict/fuel price spike inspired fall – but that was quite a snap back! Aussies are spending up big, and it was discretionary spend that shot the lights out: Clothing and footwear +2.7%, Miscellaneous goods and services +2.2%, Hotels, cafes and restaurants (+1.9%). No cost of living crisis here! 🤑
Later this week
Thursday
20:30 USA May Personal Consumption Expenditures (PCE) Data
Core PCE Index: +0.3% m/m forecast vs +0.2% m/m in April
Personal Income: +0.4% m/m forecast vs +0.0% m/m in April
Personal Spending: +0.6% m/m forecast vs +0.5% m/m in April
Friday
07:30 JPN May Core CPI (+1.6% p.a. forecast vs +1.3% p.a. in May)
20:30 USA May Wholesale Inventories (+0.3% m/m forecast vs +0.6% m/m in April)
Interesting Movers
Trading higher
- Echo IQ (EIQ) $1.62+30.2%
Secured an agreement with Pro Medicus to establish a strategic investment of up to $20 million and a US commercial partnership.
- LendLease Group (LLC) $3.17+8.9%
Agreed to sell its remaining 25.1% interest in the Keyton Retirement Living Trust to Aware Super for $525 million to reduce group debt; subject to regulatory approvals.
- Tourism Holdings Rentals (THL) $2.25+7.7%
Received a fresh offer from a mystery party valuing the company between NZ$3.30 and NZ$3.40 a share; has agreed to provide the bidder due diligence access; previous bidder BGH consortium remains in the mix.
- Renascor Resources (RNU) $0.05+5.9%
Identified multiple copper prospects from historical drilling at Flat Hill, with significant copper-bearing intersections across a 3km zone (eg. 18m @ 1.57% Cu from surface).
- Alligator Energy (AGE) $0.05+4.1%
CFO Joe Sutanto resigned; R. Blayney Morgan appointed interim Chief Financial Officer.
- The a2 Milk Company (A2M) $7.10+3.7%
Declared a special $300 million dividend after securing a key Chinese regulatory approval for its Pokeno infant formula facility; investors to receive 41.36¢ per share.
- Pro Medicus (PME) $185.39+3.6%
Gained 3.2%; will invest an initial $10 million (option for a further $10m on FDA clearance of EchoSolv HF) and become a proposed US reseller of Echo IQ’s product suite.
- Paladin Energy (PDN) $9.74+0.4%
Announced a new high-grade uranium discovery named Atlas at Patterson Lake South after 2026 winter drilling; multiple drill holes intersected mineralisation, up to 4.25% U3O8.
Trading Lower
- Judo Capital Holdings (JDO) $0.92-40.4%
FY26 profit before tax now expected between $163m–$169m (down from prior guidance $180m–$190m); warned FY26 cost of risk to increase to $116m–$122m and impaired loans expected ~3% of gross loans.
- Worley (WOR) $11.08-9.7%
Issued a second profit warning in two months — now expects a $60 million hit to full-year underlying EBITDA from the Middle East conflict, plus further hit to underlying EBITA from a stronger AUD.
- Ventia Services Group (VNT) $6.50-2.8%
Appointed Mark Ralston as chief executive from September 1 following an internal and external search; transition with outgoing CEO planned.
- Mineral Resources (MIN) $64.14-2.6%
To place Lucky Bay garnet project in WA into care and maintenance from July 1 (about 110 jobs affected); expects ~ $40 million non-cash impairment in FY26 and is reviewing divestment options.
Broker Moves
Company | Broker | Action | Rating | Price Target |
|---|---|---|---|---|
29M29Metals | Macquarie | Retained | Neutral | $0.30(from $0.26) |
AELAmplitude Energy | Macquarie | Retained | Outperform | $2.55 |
AFGAustralian Finance Group | Jarden | Initiated | Overweight | $2.30 |
AISAeris Resources | Macquarie | Retained | Outperform | $0.60 |
AMIAurelia Metals | Macquarie | Retained | Outperform | $0.44(from $0.43) |
APZAspen Group | Citi | Retained | Buy | $5.40 |
ATRAstron Corporation | Morgans | Retained | Speculative Buy | $0.90 |
AX1Accent Group | UBS | Retained | Neutral | $0.60 |
BBNBaby Bunting Group | Citi | Retained | Buy | $2.70(from $3.30) |
| Morgan Stanley | Retained | Overweight | $3.60 | |
| Morgans | Retained | Accumulate | $1.70(from $1.90) | |
| Ord Minnett | Upgraded | Buy(from Accumulate) | $2.30(from $2.80) | |
BHPBHP Group | Macquarie | Retained | Neutral | $57.00(from $56.00) |
BPTBeach Energy | Macquarie | Retained | Underperform | $0.75(from $0.85) |
BTRBrightstar Resources | Shaw and Partners | Initiated | Buy | $1.15 |
BWPBWP Trust | Citi | Retained | Buy | $4.00 |
CCVCash Converters International | Bell Potter | Initiated | Buy | $0.34 |
CHCCharter Hall Group | Citi | Retained | Buy | $26.50 |
CKFCollins Foods | UBS | Retained | Buy | $13.50 |
CNBCarnaby Resources | Macquarie | Retained | Outperform | $0.85(from $0.80) |
CSCCapstone Copper Corp. | Macquarie | Retained | Outperform | $18.30(from $18.00) |
CYMCyprium Metals | Canaccord Genuity | Retained | Speculative Buy | $0.85 |
DMPDomino's Pizza Enterprises | UBS | Retained | Buy | $22.00 |
FFMFireFly Metals | Macquarie | Retained | Outperform | $2.70(from $2.50) |
FMGFortescue | Macquarie | Retained | Outperform | $22.00 |
GMGGoodman Group | Citi | Retained | Buy | $40.00 |
GPTGPT Group | Citi | Retained | Buy | $6.00 |
GYGGuzman Y Gomez | UBS | Retained | Buy | $24.00 |
IAGInsurance Australia Group | Goldman Sachs | Upgraded | Buy(from Neutral) | $8.60(from $8.00) |
ILUIluka Resources | UBS | Retained | Neutral | $5.25 |
INRioneer | Bell Potter | Retained | Speculative Buy | $0.40(from $0.39) |
JBHJB Hi-Fi | UBS | Retained | Buy | $85.00 |
JINJumbo Interactive | Morgan Stanley | Downgraded | Equal Weight(from Overweight) | $8.40(from $14.50) |
KARKaroon Energy | Macquarie | Retained | Neutral | $1.45(from $1.50) |
KYPKinatico | Bell Potter | Retained | Buy | $0.36 |
LLCLendLease Group | Citi | Retained | Buy | $4.50 |
LOVLovisa Holdings | UBS | Retained | Buy | $26.00 |
LYCLynas Rare Earths | UBS | Retained | Buy | $23.65 |
MGRMirvac Group | Citi | Retained | Neutral | $1.84 |
MINMineral Resources | Macquarie | Retained | Outperform | $87.00(from $90.00) |
NXTNEXTDC | Citi | Retained | Buy | $19.10 |
PMVPremier Investments | UBS | Retained | Buy | $17.50 |
RIORio Tinto | Macquarie | Retained | Neutral | $188.00 |
S32South32 | Macquarie | Retained | Neutral | $4.00(from $4.60) |
SCGScentre Group | Citi | Retained | Buy | $4.40 |
SGPStockland | Citi | Retained | Neutral | $4.30 |
SIGSigma Healthcare | UBS | Retained | Buy | $3.40 |
STOSantos | Macquarie | Retained | Outperform | $8.90(from $9.15) |
STXStrike Energy | Macquarie | Retained | Neutral | $0.10(from $0.11) |
SULSuper Retail Group | UBS | Retained | Neutral | $13.25 |
SUNSuncorp Group | Goldman Sachs | Downgraded | Neutral(from Buy) | $20.00 |
TEATasmea | Morgans | Downgraded | Accumulate(from Buy) | $9.80(from $9.15) |
| Ord Minnett | Downgraded | Hold(from Accumulate) | $9.70(from $8.65) | |
TLSTelstra Group | UBS | Retained | Neutral | $5.30 |
TPGTPG Telecom | UBS | Retained | Neutral | $3.97 |
UNIUniversal Store Holdings | UBS | Retained | Buy | $9.00 |
VCXVicinity Centres | Citi | Retained | Neutral | $2.70 |
VEAViva Energy Group | UBS | Retained | Buy | $2.70(from $2.65) |
WDSWoodside Energy Group | Macquarie | Retained | Neutral | $30.00(from $33.00) |
WRKwrkr | Bell Potter | Retained | Speculative Buy | $0.15(from $0.18) |
Scans
Top Gainers
Code | Company | Last | % Chg |
|---|---|---|---|
| ODA | Orcoda Ltd | $0.115 | +167.44% |
| NX1 | Nexalis Therapeutics Ltd | $0.018 | +38.46% |
| T3D | 333D Ltd | $0.046 | +31.43% |
| EIQ | Echoiq Ltd | $1.615 | +30.24% |
| DXN | DXN Ltd | $0.23 | +27.78% |
Top Fallers
Code | Company | Last | % Chg |
|---|---|---|---|
| JDO | Judo Capital Holdings Ltd | $0.915 | -40.39% |
| MFD | Mayfield Childcare Ltd | $0.16 | -33.33% |
| UM1 | Unity Metals Ltd | $0.10 | -31.03% |
| CCR | Credit Clear Ltd | $0.15 | -25.00% |
| NMT | Neometals Ltd | $0.021 | -25.00% |
52 Week Highs
Code | Company | Last | % Chg |
|---|---|---|---|
| ODA | Orcoda Ltd | $0.115 | +167.44% |
| EIQ | Echoiq Ltd | $1.615 | +30.24% |
| IOV | Ion Video Ltd | $0.62 | +9.74% |
| DSM | Desert Minerals Ltd | $0.75 | +4.17% |
| KRR | King River Resources Ltd | $0.05 | +4.17% |
52 Week Lows
Code | Company | Last | % Chg |
|---|---|---|---|
| JDO | Judo Capital Holdings Ltd | $0.915 | -40.39% |
| MFD | Mayfield Childcare Ltd | $0.16 | -33.33% |
| CCR | Credit Clear Ltd | $0.15 | -25.00% |
| NMT | Neometals Ltd | $0.021 | -25.00% |
| IBX | Imagion Biosystems Ltd | $0.012 | -20.00% |
Near Highs
Code | Company | Last | % Chg |
|---|---|---|---|
| WVOL | iShares MSCI World Ex Aust Minimum Volatility ETF | $45.48 | -0.31% |
| EGH | Eureka Group Holdings Ltd | $0.675 | -1.46% |
| IAGPF | Insurance Australia Group Ltd | $105.50 | +0.51% |
| VVLU | Vanguard Global Value Equity Active ETF | $82.72 | +0.15% |
| IHD | iShares S&P/ASX DIV Opportunities Esg Screened ETF | $17.18 | -0.58% |
Relative Strength Index (RSI) Oversold
Code | Company | Last | % Chg |
|---|---|---|---|
| WDS | Woodside Energy Group Ltd | $27.43 | -2.87% |
| KAR | Karoon Energy Ltd | $1.295 | -5.47% |
| NVX | Novonix Ltd | $0.155 | -3.13% |
| REA | REA Group Ltd | $133.88 | +1.75% |
| ZIM | Zimplats Holdings Ltd | $12.67 | -6.15% |
