
The ASX 200 crept higher on strong gains in energy and selective M&A-driven buying in financials. Tech stocks bore the brunt of Friday’s Wall Street sell-off, while coal, oil and gas names largely shook off a pullback in the crude oil price in Asian trade.
Be sure to click/scroll through for the usual reporting of the major sector and stock-specific moves, the broker responses to them, as well as all the key economic data in tonight's Evening Wrap. Also, I have detailed technical analysis on the Nasdaq Composite and the S&P/ASX 200 in today's ChartWatch.
Let’s dive in!
Today in Review
Name | Value | % Chg |
|---|---|---|
Major Indices | ||
| ASX 200 | 8,845.7 | +0.44% |
| All Ords | 8,975.7 | +0.40% |
| Small Ords | 3,177.9 | -0.35% |
| All Tech | 2,824.5 | -0.75% |
| Emerging Companies | 2,791.8 | -0.74% |
Currency | ||
| AUD/USD | 0.6973 | +0.39% |
US Futures | ||
| S&P 500 | 7,762.75 | +0.76% |
| Dow Jones | 52,450.0 | +0.45% |
| Nasdaq | 29,796.25 | +1.38% |
Name | Value | % Chg |
|---|---|---|
Sector | ||
| Energy | 11,314.0 | +2.21% |
| Financials | 9,426.1 | +0.86% |
| Industrials | 8,048.5 | +0.83% |
| Utilities | 10,644.5 | +0.38% |
| Communication Services | 1,540.0 | +0.21% |
| Health Care | 33,973.7 | +0.14% |
| Materials | 23,150.3 | +0.11% |
| Consumer Staples | 13,636.5 | -0.08% |
| Real Estate | 3,229.6 | -0.20% |
| Consumer Discretionary | 3,701.2 | -0.20% |
| Information Technology | 1,664.5 | -1.31% |
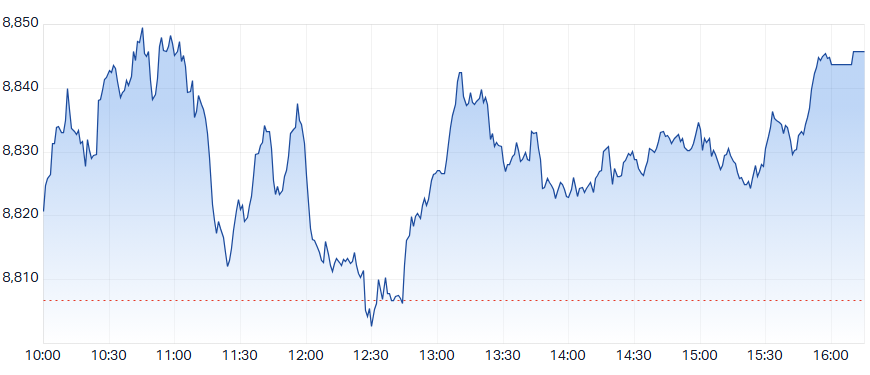
ASX 200 Intraday Chart
Markets
The S&P/ASX 200 (XJO) finished 39.0 points higher at 8,845.7, 0.51% from its session low and just 0.05% from its high. Despite the strong performance in the benchmark, in the broader-based S&P/ASX 300 (XKO) advancers lagged decliners by 128 to 156.
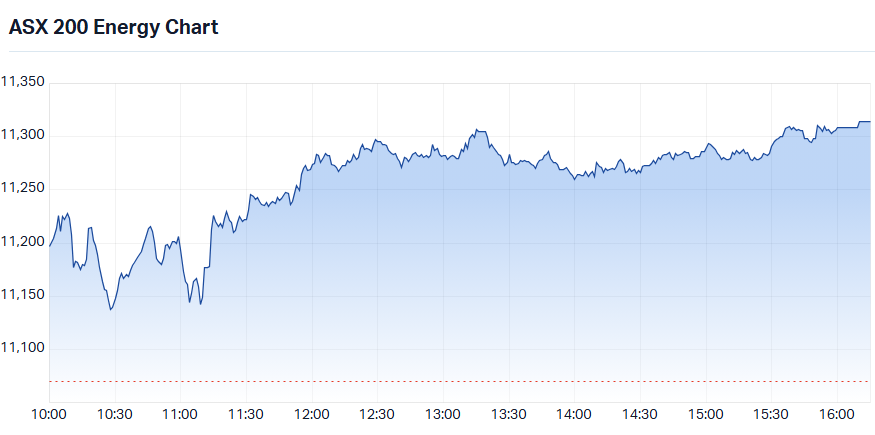
Energy (XEJ) (+2.0%) — coal stocks led the sector after New Hope Corp. (NHC) (+5.8%) announced a takeover of unlisted Malabar Coal, giving the whole sub-sector a sharp positive lead. GlobalCoal Newcastle coal futures rose +1.2% to US$156.50/t in the Asian session, and SGX Australian Premium Coking Coal added +0.4% to US$267/t. Yancoal Australia (YAL) (+5.7%) and Whitehaven Coal (WHC) (+5.2%) followed closely behind NHC.
S&P-ASX 200 Energy Sector Index intraday chart
In other Energy sector moves, ICE benchmark Brent crude oil futures pulled back -2.0% to US$107.58/bbl in Asian trade, after surging 3.7% overnight — but the dip did little to deter capital flowing into oil and gas stocks. Beach Energy (BPT) (+4.0%) and Karoon Energy (KAR) (+3.9%) were the standout movers, with Woodside Energy (WDS) (+2.7%) and Santos (STO) (+2.3%) also adding ground.
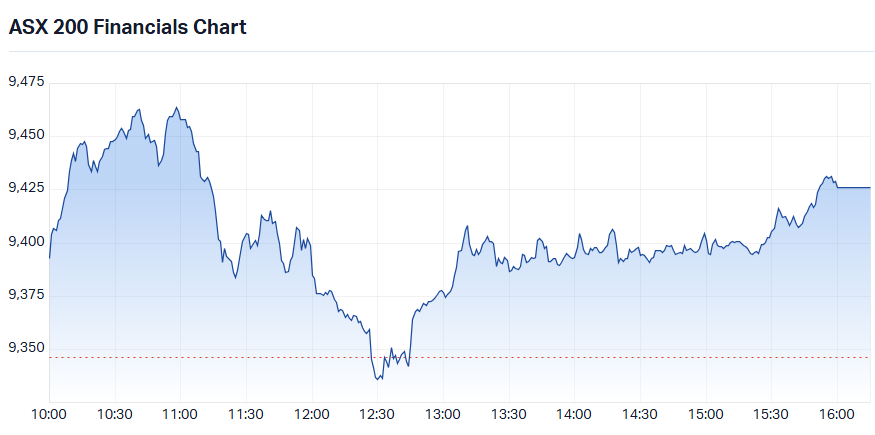
Financials (XFJ) (+0.6%) got an M&A boost, with Challenger (CGF) (+19.3%) and Fleetpartners (FPR) (+7.1%) surging as takeover activity sparked buying in the sector. Elsewhere, defensive flows supported the major banks, with AMP (AMP) (+3.8%), National Australia Bank (NAB) (+1.5%), and ANZ (ANZ) (+1.0%) all advancing — likely reflecting a preference for reliable, income-generating names on a cautious day.
S&P-ASX 200 Financials Sector Index intraday chart
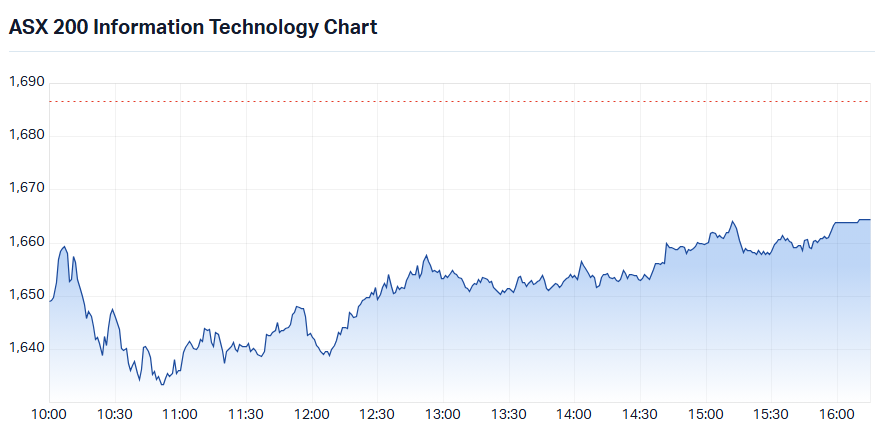
At the other end of the sector performance table, Information Technology (XIJ) (-1.6%) followed the lead of US tech stocks lower after fresh concerns about global AI spending weighed on the sector overnight. The damage could have been worse: Wisetech Global (WTC) (+1.4%) bucked the trend and provided a partial offset, given its heavy index weight. Still, Megaport (MP1) (-3.5%), Life360 (360) (-3.1%), and Catapult Sports (CAT) (-3.1%) were among the hardest hit, followed by Xero (XRO) (-2.4%) and Technology One (TNE) (-1.9%).
S&P-ASX 200 Information Technology Sector Index intraday chart
The Gold Sub-Index (XGD) (-0.7%) was the next-worst performer, slipping despite COMEX benchmark gold futures rising +0.5% to US$4,204/oz in the Asian session. Emerald Resources (EMR) (-2.7%) and Pantoro Gold (PNR) (-2.7%) were the notable fallers.
The large-cap miners held their ground within a flat Materials (XMJ) (+0.0%) sector, as SGX benchmark iron ore futures rose +0.9% to US$91.85/t in the Asian session. Defensive positioning among fund managers also likely helped direct flows toward the sector’s heavyweights. BHP (BHP) (+0.7%), Fortescue (FMG) (+0.5%), and Rio Tinto (RIO) (+0.4%) all finished in positive territory.
Base metals stocks were a drag, however, despite modestly firmer prices on the London Metals Exchange on Friday — aluminium +0.5%, copper +0.4%, and nickel +1.9%. Further highlighting the disconnect between commodity prices and share prices, COMEX benchmark copper futures added +0.7% to US$6.62/lb in the Asian session. Metals X (MLX) (-3.8%) was the biggest loser, followed by South32 (S32) (-2.6%), IGO (IGO) (-2.4%), and Nickel Industries (NIC) (-1.4%).
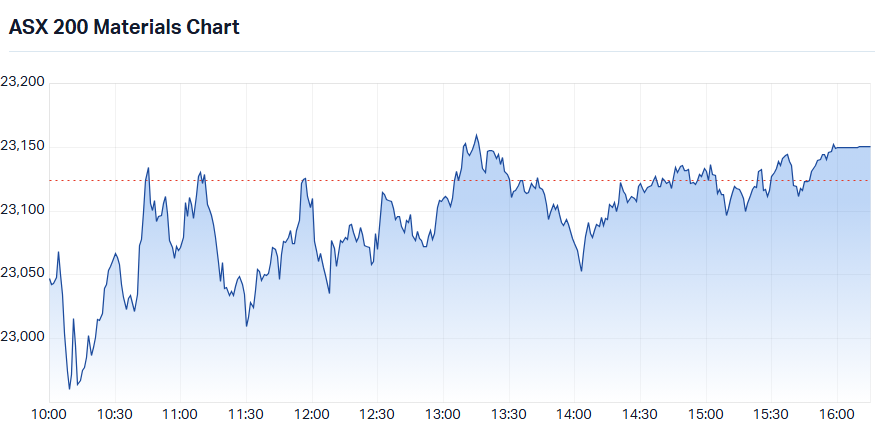
S&P-ASX 200 Materials Sector Index intraday chart
In other commodities moves, lithium stocks continued to struggle despite a sharp +4.7% rebound in GFEX lithium carbonate futures in China to 100,860 CNY/t — a gain that, while welcome, barely registers against a 45% two-month decline in the benchmark contract. Elevra Lithium (ELV) (-5.5%) was the heaviest faller, with Liontown (LTR) (-3.5%), PLS Group (PLS) (-2.7%), Core Lithium (CXO) (-2.4%), and Wildcat Resources (WC8) (-2.2%) all lower.
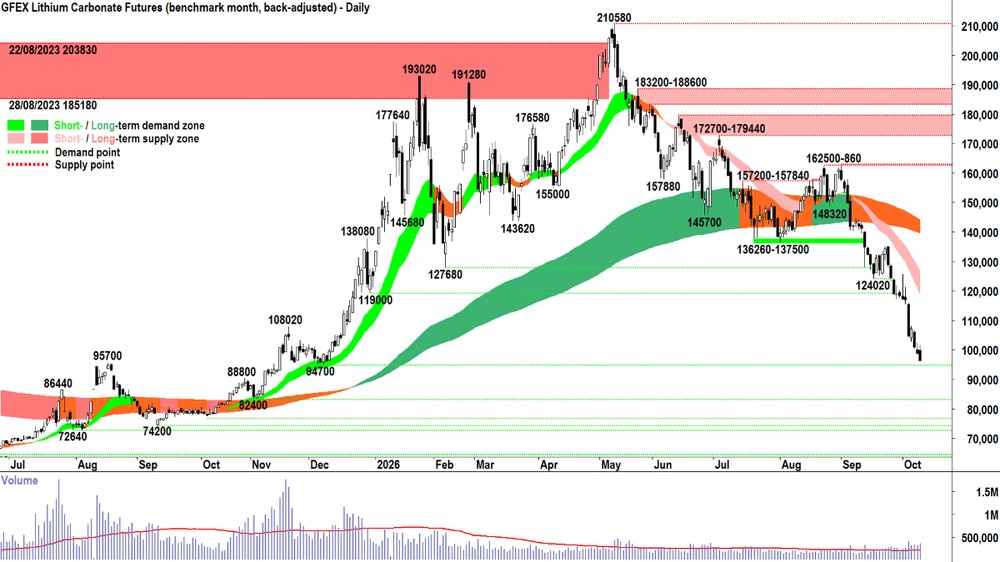
Benchmark GFEX lithium carbonate futures. Note, Friday's close as today's session remains open at the time of writing!
Today's best ASX Top 300 gainers
Company | Last Price | Change $ | Change % | 1mo % | 1yr % |
|---|---|---|---|---|---|
| Cleanaway Waste Management (CWY) | $2.97 | +$0.50 | +20.2% | +11.7% | +7.6% |
| Benz Mining Corp (BNZ) | $4.85 | +$0.79 | +19.5% | +3.2% | +187.8% |
| Challenger (CGF) | $11.75 | +$1.90 | +19.3% | +15.2% | +32.5% |
| FleetPartners Group (FPR) | $5.11 | +$0.34 | +7.1% | +9.2% | +70.3% |
| Ingenia Communities Group (INA) | $4.24 | +$0.28 | +7.1% | -1.9% | -24.1% |
| New Hope Corporation (NHC) | $6.18 | +$0.34 | +5.8% | -3.1% | +55.3% |
| Yancoal Australia (YAL) | $6.29 | +$0.34 | +5.7% | +8.1% | +13.3% |
| Tuas (TUA) | $1.725 | +$0.085 | +5.2% | -23.7% | -73.5% |
| Whitehaven Coal (WHC) | $7.93 | +$0.39 | +5.2% | 0.0% | +14.8% |
| Charter Hall Group (CHC) | $19.35 | +$0.84 | +4.5% | +5.6% | -14.3% |
| Beach Energy (BPT) | $0.905 | +$0.035 | +4.0% | +4.0% | -17.0% |
| Karoon Energy (KAR) | $1.745 | +$0.065 | +3.9% | -3.9% | +22.9% |
| Nanosonics (NAN) | $2.97 | +$0.11 | +3.8% | +1.7% | -36.0% |
| AMP (AMP) | $2.47 | +$0.09 | +3.8% | -2.0% | +38.0% |
| St Barbara (SBM) | $0.825 | +$0.03 | +3.8% | -11.3% | +33.1% |
| Flight Centre Travel Group (FLT) | $10.84 | +$0.38 | +3.6% | +3.3% | -10.8% |
| Stanmore Resources (SMR) | $2.80 | +$0.09 | +3.3% | +4.5% | +22.3% |
| Air New Zealand (AIZ) | $0.32 | +$0.01 | +3.2% | +1.6% | -39.6% |
| Storage King Group (SKG) | $1.075 | +$0.03 | +2.9% | +1.9% | -24.6% |
| Woodside Energy Group (WDS) | $34.03 | +$0.89 | +2.7% | +5.0% | +54.0% |
Today's worst ASX Top 300 losers
Company | Last Price | Change $ | Change % | 1mo % | 1yr % |
|---|---|---|---|---|---|
| Mesoblast (MSB) | $1.77 | -$0.22 | -11.1% | -16.1% | -32.4% |
| Tasmea (TEA) | $9.31 | -$0.69 | -6.9% | -11.7% | +102.4% |
| 4DMedical (4DX) | $3.87 | -$0.22 | -5.4% | -10.2% | +120.5% |
| Infratil (IFT) | $9.87 | -$0.55 | -5.3% | -12.7% | -10.3% |
| PYC Therapeutics (PYC) | $1.81 | -$0.10 | -5.2% | -32.2% | +54.4% |
| Digico Infrastructure REIT (DGT) | $2.04 | -$0.11 | -5.1% | -20.0% | -29.2% |
| Turaco Gold (TCG) | $0.77 | -$0.035 | -4.3% | -12.0% | +48.1% |
| Minerals 260 (MI6) | $0.775 | -$0.035 | -4.3% | -17.6% | +115.3% |
| The Star Entertainment Group (SGR) | $0.115 | -$0.005 | -4.2% | -25.8% | +22.3% |
| Stockland (SGP) | $4.06 | -$0.17 | -4.0% | -0.5% | -37.7% |
| Bendigo and Adelaide Bank (BEN) | $10.13 | -$0.42 | -4.0% | -2.2% | -18.8% |
| Metals X (MLX) | $1.635 | -$0.065 | -3.8% | -24.0% | +90.1% |
| Southern Cross Electrical Engineering (SXE) | $4.30 | -$0.17 | -3.8% | -4.9% | +88.6% |
| GenusPlus Group (GNP) | $8.58 | -$0.32 | -3.6% | -9.3% | +47.9% |
| EQ Resources (EQR) | $0.27 | -$0.01 | -3.6% | -44.3% | +474.5% |
| Liontown (LTR) | $0.685 | -$0.025 | -3.5% | -32.8% | -37.4% |
| Megaport (MP1) | $15.93 | -$0.57 | -3.5% | -14.1% | +13.7% |
| Tabcorp Holdings (TAH) | $0.86 | -$0.03 | -3.4% | -5.0% | -18.5% |
| Metrics Master Income Trust (MXT) | $1.67 | -$0.055 | -3.2% | -5.6% | -13.9% |
| Life360 Inc (360) | $19.74 | -$0.64 | -3.1% | +3.8% | -56.7% |
Chartwatch
Nasdaq Composite Index
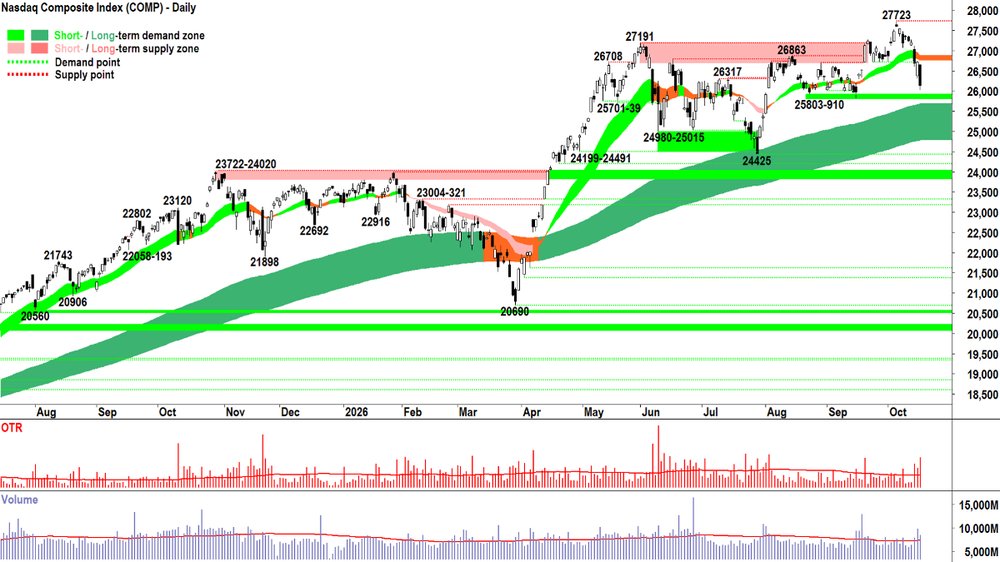
Nasdaq Composite Index chart
Analysis
21 September. That gap-run-long white-close-near-the-high candle. 🤔
That was my last update prior to my holiday (which was fantastic BTW!).
A new high followed. I don’t need to tell you of course, I’m just typing as I’m looking at the chart for the first time since 21 September!
Then a dip (kinda plunge) back into the old trading range. A couple of very credible supply side showings in that dip (the first is Wed’s candle… then Fri’s).
Disappointing.
But not surprising given the uncertainty in global financial markets at the moment, and that has persisted since You Know Who did You Know What back in Feb.
Net-net, not a great deal has changed in my time away.
Calling a spade a spade here… Friday’s candle is disturbing. I expect you haven’t forgotten how to read candles since our last chat, and therefore you respect it as a convincing display of supply side control — particularly given Thursday’s opposite day reply to Wed’s decline.
Can I say here: Bloody hell! Stuff is just as crazy as before I departed! 🤦
Thurs & Friday are each massive opposite days. I hate massive opposite days. They’re a trend follower’s worst nightmare. Opposite days smack of zebra-like trading… massive opposite days smack of zebra-on-speed-like trading. 🦓
And there’s little more dangerous than a zebra on speed for trend followers like me! 😜
Let’s do a full technical work-up here just to be thorough:
ST Trend: Amber ribbon, declining, price is below the ribbon and Friday’s candle suggests it may be acting as a zone of dynamic supply = ⚠️
LT Trend: Green ribbon, rising, price is above the ribbon and the ribbon appears to be acting as a zone of dynamic demand = ✅
Price action: rising peaks and falling troughs (the rising peaks are clear, 6-Oct 27723 vs 30-Sep 27108, but the falling troughs are less so… consider that the last observed trough is 1-Oct 26733… it won’t matter where the next trough forms, it must be lower than 26733) = ⚖️
Candles: Zebra on speed = ⚠️
Volatility: Downside volatility increasing / above average last few sessions. Not a ⚠️ yet, but isn’t ideal… let's go with ⚖️
Volume: Was below average for much of the rally to 27723 which is preferred, but above average on some of the supply-side days since — indicating some readily available supply in the system and some demand removal. Not a ⚠️ yet, but isn’t ideal… let's go with ⚖️
So that gives: ⚠️✅⚖️⚠️⚖️⚖️
Last time we chatted here I was at 2/3RP. It’s too close to ⚖️ to warrant staying there. I think 1/2RP is appropriate for now, and especially considering the tentative nature RUT chart below. 👇
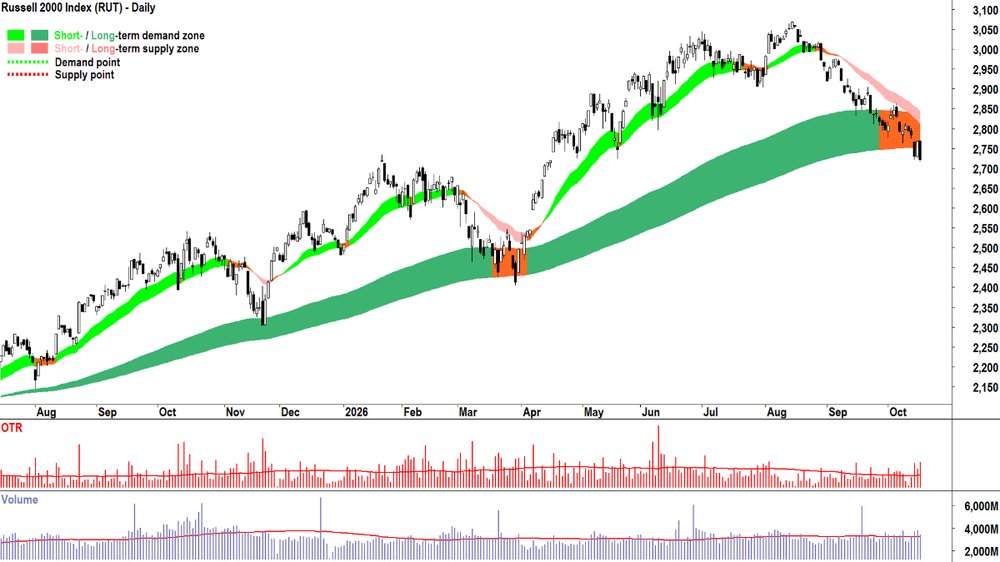
Russell 2000 chart
I’ll leave it to you to confirm the technical work-up for the RUT is: ⚠️⚠️⚠️⚠️
Something is rotten in the state of Denmark!
View
I am at 1/2RP on US stocks (RP = Risk Position – it reflects my personal allowable capital allocation limit for my investments in US stocks. So 1/2RP is 50%, 2/3RP is 67% and FRP is 100%).
Key Levels
27723 is the closest key point of supply, but the short term trend ribbon will also likely act as a dynamic zone of supply (presently 26772-26888). 25803-910 as the closest key zone of demand.
S&P/ASX 200 (XJO)
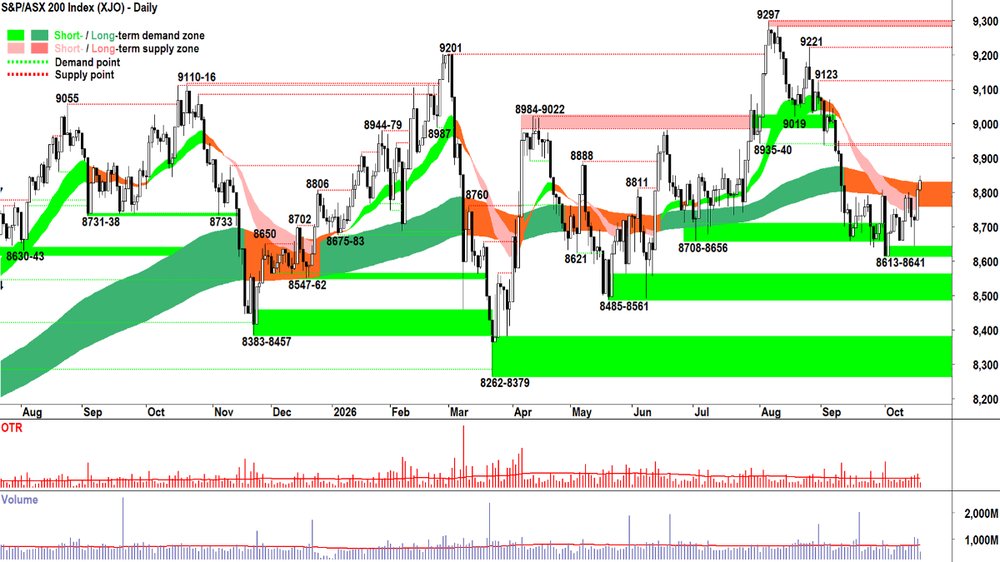
S&P/ASX 200 (XJO) chart
Analysis
I'm so relieved I didn't have to write about the OTP over the last month! A great deal of mucking around for very little gain.
But also, for no loss... Which, to be fair, was the major risk when I departed. So kudos to you OTP for not going down. 👍
Particularly after the 1-Oct massive black candle. What a major supply side wipe out... no dout I would have said "gone for all money" there...
But low and behold, it looks like some strategic juicing of the Financials sector stopped the rot. Who would have thunk it possible!? 🤦
Regardless of the Plunge Protection Team's shenanigans, the big question now is: Can the OTP go up? 🤔
You know I don't deal in predictions. Of course it can go up. It can do anything... the future is unknown! 🔮
I deal in probabilities. Therefore, the real question is: Is there a higher probability (i.e. MOTN) that the OTP will go up compared to it going down or sideways?
The first scenario is consistent with Act = Add risk, while the other two are consistent with Act = Do nothing.
Because I'm already at my lowest risk / most risk-averse portfolio allocation level of 1/3RP. To answer the question we must look at the chart above and determine if there are sufficient signals of demand side control to warrant putting some of my 67% cash hoard at risk in ASX stocks?
To the checklist we go! 📋
ST Trend: Amber ribbon, rising, price is above the ribbon — but it's unclear yet whether it's acting as a zone of dynamic demand = ⚖️
LT Trend: Amber ribbon, flat, price is above the ribbon — but it's unclear yet whether it's acting as a zone of dynamic demand = ⚖️
Price action: rising peaks and rising troughs (super overlappy though suggests far from a convincing consensus among demand and supply sides that ASX shares are good value) = ✅
Candles: Zebra... perhaps not on the same quality of speed as for the Comp!!! Can I say "improving towards demand side control"? = ⚖️
Volatility: Seems to have settled since the 1-Oct mayhem = ⚖️
Volume: Decent on Thurs-Fri demand side pushes... let's go a modest = ✅
So that gives: ⚖️⚖️✅⚖️⚖️✅
View
All things considered, my Act for today is to remain 1/3RP on Australian shares (i.e., 67% cash vs 33% invested, with some of the invested portion allocated to shorts).
There are some signs of improvement here, but not enough just yet to warrant a higher risk allocation. I think my Portfolio Management Model performed pretty darn will in my absence... I hope you agree!
Key Levels
8935-8940 is the closest zone of supply vs 8613-8641 is the critical zone of demand.
(Glossary of acronyms! Old Tin Pot (OTP): S&P/ASX 200 | MOTN: More Often Than Not | FOMO: Fear Of Missing Out | HOFU: Holding On For Upside | BTD: Buy The Dip | NUTE: No Urgency To Enter | FOHO: Fear Of Holding On | STR: Sell The Rally | RP: Risk Position | FFS: Fund Flow Shenanigans!)
ChartWatch LIVE Webinars – WEEKLY Wednesday's @ 12pm AEDT
Learn more about technical analysis and trend following through real case studies on ASX stocks. Australia's premier technical analyst, Carl Capolingua, shares his unique insights on stocks as requested by viewers. Ask about a company in your portfolio or anything related to trading and investing and get Carl's expert opinion.
Places are limited so >REGISTER NOW!<
Economy
TODAY
CHN September 'Data Dump'
New Home Prices: -0.14% m/m vs -0.17% m/m in August (Consider: You think the Aussie property market is doing it tough? Consider that Chinese new home prices haven't experienced a monthly rise since June 2023! Falls are modest, however, they're down 3.1% over the last 12 months to September.)
Fixed Asset Investment: -7.2% p.a. (year to date) vs -7.3% p.a. ytd forecast and -7.2% p.a. ytd in August
Gross Domestic Product ("GDP") September: +4.5% p.a. vs +4.4% p.a. forecast and +4.3% p.a. in June quarter
Industrial Production: +5.5% p.a. vs +5.4% p.a. forecast and +5.2% p.a. in August
Retail Sales: +1.1% p.a. vs +0.5% p.a. forecast and +0.4% p.a. in August
Unemployment Rate: 5.2% vs 5.3% forecast and 5.3% in August
LATER THIS WEEK
TUESDAY
12:00 CHN People's Bank of China ("PBOC") Loan Prime Rates
1-year LPR: Forecast to remain unchanged at 3% p.a.
5-year LPR: Forecast to remain unchanged at 3.5% p.a.
23:30 USA September Building Permits & Housing Starts
Building Permits: 1.39 million forecast vs 1.4 million in August
Housing Starts: 1.3 million forecast vs 1.28 million in August
WEDNESDAY
No major economic announcements scheduled for Wednesday
THURSDAY
No major economic announcements scheduled for Wednesday
FRIDAY
09:00 AUS Flash October Purchasing Managers Index ("PMI")
Manufacturing: no forecast available vs 49.6 previous (revised up from 49.3)
Services: no forecast available vs 51.9 previous (revised up from 51.4)
SATURDAY
09:00 USA Flash October PMI's
Manufacturing: 55.5 forecast vs 55.9 previous (revised down from 57.0)
Services: 58.0 forecast vs 58.8 previous (revised up from 58.7)
Interesting Movers
Trading higher
- Cleanaway Waste Management (CWY) $2.97+20.2%
EQT Private Equity will acquire Cleanaway for $3.095 cash per share less any dividends paid (Cleanaway Board may declare and pay a fully franked special dividend of up to $0.19 per share). The Cleanaway Board unanimously recommends shareholders vote in favour of the Scheme in the absence of a superior proposal.
- Benz Mining Corp (BNZ) $4.85+19.5%
Released latest drilling results from its Glenburgh Gold Project in Western Australia. Management reported that multiple holes returned gold intersections, including 42 m at 3.0 g/t Au from 337 m, 42 m at 1.6 g/t Au from 318 m, and 35 m at 2.4 g/t Au from 104 m and 73 m at 1.1 g/t Au from 355 m.
- Challenger (CGF) $11.75+19.3%
Received a non-binding takeover offer from TAL Daiichi Life Australia at $11.80 per share. The proposal is subject to satisfactory completion of due diligence. The Challenger Board is considering the offer and has not advised shareholders to take any action yet.
- FleetPartners Group (FPR) $5.11+7.1%
Pacific Equity Partners owned SG Fleet Management will acquire FleetPartners for $5.30 cash per share. FPR shareholders will also receive any FY26 final dividend in connection with the company's FY26 results. The FleetPartners Board recommends shareholders vote in favour of the Scheme in the absence of a superior proposal.
- New Hope Corporation (NHC) $6.18+5.8%
Agreed to acquire Malabar for $1.8 billion; deal described as creating a “clear pathway” to ~19Mtpa of saleable production and a pro forma market capitalisation of $6.3 billion. Existing New Hope shareholders to own ~79% of merged entity. Deal is unanimously supported by both boards.
Trading Lower
- Mesoblast (MSB) $1.78-10.8%
Down after quarterly Ryoncil sales of $US28 million missed analyst forecasts of $US40 million, triggering a sell-off; company had reported a 44% increase in net revenue from Ryoncil and an 85% improvement in net operating cash spend in Q1; Bell Potter has reiterated a “buy” rating on the stock but trimmed its 12-month target from $4.45 to $4.40.
- Cobre (CBE) $0.26-10.5%
Appointed former Rio Tinto CFO Phil Mitchell as its new chairman as the board undergoes a broader renewal. Co-founder Martin Holland to transition to managing director and CEO Adam Wooldridge will join the board as an executive director. Changes effective after the miner’s November AGM.
- Weebit Nano (WBT) $2.66-7.6%
Released an "Investor Update" company presentation. Few forward looking statements may have disappointed investors. Could argue today's weakness was due to a poor lead from US tech stocks on Friday... but WBT's over the counter ("OTC") shares traded 11.2% higher in New York.
- Stockland (SGP) $4.05-4.4%
Reported a 22% decline in housing sales for the September quarter, citing a slowing market due to the interest rate environment and tax changes; net sales fell to 1506 (from 1936); shares down 1.7% in Monday morning trading.
- Bendigo and Adelaide Bank (BEN) $10.11-4.2%
Posted higher cash earnings for the first quarter — cash earnings after tax $112.7 million, 18.5% higher than the quarterly average. However, net interest margin was down six basis points and lending balances contracted 3.1%.
- Ampol (ALD) $41.75-2.9%
Refining margin at the Lytton (Brisbane) plant surged to US$23.92/ barrel in Q3 (125% higher y/y), boosting profitability; headline shop sales rose by double digits; carrying out extra work during shutdown and pushing ultra-low sulfur fuels unit start to the March quarter with no material earnings impact.
- South32 (S32) $4.52-2.5%
September quarter production report released today. Management maintained annual production guidance. Sierra Gorda copper production up 11% with a record quarterly payout of US$153m (started fourth grinding line to lift processing capacity by 25%, manganese production up 14%). Cannington upgrades to support higher mining rates. Hermosa construction progressing with a significant permitting milestone. Sale of aluminium value chain to Alcoa remains on track for completion in the June half, subject to approvals.
Broker Moves
Company | Broker | Action | Rating | Price Target |
|---|---|---|---|---|
29M29Metals | Canaccord Genuity | Upgraded | Buy(from Hold) | $0.40(from $0.31) |
AAIAlcoa Corporation | Barrenjoey | Retained | Overweight | $80.00 |
AISAeris Resources | Canaccord Genuity | Retained | Buy | $0.75(from $0.70) |
ALDAmpol | Morgan Stanley | Retained | Overweight | $46.00 |
ANZANZ Group Holdings | Citi | Retained | Buy | $41.00 |
| UBS | Retained | Neutral | $39.00 | |
AS1Asara Resources | Canaccord Genuity | Retained | Speculative Buy | $0.35 |
AUEAurum Resource | Canaccord Genuity | Retained | Speculative Buy | $1.50 |
BENBendigo and Adelaide Bank | Citi | Retained | Sell | $9.70 |
| UBS | Retained | Neutral | $10.50 | |
BNZBenz Mining Corp | Canaccord Genuity | Retained | Speculative Buy | $6.30 |
BOQBank of Queensland | Morgans | Downgraded | Trim(from Hold) | $6.22(from $6.40) |
CARCAR Group | UBS | Retained | Buy | $34.50 |
CAYCanyon Resources | Canaccord Genuity | Downgraded | Hold(from Speculative Buy) | $0.05(from $0.15) |
CBACommonwealth Bank of Australia | UBS | Retained | Sell | $135.00 |
CBECobre | Canaccord Genuity | Retained | Buy | $0.50 |
CGFChallenger | Macquarie | Retained | Neutral | $9.60 |
COLColes Group | UBS | Retained | Neutral | $25.50 |
CSLCSL | Morgan Stanley | Retained | Overweight | $200.00(from $182.00) |
CYMCyprium Metals | Canaccord Genuity | Retained | Speculative Buy | $0.90 |
DRODroneShield | Canaccord Genuity | Retained | Speculative Buy | $2.60 |
DVPDevelop Global | Canaccord Genuity | Retained | Speculative Buy | $6.70(from $6.60) |
DYLDeep Yellow | Canaccord Genuity | Retained | Speculative Buy | $2.80(from $2.90) |
| Morgans | Retained | Speculative Buy | $1.50(from $1.95) | |
IMDImdex | Canaccord Genuity | Retained | Buy | $4.58 |
| UBS | Retained | Buy | $5.05 | |
JDOJudo Capital Holdings | UBS | Retained | Neutral | $1.05 |
JHXJames Hardie Industries Plc | Citi | Retained | Neutral | $42.50 |
KANKantra Copper | Canaccord Genuity | Retained | Speculative Buy | $1.90(from $1.70) |
MQGMacquarie Group | UBS | Retained | Neutral | $265.00 |
MSBMesoblast | Bell Potter | Retained | Buy | $4.40(from $4.45) |
NABNational Australia Bank | Citi | Retained | Buy | $42.10 |
| UBS | Retained | Buy | $48.50 | |
NGINavigator Global Investments | Morgans | Retained | Buy | $3.04 |
NICNickel Industries | Canaccord Genuity | Retained | Buy | $1.15 |
NWLNetwealth Group | Morgans | Retained | Buy | $22.90(from $27.50) |
NXTNEXTDC | Citi | Retained | Buy | $21.15 |
PDNPaladin Energy | Morgan Stanley | Retained | Overweight | $9.95 |
| UBS | Retained | Buy | $11.80(from $12.10) | |
PLSPLS Group | Barrenjoey | Retained | Overweight | $4.40(from $5.00) |
| Bell Potter | Retained | Buy | $4.10(from $4.40) | |
| Macquarie | Retained | Outperform | $5.25(from $5.50) | |
| Morgans | Retained | Accumulate | $3.70(from $4.00) | |
PMEPro Medicus | Morgans | Retained | Accumulate | $230.00 |
REAREA Group | UBS | Retained | Neutral | $164.00 |
RWCReliance Worldwide Corporation | Macquarie | Retained | Neutral | $4.75 |
SEKSEEK | Bell Potter | Retained | Hold | $13.60(from $13.00) |
| UBS | Retained | Buy | $19.70 | |
SFRSandfire Resources | Canaccord Genuity | Retained | Buy | $25.25(from $24.00) |
SGCSinclair Gold | Barrenjoey | Initiated | Overweight | $3.05 |
| Bell Potter | Initiated | Speculative Buy | $2.15 | |
| Canaccord Genuity | Retained | Speculative Buy | $3.85 | |
SHASHAPE Australia Corporation | Morgans | Retained | Buy | $8.76(from $8.11) |
TLSTelstra Group | Macquarie | Retained | Neutral | $5.02 |
TPGTPG Telecom | Macquarie | Retained | Outperform | $4.10 |
VEAViva Energy Group | Morgan Stanley | Retained | Equal Weight | $3.23 |
WOWWoolworths Group | UBS | Retained | Sell | $39.50 |
Scans
Top Gainers
Code | Company | Last | % Chg |
|---|---|---|---|
| RTH | Ras Technology Holdings Ltd | $1.00 | +85.19% |
| ZNO | ZOONO Group Ltd | $0.049 | +28.95% |
| TSR | Turnstone Resources Ltd | $0.024 | +26.32% |
| CWY | Cleanaway Waste Management Ltd | $2.97 | +20.24% |
| SKM | Skylark Minerals Ltd | $0.245 | +19.51% |
Top Fallers
Code | Company | Last | % Chg |
|---|---|---|---|
| EG1 | Evergold Minerals Ltd | $0.02 | -31.03% |
| POW | Powerhaus Uranium Ltd | $0.175 | -25.53% |
| SKK | Stakk Ltd | $0.019 | -20.83% |
| AGN | Argenica Therapeutics Ltd | $0.12 | -20.00% |
| CGR | CGN Resources Ltd | $0.05 | -16.67% |
52 Week Highs
Code | Company | Last | % Chg |
|---|---|---|---|
| CWY | Cleanaway Waste Management Ltd | $2.97 | +20.24% |
| CGF | Challenger Ltd | $11.75 | +19.29% |
| ALV | Alvo Minerals Ltd | $0.097 | +12.79% |
| FPR | Fleetpartners Group Ltd | $5.11 | +7.13% |
| FUEL | Betashares Global Energy Comp Currency Hedged ETF | $9.66 | +2.99% |
52 Week Lows
Code | Company | Last | % Chg |
|---|---|---|---|
| POW | Powerhaus Uranium Ltd | $0.175 | -25.53% |
| AW1 | American West Metals Ltd | $0.029 | -12.12% |
| BKB | Black Bear Minerals Ltd | $0.395 | -11.24% |
| NVA | Nova Minerals Corp | $0.395 | -11.24% |
| RAG | Ragnar Metals Ltd | $0.016 | -11.11% |
Near Highs
Code | Company | Last | % Chg |
|---|---|---|---|
| RHC | Ramsay Health Care Ltd | $55.00 | -0.99% |
| OZBD | Betashares Australian Composite Bond ETF | $43.04 | +0.02% |
| AN3PI | Australia and New Zealand Banking Group Ltd | $102.49 | +0.30% |
| PCI | Perpetual Credit Income Trust | $1.08 | -0.46% |
| WVOL | iShares MSCI World Ex Aust Minimum Volatility ETF | $47.34 | -0.23% |
Relative Strength Index (RSI) Oversold
Code | Company | Last | % Chg |
|---|---|---|---|
| RAC | Racura Oncology Ltd | $1.545 | -0.64% |
| FFM | Firefly Metals Ltd | $1.375 | -2.14% |
| MLX | Metals X Ltd | $1.635 | -3.82% |
| RG1 | Regal Partners Global Investments Ltd | $2.29 | -2.97% |
| NVA | Nova Minerals Corp | $0.395 | -11.24% |