
News | Market Wraps
Evening Wrap: ASX 200 edges higher as Trump's new semiconductor focus sends rare earths, critical metals stocks soaring
ASX 200 (XJO) intraday chart 15 April 2025

Mentioned
The S&P/ASX 200 closed 13.1 points higher, up 0.17%.
A slender gain today, led by major Healthcare (+1.3%) and Financials (+0.5%) stocks. CSL (+2.6%) and Resmed (RMD) (+0.63%) drove the gain in Healthcare as investors digested a Morgan Stanley report suggesting that across the sector, these two are "best positioned at current levels" to weather the tariff storm.
Continued safe haven (and probably a little bargain hunting) helped each of the Big 4 banks to gains of between 0.5%-1.0% today, and insurance companies like QBE Group (QBE) (+1.5%) also prospered.
In Materials (+0.42%), rare earths and critical metals stocks were notable outperformers as a new focus on semiconductors by the Trump administration, emphasising domestic production and reduced reliance on foreign supply chains, supported local miners and developers.
Heading south, Information Technology (-1.0%) slipped in response to lower US tech stocks overnight, with WiseTech Global (-1.2%) facing profit-taking after a recent strong rally.
Overall, market sentiment continues to stabilise, albeit with the main feature today renewed fears of more trade uncertainty on the way...
To make sense of all the above, I have detailed technical analysis on the Nasdaq Composite, S&P/ASX 200, US 10-year Treasury Bond Yields, and the US dollar index in today's ChartWatch.
Be sure to click/scroll through for the usual reporting of the major sector and stock-specific moves, the broker responses to them, as well as all the key upcoming economic data in tonight's Evening Wrap.
Let's dive in!
Today in Review
Tue 15 Apr 25, 5:14pm (AEST)
Name | Value | % Chg |
|---|---|---|
Major Indices | ||
| ASX 200 | 7,761.7 | +0.17% |
| All Ords | 7,969.9 | +0.13% |
| Small Ords | 2,950.9 | -0.32% |
| All Tech | 3,332.0 | -0.80% |
| Emerging Companies | 2,149.5 | +1.08% |
Currency | ||
| AUD/USD | 0.636 | +0.52% |
US Futures | ||
| S&P 500 | 5,446.75 | +0.11% |
| Dow Jones | 40,778.0 | +0.09% |
| Nasdaq | 18,961.25 | +0.14% |
Name | Value | % Chg |
|---|---|---|
Sector | ||
| Health Care | 39,890.7 | +1.34% |
| Financials | 8,265.9 | +0.48% |
| Materials | 15,701.1 | +0.42% |
| Utilities | 8,894.1 | +0.23% |
| Industrials | 7,694.6 | -0.07% |
| Energy | 6,879.7 | -0.24% |
| Consumer Discretionary | 3,786.9 | -0.42% |
| Communication Services | 1,684.2 | -0.53% |
| Real Estate | 3,469.0 | -0.94% |
| Information Technology | 2,273.5 | -0.98% |
| Consumer Staples | 11,978.6 | -1.01% |
Markets
%20%20intraday%20chart%2015%20April%202025.png)
ASX 200 Session Chart
The S&P/ASX 200 (XJO) finished 13.1 points higher at 7,761.7, 0.48% from its session high and just 0.23% from its low. Consistent with what was effectively a wall of steady excess supply from around midday, in the broader-based S&P/ASX 300 (XKO), advancers lagged decliners by 123 to 145.
Over the last few Wraps, we’ve explored this idea of the Trump Put. Basically, that the sweeping Liberation Day “reciprocal” tariffs and China-specific duties marked a peak in "artful" (or reckless) trade policy, with President Trump likely to be forced to dial them back to placate markets.
It’s the idea that things probably won’t get worse, and they may even get better – and that markets can feel safer we’re on a path to lower-and-not-greater volatility in US trade policy.
By the way, in yesterday’s Wrap, 81% of you voted that President Trump’s policies are the “Height of stupidity” versus 19% who votes they’re the “Height of genius”.
That’s actually not as one-sided as I thought it would be...I was expecting more like 98% vs 2% 😁!!!
A couple of points. The Trump Put theory hinges on the President prioritising economic and financial market stability over ideological wins, which I suggest is far from guaranteed, and secondly, last night’s new threats of increased scrutiny on semiconductors throws a decent sized wrench into the Trump Put narrative.
It suggests President Trump could escalate tensions in strategic sectors, potentially slapping tariffs or quotas on Chinese chips critical to global supply chains. This probe, unlike Friday's exemptions, aligns with a hawkish stance on national security and could hit markets hard if it leads to broader tech tariffs.
But, surely given there's going to be an investigation first, any such tariffs are likely at least a few months down the track…Right?
Even so (or probably not!), this latest development/threat means the Trump Put narrative may have just run its course. Investors are now faced with the prospect that President Trump’s trade policy oscillates between de-escalation in broad areas and provocation in specific areas – with rhetoric surrounding the semiconductor probe also hinting of increased tariffs on autos and pharmaceuticals.
.
We need our medicines and we need semiconductors and our electronics to be built in America
– US Commerce Secretary Howard Lutnick, 14 April.
As you’ll see in ChartWatch below, the rally that started with 9 April’s walk back of the Liberation Day’s “reciprocal” tariffs, potentially reached a balance point last night. Things seemed really bad – we got belted. Then things seemed not as bad as we thought – we rallied.
Now what!? I propose that we must be attentive to signs of growing equilibrium in the demand-supply environment as it would increasingly imply my hunch is right: The easy “buy the panic” gains are exhausted and it’s going to get tougher from here.
The Trump Put just expired ⚠️!
ChartWatch
NASDAQ Composite Index

Time for a pause ⏸️ (click here for full size image)
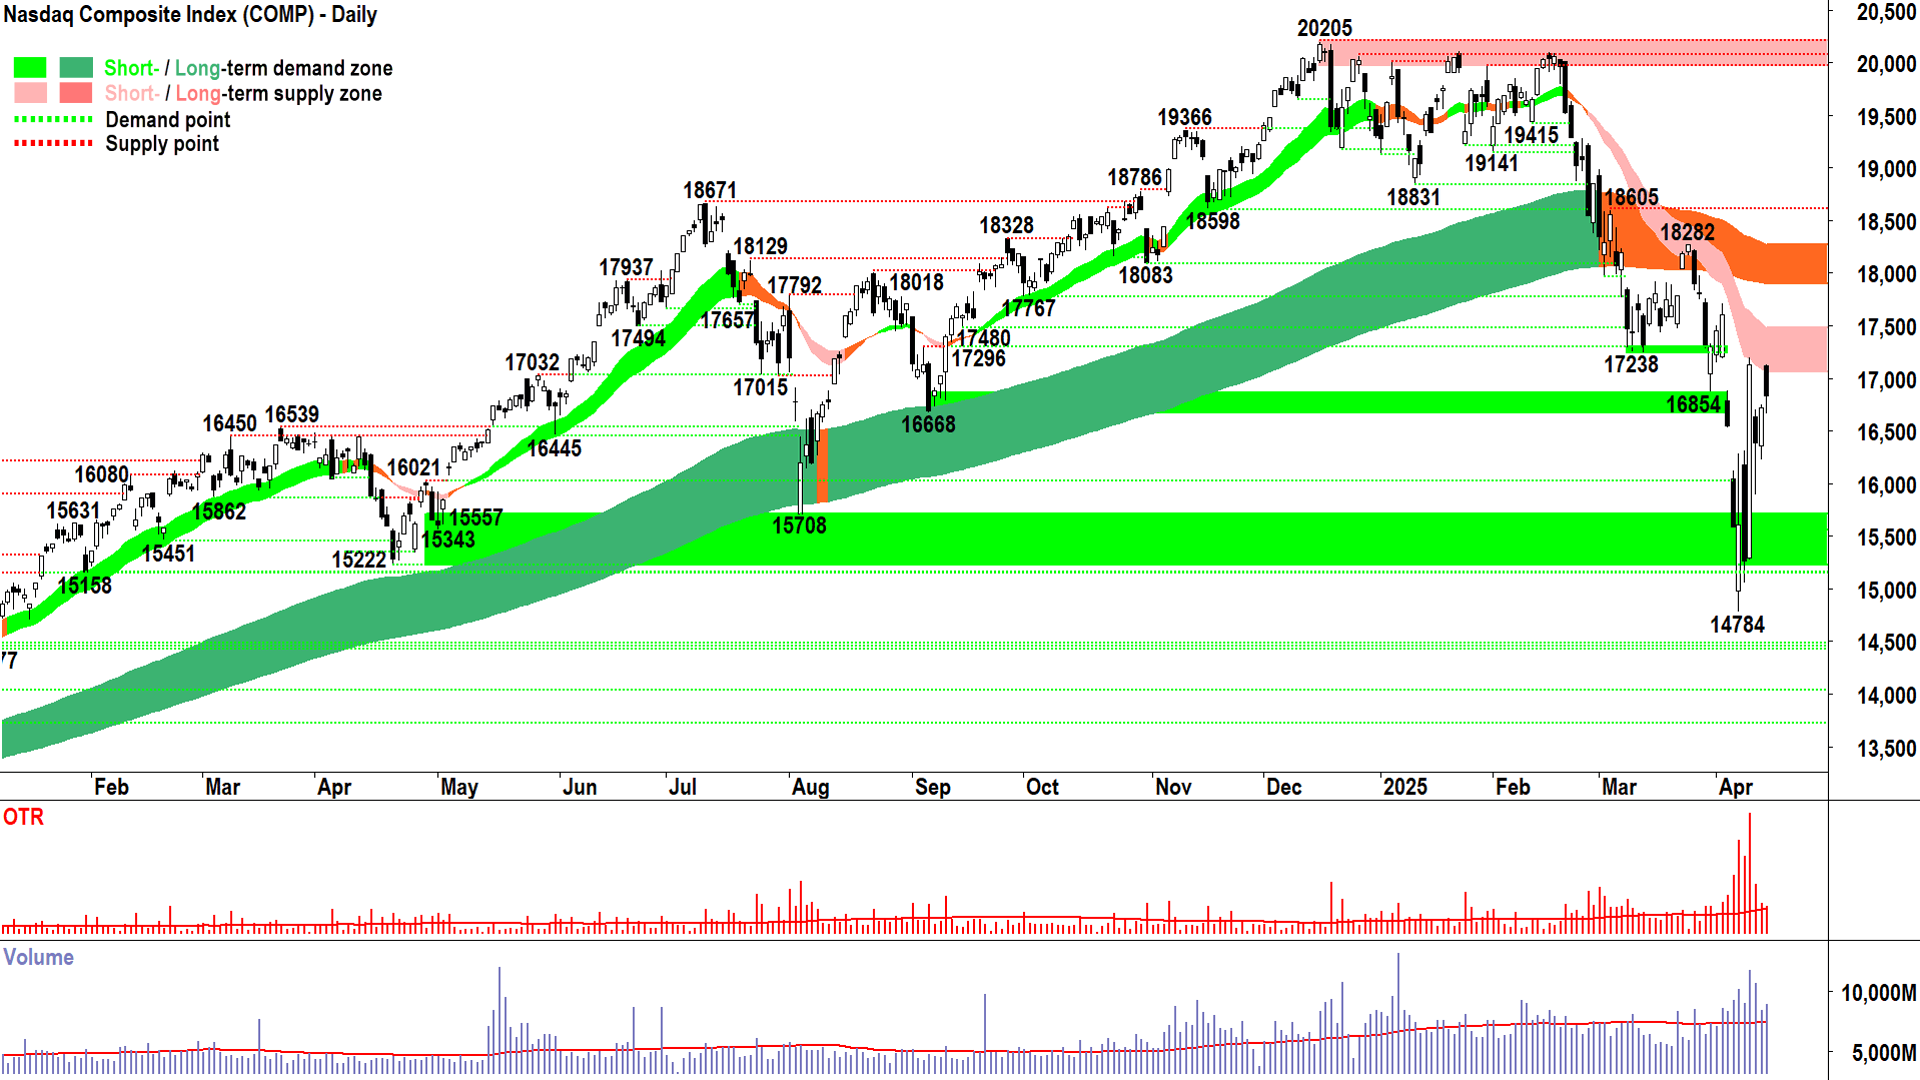
Just keep an eye on the Comp tonight (I know, you watch it every night/morning after!). We just tapped the short term downtrend ribbon – a zone my model expects will act as a zone of dynamic supply – and like absolute clockwork there was indeed supply there.
Monday’s candle wasn’t a total write off for the demand-side, though, it did have a modest downward pointing shadow.
That shadow, opposing the black body, plus the candle’s modest size – imply there wasn’t a great deal of motivation from either side to move prices yesterday. But, looking at the above-average volume, I put to you there was still plenty of stock changing hands.
Plenty of buyers meeting plenty of sellers with the price only marginally lower – it suggests that we’ve reached a bit of an equilibrium.
Monday’s price action is consistent with the theory that the drop is done, the rally is done, and now we have to figure out which way prices (more accurately the risks that drive them) are going to go next.
As far as my model is concerned, right here is the most likely place anywhere on the Comp’s chart that a period of equilibrium may occur – smack bang at the short-and-long term trend ribbons. They act as a balance point for price, often cushioning falls in uptrends and resisting rallies in downtrends.
Let’s see how the candles fall from here. The fingerprints of supply look like supply-side candles (i.e., black-bodied and or upward pointing shadows – particularly those probing into the trend ribbons) as well as the setting of a lower peak.
Alternatively, the occurrence of the fingerprints of demand here will disprove my “moving into equilibrium” theory and bolster the case for a continued rally. These would be demand-side candles (i.e., white-bodied and or downward pointing shadows) as well as the setting of a higher trough to 14784.
I’ve made my call as to which fingerprints we’ll see first, what do you think! 🤔
US 10 Year T-Bond Yield

What are bonds telling us now? (click here for full size image)
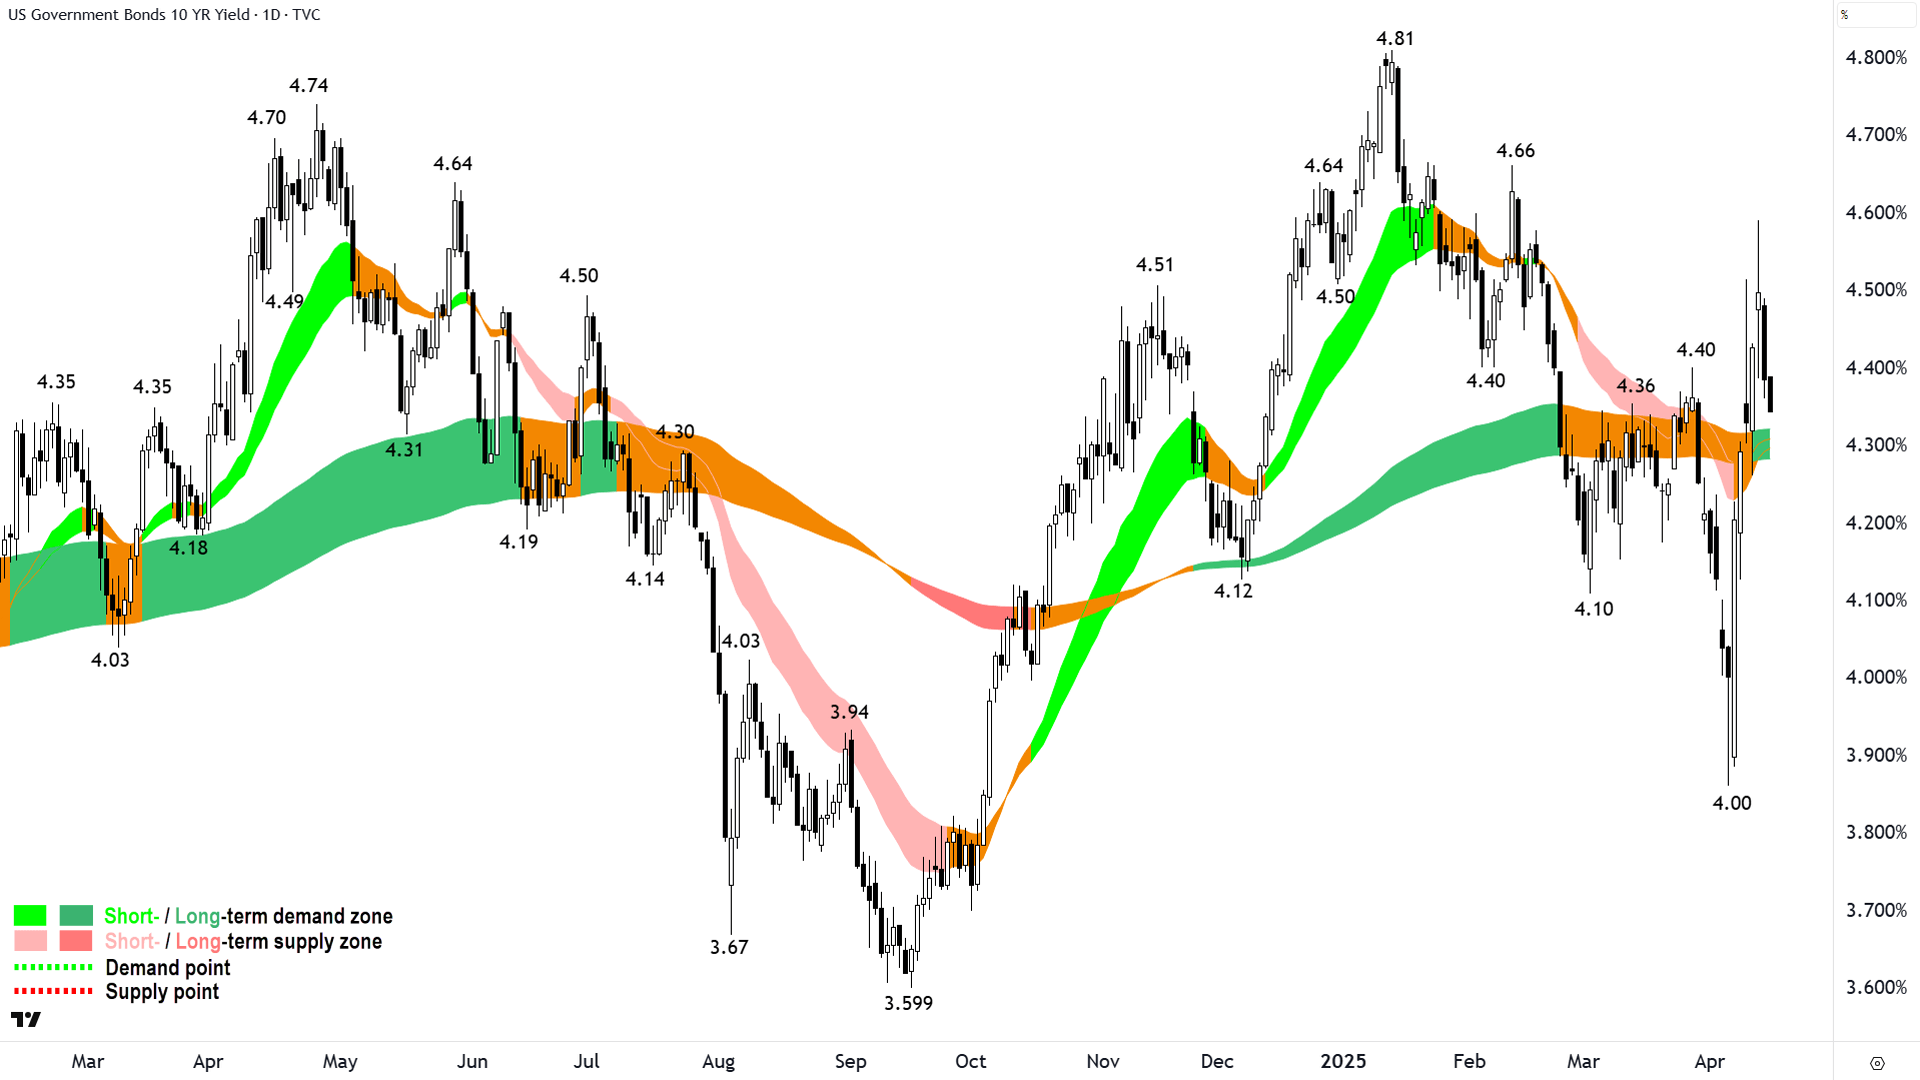
It was super interesting for me to see benchmark US risk-free rates pare back, yet stocks struggle. There's a decoupling there that we must mark down in our "What are bonds telling us now?" notebook!
The move suggests that either bond yields are paring back due to increased negative economic growth fallout from the trade war (fits the narrative of stocks down-yields down), or potentially disgruntled overseas investors are moving back into US Treasuries.
The first theory, yields are falling because of negative economic growth fallout, implies markets feel there's a greater chance the US economy is sliding closer to a recession and that the Fed might have more flexibility to do something about it.
The second theory would signal an easing of global trade tensions and firm up US Treasuries' place in the global economic ecosystem as reserve risk free assets of choice. This is important because it means Uncle Sam still has a conduit to finance its burgeoning debt at lower and not higher rates of interest.
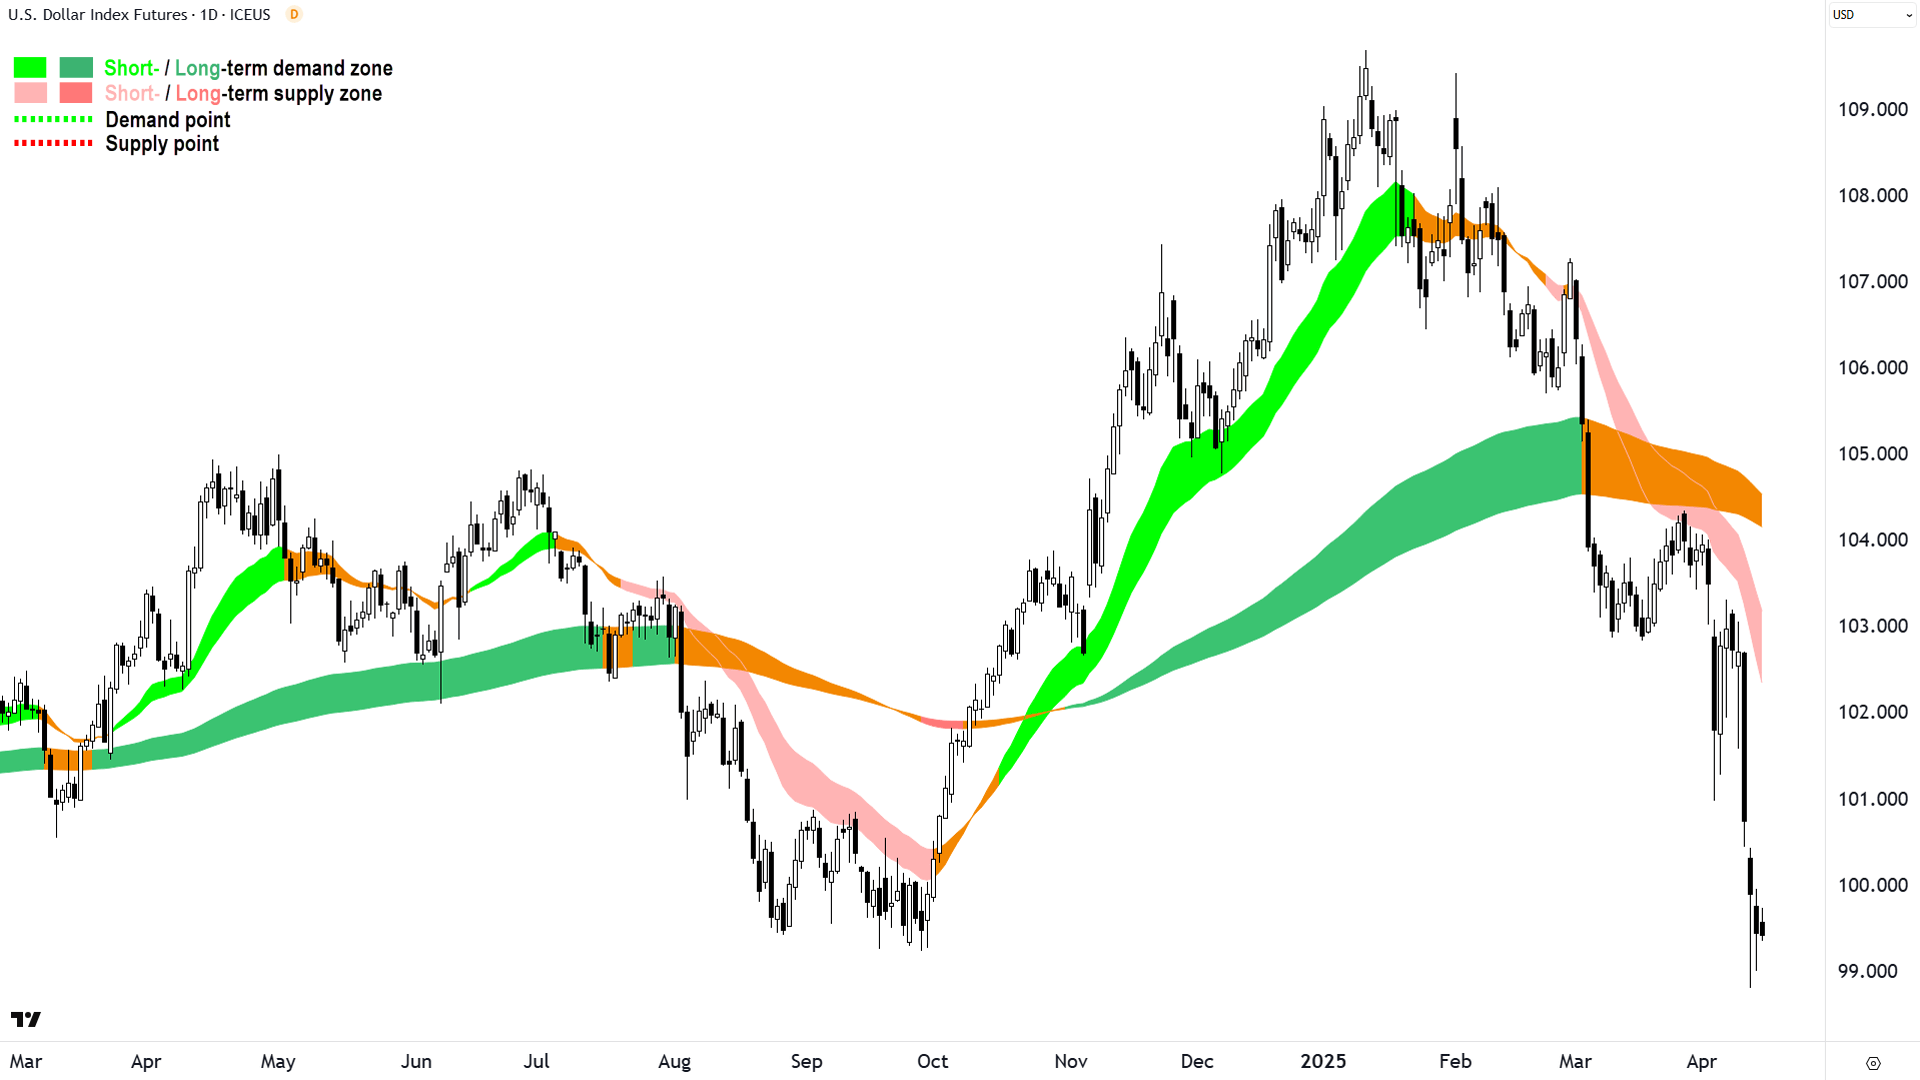
I suggest the lack of follow through in the US dollar so far (i.e., lack of a rally signaling it's overseas investors buying back in) suggests it's more likely Scenario 1 than Scenario 2. It also suggests there's more of a negative tinge to the decline in US yields yesterday than a positive one.
%20chart%2015%20April%202025.png)
US Dollar Index (DXY) (click here for full size image)
S&P/ASX 200 (XJO)
%20%20chart%2015%20April%202025.png)
Ditto what they did! (click here for full size image)
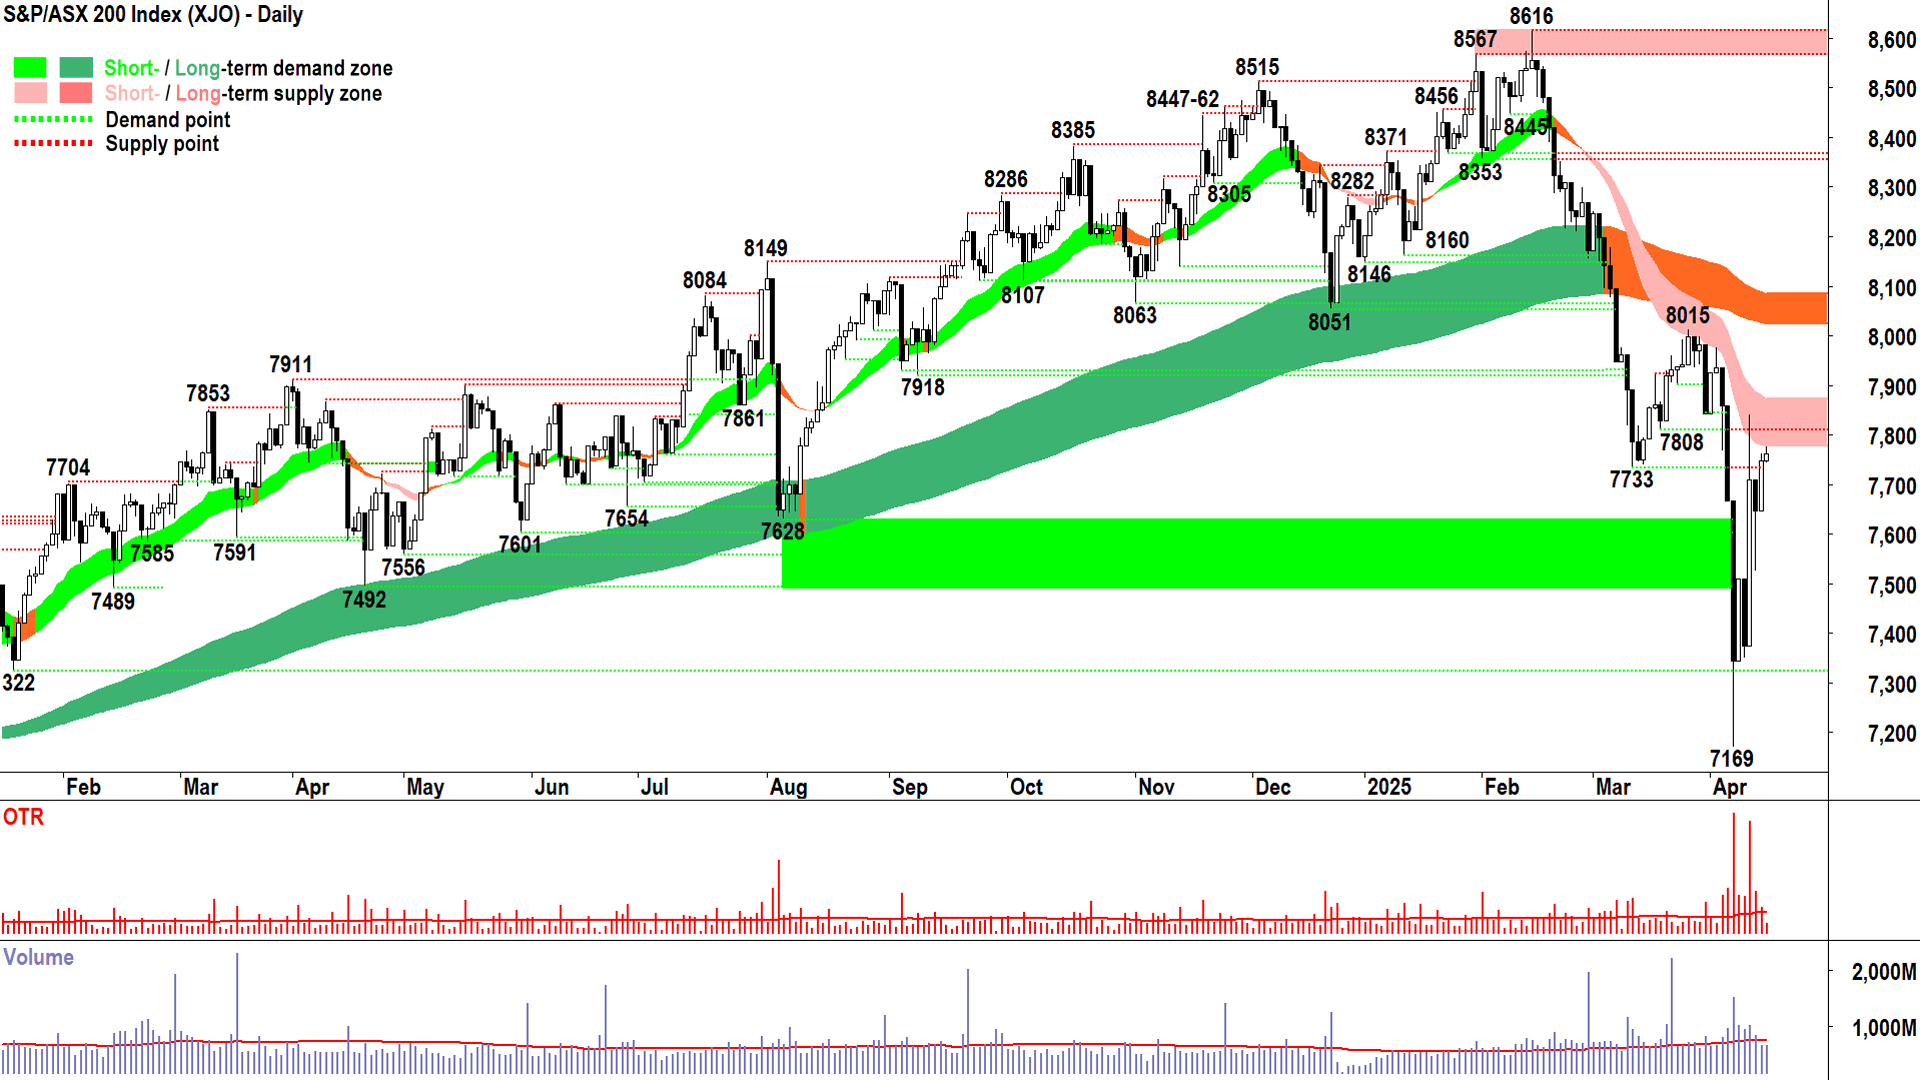
Which brings us home! We also perfectly tapped the dynamic supply of the short term downtrend ribbon and then took a little breather. So, the "Let's just copy what US stocks are doing" playbook remains firmly in place.
It also means I remain a big "ditto" here. Is there any point even doing this chart!? 🤷
Economy
Today
AUS Monetary Policy Meeting Minutes 31 March 31 - 1 April meeting
Maintaining Cash Rate Amid Uncertainty: The RBA decided to keep the cash rate unchanged at 4.1%, reflecting a cautious approach due to heightened global trade policy uncertainty, particularly around U.S. tariffs. The Board noted that while inflation is declining and expected to return to the 2–3% target range by mid-2025, domestic financial conditions remain restrictive, and there’s insufficient new data to justify altering the policy stance at this meeting.
Balanced Domestic and Global Risks: The minutes highlight two-sided risks to the economic outlook. Domestically, a tight labor market and strong unit labor costs could drive higher inflation, while weaker-than-expected consumption or labor market capacity might accelerate disinflation. Globally, potential trade disruptions from tariffs could lower growth but also pose inflationary risks via supply chain issues or exchange rate depreciation, with the RBA emphasising vigilance without immediate policy reaction.
May is a LIVE meeting, if there's going to be a cut, that's when it will occur: "Members observed that the May meeting would be an opportune time to revisit the monetary policy setting with the benefit of additional data about inflation, wages, the labour market and trends in economic activity, along with a fresh set of economic forecasts and further information about the likely evolution of global trade policies."
Later this week
Wednesday
12:00 CHN "Data Dump" March
New Home Prices m/m: -0.14% m/m previous
GDP q/y: +5.2% p.a. forecast vs +5.4% p.a. previous
Industrial Production y/y: +5.7% p.a. forecast vs +5.9% p.a. previous
Retail Sales y/y: +4.2% p.a. forecast vs +4.0% p.a. previous
Fixed Asset Investment ytd/y: +4.1% p.a. forecast vs +4..1% p.a. previous
Unemployment Rate: +5.3% p.a. forecast vs +5.4% p.a. previous
USA Core Retail Sales m/m (+0.4% m/m forecast vs +0.3% m/m previous)
Thursday
03:00 USA Fed Chair Powell Speech about economic outlook
11:30 Employment Data March
Employment Change: +40,200 forecast vs -52,800 in February
Unemployment Rate: 4.2% forecast vs 4.1% in February
22:15 EUR ECB Main Financing Rate (-0.25% p.a. to 2.4% p.a. forecast)
Friday
ALL DAY Public Holiday
Latest News
Interesting Movers
Trading higher
+29.0% Meteoric Resources (MEI) - Barra do Pacu Resource Adds Strategic High-Grade Rare Earths, general strength in rare earths and critical metals stocks today, likely on US moves to investigate tariffs on semiconductors and autos.
+22.0% Titomic (TTT) - Titomic Collaborates with Major Aerospace & Defense Prime.
+18.9% Australian Strategic Materials (ASM) - Response to ASX Query Letter and from 11-Apr REE export controls underscore need for alternative supply, ditto solid day for rare earths and critical metals stocks.
+15.6% Felix Gold (FXG) - Advancing Economic Studies for Near-Term Antimony Production, rise is consistent with prevailing long term uptrend 🔎📈
+15.5% Brazilian Rare Earths (BRE) - Continued positive response to 14-Apr BRE Unlocks Advanced High-Grade Bauxite-Gallium Project, ditto solid day for rare earths and critical metals stocks.
+11.7% Almonty Industries (AII) - Details Regarding ASX Waivers, rise is consistent with prevailing short and long term uptrends, a regular in ChartWatch ASX Scans Uptrends list 🔎📈
+11.6% Larvotto Resources (LRV) - No news, bounced perfectly from long term uptrend ribbon! 🔎📈
+9.7% Droneshield (DRO) - Continued positive response to 14-Apr $32.2 million Asia Pacific contracts.
+7.3% Brainchip (BRN) - No news, bounced in the wake of the recent sharp selloff, but likely also benefitting from the Trump vs semiconductors news.
+6.8% Koonenberry Gold (KNB) - Continued positive response to 14-Apr Enmore 2nd hole returns 172.9m @ 2.07g/t Au inc 25m @5.23g/t, rise is consistent with prevailing short and long term uptrends, a regular in ChartWatch ASX Scans Uptrends list 🔎📈
Trading lower
-21.8% Bellevue Gold (BGL) - Successful completion of A$156.5M institutional placement, target price cut by Goldman Sachs and Macquarie today (see Broker Moves section for more details), fall is consistent with prevailing short and long term downtrends, a recent regular in ChartWatch ASX Scans Downtrends list 🔎📉
-7.8% Coronado Global Resources (CRN) - No news, fall is consistent with prevailing short and long term downtrends, one of the most Featured (highest conviction) stocks in ChartWatch ASX Scans Downtrends list 🔎📉
-7.7% Collins Foods (CKF) - Strategic Review & Management Changes and Investor Presentation.
-7.4% Ora Banda Mining (OBM) - No news 🤔.
-6.7% Humm Group (HUM) - Update on CEO Work Arrangement, fall is consistent with prevailing short and long term downtrends, a regular in ChartWatch ASX Scans Downtrends list 🔎📉
-6.4% XRF Scientific (XRF) - March 2025 Quarterly Trading Report.
-5.1% MA Financial Group (MAF) - No news since 14-Apr MA Financial Group 1Q25 Operating Update, target price cut by Morgans and UBS today (see Broker Moves section for more details).
-5.0% Pinnacle Investment Management Group (PNI) - No news, fall is consistent with prevailing short and long term downtrends, a regular in ChartWatch ASX Scans Downtrends list 🔎📉
-4.5% Appen (APX) - No news, general weakness across the broader Information Technology sector today, fall is consistent with prevailing short and long term downtrends, a regular in ChartWatch ASX Scans Downtrends list 🔎📉
-3.4% Treasury Wine Estates (TWE) - No news, fall is consistent with prevailing short and long term downtrends, a regular in ChartWatch ASX Scans Downtrends list 🔎📉
Broker Moves
Alcoa Corporation (AAI)
Retained to buy from at UBS; Price Target: $50.00 from $75.00
Ansell (ANN)
Retained at equal-weight at Morgan Stanley; Price Target: $33.40
Betmakers Technology Group (BET)
Retained at buy at Ord Minnett; Price Target: $0.180 from $0.170
Bellevue Gold (BGL)
Retained at buy at Goldman Sachs; Price Target: $1.250 from $1.450
Retained at outperform at Macquarie; Price Target: $1.200 from $1.900
BHP Group (BHP)
Upgraded to outperform from hold at CLSA; Price Target: $39.50 from $41.00
Retained to neutral from at UBS; Price Target: $40.00 from $42.00
Bannerman Energy (BMN)
Retained at buy at Shaw and Partners; Price Target: $4.70 from $7.40
Boss Energy (BOE)
Initiated at outperform at RBC Capital Markets; Price Target: $3.40
Retained at buy at Shaw and Partners; Price Target: $3.26 from $3.70
Downgraded to neutral from buy at UBS; Price Target: $3.10 from $3.20
Beach Energy (BPT)
Downgraded to hold from buy at Bell Potter; Price Target: $1.350 from $1.700
Brazilian Rare Earths (BRE)
Retained at buy at Canaccord Genuity; Price Target: $5.00
Retained at buy at Ord Minnett; Price Target: $7.00
Chalice Mining (CHN)
Retained to neutral from at UBS; Price Target: $1.000 from $1.000
Champion Iron (CIA)
Downgraded to hold from outperform at CLSA; Price Target: $4.20 from $7.10
Cochlear (COH)
Retained at underweight at Morgan Stanley; Price Target: $267.00
Coles Group (COL)
Retained at buy at UBS; Price Target: $22.35
Coronado Global Resources (CRN)
Retained to buy from at UBS; Price Target: $0.310 from $1.200
CSL (CSL)
Retained at overweight at Morgan Stanley; Price Target: $313.00
Retained at buy at Ord Minnett; Price Target: $310.00
De Grey Mining (DEG)
Retained at hold at Bell Potter; Price Target: $2.58 from $1.970
Retained to buy from at UBS; Price Target: $3.10 from $3.10
Droneshield (DRO)
Retained at buy at Bell Potter; Price Target: $1.300 from $1.100
Retained at buy at Shaw and Partners; Price Target: $1.200 from $0.900
Deterra Royalties (DRR)
Downgraded to neutral from buy at UBS; Price Target: $3.70 from $4.20
EBR Systems (EBR)
Retained at buy at Bell Potter; Price Target: $2.69
Evolution Mining (EVN)
Retained to neutral from at UBS; Price Target: $8.00 from $7.30
Fortescue (FMG)
Retained to neutral from at UBS; Price Target: $15.30 from $16.70
Fisher & Paykel Healthcare Corporation (FPH)
Retained at equal-weight at Morgan Stanley; Price Target: NZ$36.70
Genesis Minerals (GMD)
Retained to buy from at UBS; Price Target: $4.50 from $4.50
Gold Road Resources (GOR)
Retained to buy from at UBS; Price Target: $3.55 from $3.55
Insurance Australia Group (IAG)
Retained at neutral at Goldman Sachs; Price Target: $8.30 from $8.15
IGO (IGO)
Retained to neutral from at UBS; Price Target: $4.30 from $5.20
Imricor Medical Systems (IMR)
Retained at buy at Morgans; Price Target: $2.28
Lotus Resources (LOT)
Downgraded to hold from buy at Shaw and Partners; Price Target: $0.220
LT (Error Ticker)
Retained to neutral from at UBS; Price Target: $0.650 from $0.750
MA Financial Group (MAF)
Retained at add at Morgans; Price Target: $8.11 from $8.92
Retained at buy at UBS; Price Target: $8.90 from $9.20
Meteoric Resources (MEI)
Retained at buy at Canaccord Genuity; Price Target: $0.350
Mineral Resources (MIN)
Downgraded to underperform from hold at CLSA; Price Target: $14.50 from $25.00
Retained to buy from at UBS; Price Target: $25.70 from $28.60
Macquarie Group (MQG)
Retained at accumulate at Ord Minnett; Price Target: $210.00 from $245.00
Newmont Corporation (NEM)
Upgraded to outperform from hold at CLSA; Price Target: $92.85 from $74.25
Retained to buy from at UBS; Price Target: $90.00 from $90.00
Nickel Industries (NIC)
Retained to buy from at UBS; Price Target: $0.900 from $1.000
Northern Star Resources (NST)
Retained to buy from at UBS; Price Target: $25.80 from $25.80
New World Resources (NWC)
Retained at buy at Canaccord Genuity; Price Target: $0.070 from $0.120
Nexgen Energy (NXG)
Retained at buy at Shaw and Partners; Price Target: $12.30 from $14.40
Paladin Energy (PDN)
Initiated at sector perform at RBC Capital Markets; Price Target: $5.50
Retained at buy at Shaw and Partners; Price Target: $10.10 from $15.50
Retained to buy from at UBS; Price Target: $9.10 from $9.20
Peninsula Energy (PEN)
Downgraded to hold from buy at Shaw and Partners; Price Target: $1.000 from $4.60
Pilbara Minerals (PLS)
Upgraded to neutral from sell at UBS; Price Target: $1.500 from $2.00
Patriot Battery Metals (PMT)
Retained to buy from at UBS; Price Target: $0.400 from $0.600
Perseus Mining (PRU)
Retained to buy from at UBS; Price Target: $4.60 from $4.60
QBE Insurance Group (QBE)
Retained at buy at Goldman Sachs; Price Target: $25.00
Ramsay Health Care (RHC)
Retained at equal-weight at Morgan Stanley; Price Target: $36.10
Rio Tinto (RIO)
Retained to neutral from at UBS; Price Target: $120.00 from $124.00
Resmed Inc (RMD)
Retained at overweight at Morgan Stanley; Price Target: US$280.00
Regis Resources (RRL)
Retained to neutral from at UBS; Price Target: $4.20 from $4.20
Reliance Worldwide Corporation (RWC)
Downgraded to hold from add at Morgans; Price Target: $4.15 from $5.80
South32 (S32)
Retained to neutral from at UBS; Price Target: $3.10 from $3.70
Sandfire Resources (SFR)
Upgraded to buy from neutral at UBS; Price Target: $13.15 from $10.45
Sonic Healthcare (SHL)
Retained at equal-weight at Morgan Stanley; Price Target: $28.10
Silex Systems (SLX)
Retained at buy at Shaw and Partners; Price Target: $6.50 from $6.90
Suncorp Group (SUN)
Retained at buy at Goldman Sachs; Price Target: $22.00
Symal Group (SYL)
Retained at buy at Ord Minnett; Price Target: $2.50 from $2.57
Viva Energy Group (VEA)
Retained at buy at Goldman Sachs; Price Target: $3.00
Retained at hold at Jefferies; Price Target: $1.500
Retained at neutral at Macquarie; Price Target: $1.700
Retained at equal-weight at Morgan Stanley; Price Target: $1.990
Retained at sector perform at RBC Capital Markets; Price Target: $2.00
Retained at buy at UBS; Price Target: $2.95 from $3.10
Whitehaven Coal (WHC)
Downgraded to neutral from buy at UBS; Price Target: $5.15 from $9.40
Woolworths Group (WOW)
Retained at neutral at UBS; Price Target: $30.50
Zip Co. (ZIP)
Upgraded to buy from neutral at Bank of America; Price Target: $2.20 from $3.00
Scans
Top Gainers
Code | Company | Last | % Chg |
|---|---|---|---|
| SRL | Sunrise Energy Metals Ltd | $0.71 | +43.43% |
| SNS | Sensen Networks Ltd | $0.033 | +37.50% |
| DAL | Dalaroo Metals Ltd | $0.02 | +33.33% |
| SUH | Southern Hemisphere Mining Ltd | $0.028 | +33.33% |
| PSC | Prospect Resources Ltd | $0.145 | +31.82% |
Top Fallers
Code | Company | Last | % Chg |
|---|---|---|---|
| KAL | Kalgoorlie Gold Mining Ltd | $0.056 | -28.21% |
| BGL | Bellevue Gold Ltd | $0.895 | -21.83% |
| ICL | Iceni Gold Ltd | $0.056 | -20.00% |
| LGM | Legacy Minerals Holdings Ltd | $0.245 | -19.67% |
| CYB | Aucyber Ltd | $0.076 | -19.15% |
52 Week Highs
Code | Company | Last | % Chg |
|---|---|---|---|
| GUL | Gullewa Ltd | $0.095 | +20.25% |
| ARN | Aldoro Resources Ltd | $0.52 | +18.18% |
| NMR | Native Mineral Resources Holdings Ltd | $0.14 | +16.67% |
| FXG | FELIX Gold Ltd | $0.185 | +15.63% |
| WIA | WIA Gold Ltd | $0.185 | +15.63% |
52 Week Lows
Code | Company | Last | % Chg |
|---|---|---|---|
| BGL | Bellevue Gold Ltd | $0.895 | -21.83% |
| DTZ | DOTZ Nano Ltd | $0.063 | -17.11% |
| CC9 | Chariot Corporation Ltd | $0.07 | -14.63% |
| TIA | Tian An Australia Ltd | $0.155 | -13.89% |
| ATG | Articore Group Ltd | $0.15 | -11.77% |
Near Highs
Code | Company | Last | % Chg |
|---|---|---|---|
| GLDN | Ishares Physical Gold ETF | $40.46 | -0.96% |
| GXLD | Global X Gold Bullion ETF | $50.63 | -1.17% |
| TLS | Telstra Group Ltd | $4.43 | 0.00% |
| NUGG | Vaneck Gold Bullion ETF | $50.41 | -1.06% |
| MPK | Many Peaks Minerals Ltd | $0.505 | +3.06% |
Relative Strength Index (RSI) Oversold
Code | Company | Last | % Chg |
|---|---|---|---|
| KAR | Karoon Energy Ltd | $1.225 | 0.00% |
| NXL | NUIX Ltd | $2.37 | -2.47% |
| BCOM | Global X Bloomberg Commodity Complex ETF | $11.12 | -0.63% |
| APX | Appen Ltd | $0.84 | -4.55% |
| RDY | Readytech Holdings Ltd | $2.26 | -0.88% |
