News | Market Wraps
Evening Wrap: ASX 200 tumbles as Trump's tariffs slice billions off BHP, RIO, Fortescue and other ASX tariff losers
The S&P/ASX 200 closed 152.9 points lower, down 1.79%.

Mentioned
The S&P/ASX 200 closed 152.9 points lower, down 1.79%.
The ink on Friday's ASX 200 record high of 8566.9 is still drying as Australian stocks slumped today as fears and speculation over US President Trump's tariffs finally became reality.
They're here: 10% on imports into the US from China, and up to 25% on both Canada and Mexico.
There are several ASX stocks that are likely to be negatively impacted by the Canada and Mexico, as they have production bases in these countries, and the US is a major destination for that production. Too bad, says President Trump: Start building factories in America and MAGA!
Unfortunately, there are more than just several ASX stocks that are likely to be negatively impacted by the tariff applied to China – a good swathe of our resources stocks to be precise. This sent stocks like BHP, RIO, and Fortescue tumbling...
Click/scroll through for the usual reporting of the major sector and stock-specific moves, the broker responses to them, as well as all the key upcoming economic data in tonight's Evening Wrap.
Also, I have detailed technical analysis on the NASDAQ Composite and the S&P/ASX 200 in today's ChartWatch.
Let's dive in!
Today in Review
Mon 03 Feb 25, 4:56pm (AEST)
Name | Value | % Chg |
|---|---|---|
Major Indices | ||
| ASX 200 | 8,379.4 | -1.79% |
| All Ords | 8,628.4 | -1.83% |
| Small Ords | 3,160.4 | -2.28% |
| All Tech | 3,901.7 | -2.06% |
| Emerging Companies | 2,275.2 | -2.29% |
Currency | ||
| AUD/USD | 0.6119 | -1.48% |
US Futures | ||
| S&P 500 | 5,945.25 | -2.01% |
| Dow Jones | 44,021.0 | -1.51% |
| Nasdaq | 21,030.5 | -2.59% |
Name | Value | % Chg |
|---|---|---|
Sector | ||
| Energy | 8,836.4 | -0.50% |
| Communication Services | 1,655.1 | -0.71% |
| Utilities | 8,695.8 | -1.37% |
| Consumer Staples | 11,687.9 | -1.37% |
| Real Estate | 3,872.2 | -1.65% |
| Industrials | 7,771.3 | -1.69% |
| Information Technology | 2,801.0 | -1.89% |
| Financials | 8,969.0 | -1.89% |
| Materials | 16,448.3 | -1.94% |
| Consumer Discretionary | 4,103.8 | -2.06% |
| Health Care | 45,276.0 | -2.26% |
Markets

ASX 200 Session Chart
The S&P/ASX 200 (XJO) finished 152.9 points lower at 8,379.4, 1.82% from its session high and just 0.31% from its low. In the broader-based S&P/ASX 300 (XKO), advancers lagged decliners by a landslide 31 to 254.
All 11 major ASX sectors, plus the Gold (XGD) (-0.90%) sub-index, closed in the red today. Or black if you prefer in candles parlance. Either way, it was an overwhelmingly bearish display from local and overseas investors today with respect to Aussie shares – and all as the ink on Friday’s record high close is still drying.
What a shame! 😭
Least-worst sectors included Energy (XEJ) (-0.50%), as crude oil and natural gas prices popped Friday as traders marked up these assets to incorporate / adjust demand-supply dynamics for the addition of Trump tariffs on energy commodities imported into the US from Canada.
Interest rate sensitives were next least-worst as investors rushed to the safety of key benchmark long term bonds – pushing their prices higher, and therefore market yields lower. Here, high PE Communication Services (XTJ) (-0.71%), flight to safety + no yield Gold, and bond proxy Utilities (XUJ) (-1.4%), dodged some of the selling.
Company | Last Price | Change $ | Change % | 1mo % | 1yr % |
|---|---|---|---|---|---|
Lynas Rare Earths (LYC) | $6.56 | +$0.23 | +3.6% | +0.5% | +11.6% |
Hansen Technologies (HSN) | $5.59 | +$0.12 | +2.2% | +3.7% | +8.5% |
Ramelius Resources (RMS) | $2.52 | +$0.05 | +2.0% | +19.4% | +58.0% |
Regis Resources (RRL) | $3.12 | +$0.06 | +2.0% | +20.9% | +47.9% |
Capricorn Metals (CMM) | $7.87 | +$0.15 | +1.9% | +25.3% | +72.6% |
Chalice Mining (CHN) | $1.155 | +$0.02 | +1.8% | +2.2% | +14.4% |
Arcadium Lithium (LTM) | $9.34 | +$0.13 | +1.4% | +12.9% | +20.1% |
Codan (CDA) | $16.23 | +$0.2 | +1.2% | +0.1% | +100.4% |
Redox (RDX) | $4.30 | +$0.05 | +1.2% | -4.4% | +88.6% |
Stanmore Resources (SMR) | $2.67 | +$0.03 | +1.1% | -11.0% | -32.4% |
AGL Energy (AGL) | $11.64 | +$0.12 | +1.0% | +2.2% | +34.3% |
Yancoal Australia (YAL) | $6.50 | +$0.06 | +0.9% | +0.8% | +8.5% |
Boss Energy (BOE) | $3.34 | +$0.03 | +0.9% | +34.7% | -40.0% |
Gentrack Group (GTK) | $11.65 | +$0.1 | +0.9% | +1.8% | +91.0% |
Sims (SGM) | $13.39 | +$0.11 | +0.8% | +11.2% | -7.8% |
New Hope Corporation (NHC) | $4.88 | +$0.04 | +0.8% | -2.6% | -9.6% |
(ACL) | $3.78 | +$0.03 | +0.8% | +10.5% | +26.0% |
Pacific Current Group (PAC) | $11.90 | +$0.08 | +0.7% | +0.4% | +26.1% |
Auckland International Airport (AIA) | $7.94 | +$0.04 | +0.5% | +2.7% | 0% |
Seek (SEK) | $23.07 | +$0.11 | +0.5% | +1.9% | -9.4% |
There were a handful of winners on the ASX today...
Hardest hit were those sectors that were deemed to have the greatest negative impact to the new Trump tariffs, particularly stocks that have an exposure to the Chinese, Canadian, and Mexican economies, and or those that have operations in those countries and export to the US.
So here Health Care (XHJ) (-2.3%), Consumer Discretionary (XDJ) (-2.1%), and Materials (XMJ) (-1.9%) stocks were most harshly dealt with.
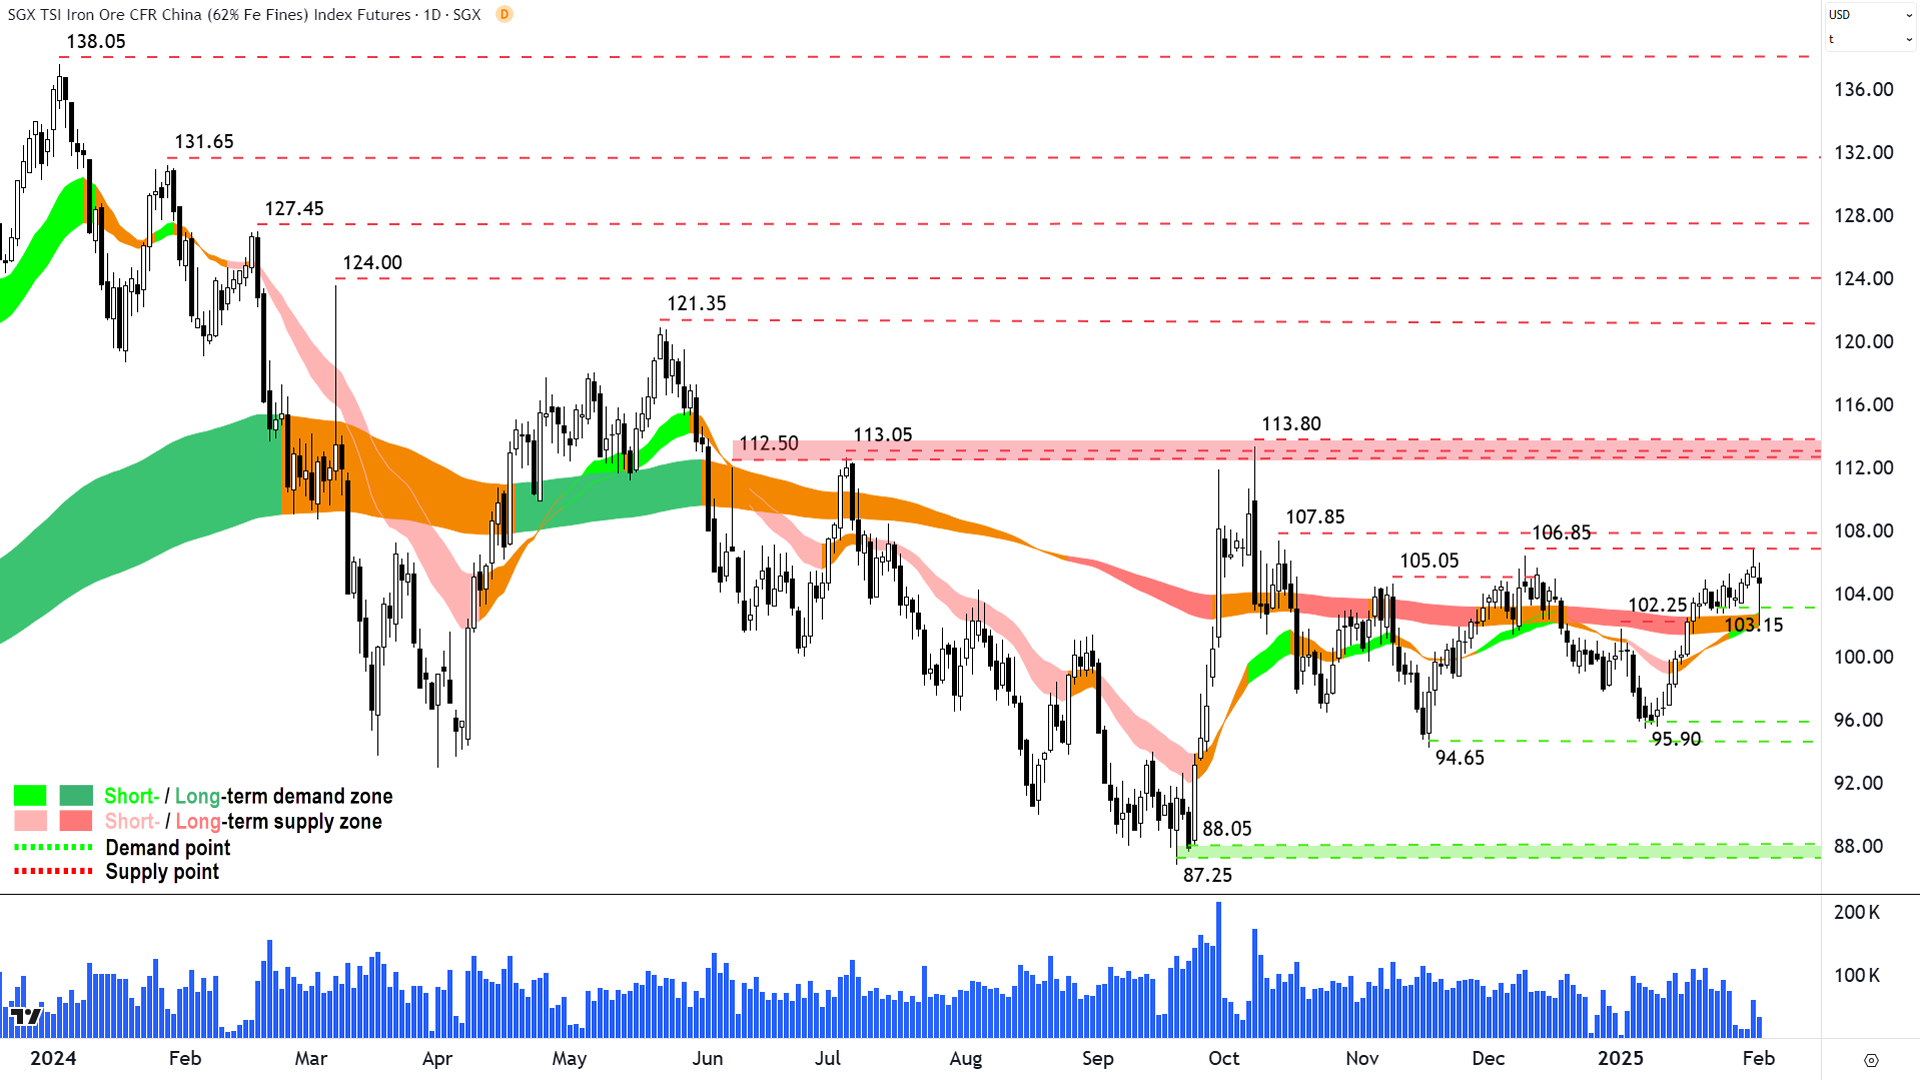
In Materials, the big iron ore miners were targeted due to their exposure to Chinese goods manufacturers – BHP Group (ASX: BHP) (-1.8%), Rio Tinto (ASX: RIO) (-2.1%), Fortescue (ASX: FMG) (-4.4%), Mineral Resources (ASX: MIN) (-5.4%), and Champion Iron (ASX: CIA) (-4.5%) each did poorly today.
Interestingly, the iron ore price in Singapore, whilst down on Friday’s close – is trading well off its session lows. Somewhat encouraging!

Iron Ore 62% (Front month, back-adjusted) SGX (click here for full size image)
Company | Last Price | Change $ | Change % | 1mo % | 1yr % |
|---|---|---|---|---|---|
Cettire (CTT) | $1.175 | -$0.275 | -19.0% | -24.9% | -62.7% |
Westgold Resources (WGX) | $2.26 | -$0.32 | -12.4% | -21.8% | +2.3% |
Brainchip (BRN) | $0.285 | -$0.04 | -12.3% | -34.5% | +83.9% |
Vulcan Energy Resources (VUL) | $4.17 | -$0.46 | -9.9% | -23.6% | +93.1% |
Magellan Financial Group (MFG) | $9.49 | -$1.02 | -9.7% | -14.0% | +4.6% |
Resolute Mining (RSG) | $0.375 | -$0.04 | -9.6% | -7.4% | -13.8% |
Paradigm Biopharmaceuticals. (PAR) | $0.530 | -$0.055 | -9.4% | +32.5% | +30.9% |
Firefly Metals (FFM) | $0.840 | -$0.085 | -9.2% | -5.1% | +68.0% |
Droneshield (DRO) | $0.615 | -$0.055 | -8.2% | -17.5% | +48.2% |
Opthea (OPT) | $1.050 | -$0.09 | -7.9% | +37.3% | +128.0% |
Fisher & Paykel Healthcare Corporation (FPH) | $31.80 | -$2.55 | -7.4% | -8.2% | +43.6% |
Polynovo (PNV) | $1.940 | -$0.15 | -7.2% | -5.4% | +1.8% |
Appen (APX) | $2.56 | -$0.19 | -6.9% | -9.2% | +652.9% |
Zip Co. (ZIP) | $2.28 | -$0.16 | -6.6% | -23.2% | +202.0% |
Amotiv (AOV) | $10.14 | -$0.7 | -6.5% | -4.2% | -17.4% |
Lifestyle Communities (LIC) | $9.23 | -$0.63 | -6.4% | +4.6% | -47.3% |
Lovisa (LOV) | $27.27 | -$1.82 | -6.3% | -10.3% | +18.5% |
Lotus Resources (LOT) | $0.230 | -$0.015 | -6.1% | +15.0% | -29.2% |
Clarity Pharmaceuticals (CU6) | $3.46 | -$0.22 | -6.0% | -14.8% | +50.9% |
Clinuvel Pharmaceuticals (CUV) | $11.40 | -$0.7 | -5.8% | -4.9% | -27.4% |
But mostly, losers...
ChartWatch
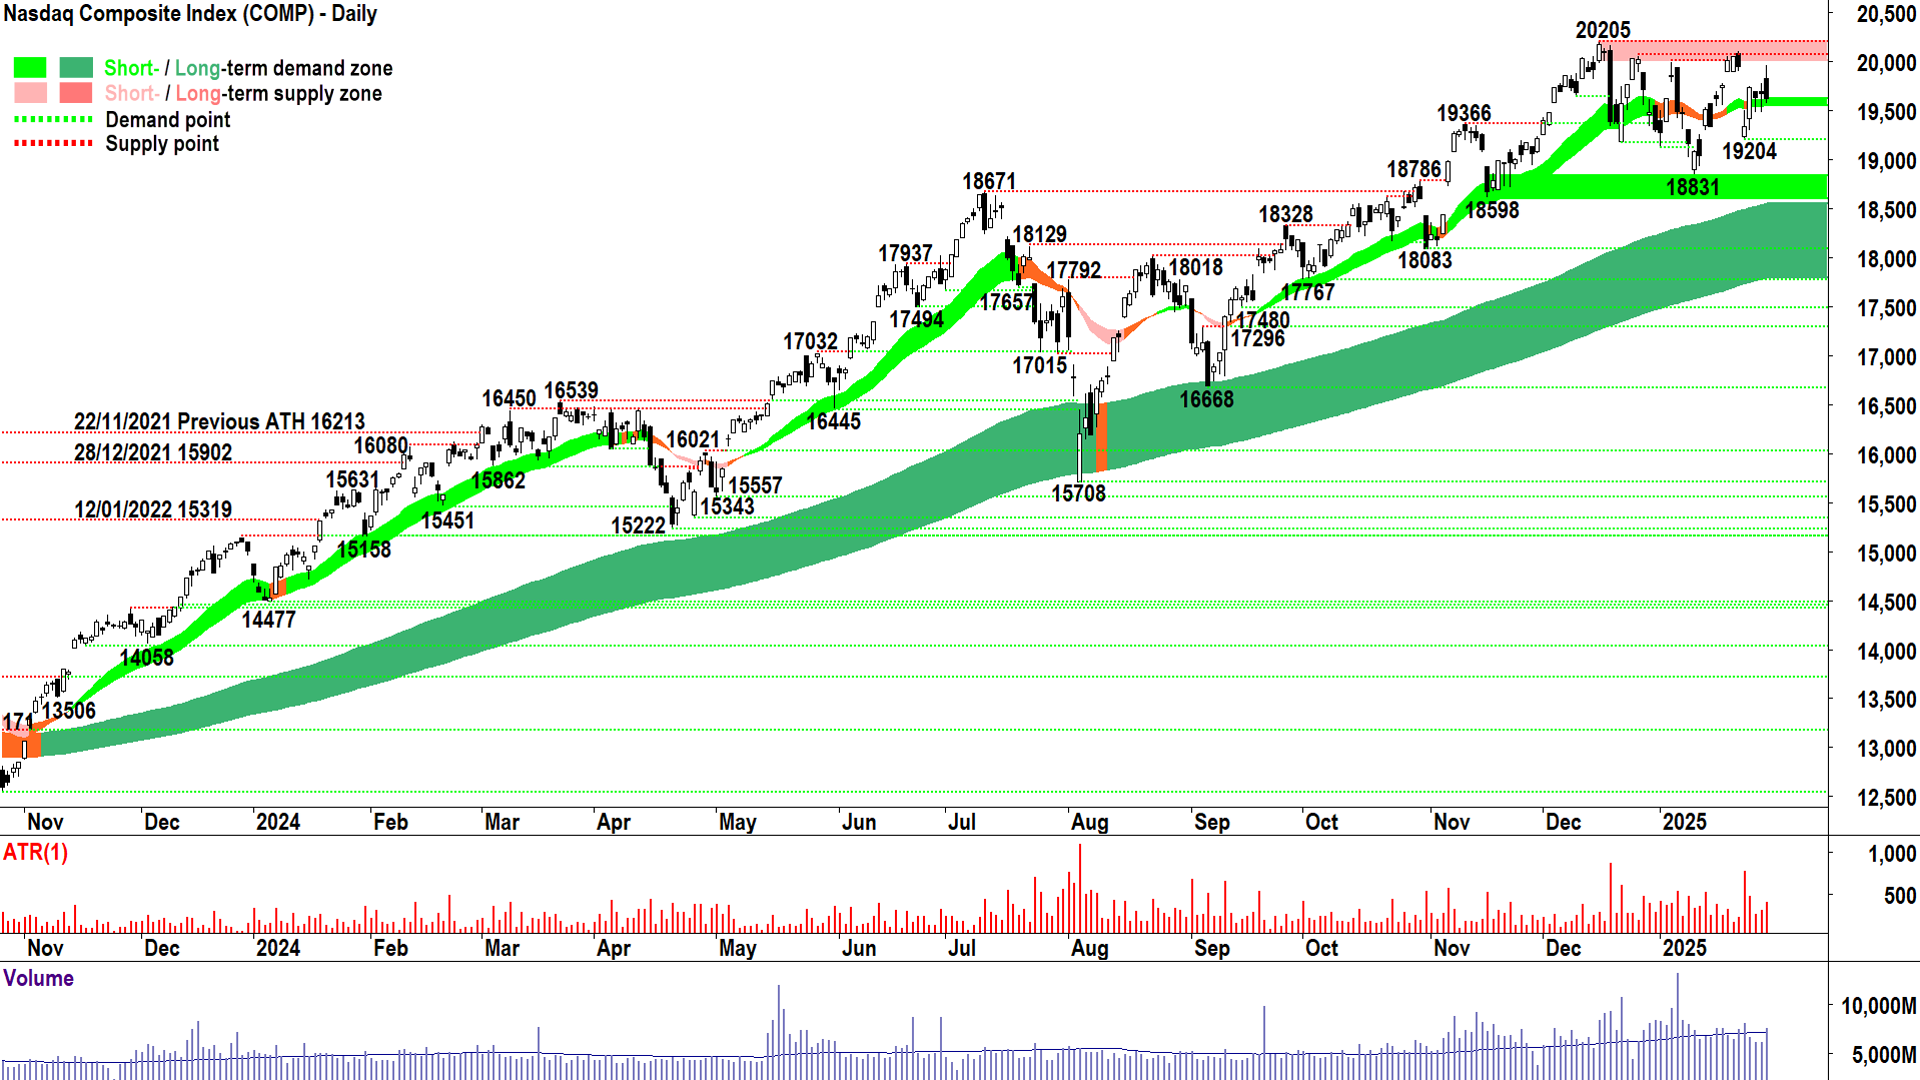
NASDAQ Composite Index

Just when you thought it was safe to go back in the water...🦈 (click here for full size image)
The last time we covered the COMP was in ChartWatch in the Evening Wrap on 29 January.
In that update, I was all “Stay the course…blah…follow the trend…blah…can’t tell the future…blah blah blah”.
As in, my usual blah.
I’m pretty much going to say the same stuff today, so blah…and if you prefer, you can skip to the XJO analysis >>>RIGHT NOW<<<
If you’re still reading this bit, then can I say the reason for me not changing my analysis a great deal is not a great deal has changed in the demand-supply environment since our last update.
Yes, there’s a nasty supply side candle from Friday to make sense of – and yes – once again it’s due to fundamental news developments. Such is the life of a technical trader!
News can and will impact the demand-supply environment because it is just that – new information. This new information must be digested, interpreted and acted upon.
Analysts analyse and report to their clients and their dealing desks updated fair values for various assets. Clients work out how many assets they wish to buy or sell based on the new valuations and call on dealing desks to implement their wishes. Dealing desks do so, as well as implementing their respective house’s views.
Demand is created. Supply is created. Prices change. Sometimes, those prices change in a way that is contrary to the prevailing trends – as was the case this time.
It’s annoying, sure, but it’s been happening since Adam bought his first parcel of Telstra back in the original float. Probably even earlier…
I should also mention that you are NOT part of the above equation (sorry, I automatically assumed that your demand and supply is completely irrelevant from a market perspective – Mr. Buffet, if you’re reading this, please disregard! (FYI, Buffet reads all my stuff!!!)
Given yours and my irrelevance in the price discovery process, I suggest we just go with the flow and try and ride the coat tails of the big money consensus – otherwise known as the trend.
The trend on the COMP – both short and long term – hasn’t changed since our last update…hence I remain long term bullish / short term bullish – but relatively more conservative with respect to the short term.
Friday’s supply-side candle, with its black body and upward pointing shadow, is concerning – but only as much as its magnitude among other candles over the last few weeks (not huge), and its context within the broader uptrends (also not huge).
"Alert not alarmed" is an appropriate phrase that comes to mind.
The top of that shadow came roughly at the beginning of a well-defined supply zone (20007-20205), so it could have occurred even without the Trump tariff developments. Supply around all time highs is commonplace.
In summary, I believe we’re ok until a close below 19204 (upon which I would ratchet up my concern level one notch), and less so if we close below 18831 (up another notch). I think we’re NOT OK if we close below the long term uptrend ribbon.
Until any, all, or none of these things occur – I suggest we do what we always do in ChartWatch:
Stay calm 🧘
Ignore outside noise because only D + S = P matters 🙉
Watch the candles (demand-side = ✅ vs supply-side = ⚠️)
Watch the price action (rising peaks and rising troughs 📈 = ✅ vs falling peaks and falling troughs 📉 = ⚠️)
Watch the trend ribbons (should continue rise and act as zones of dynamic demand)
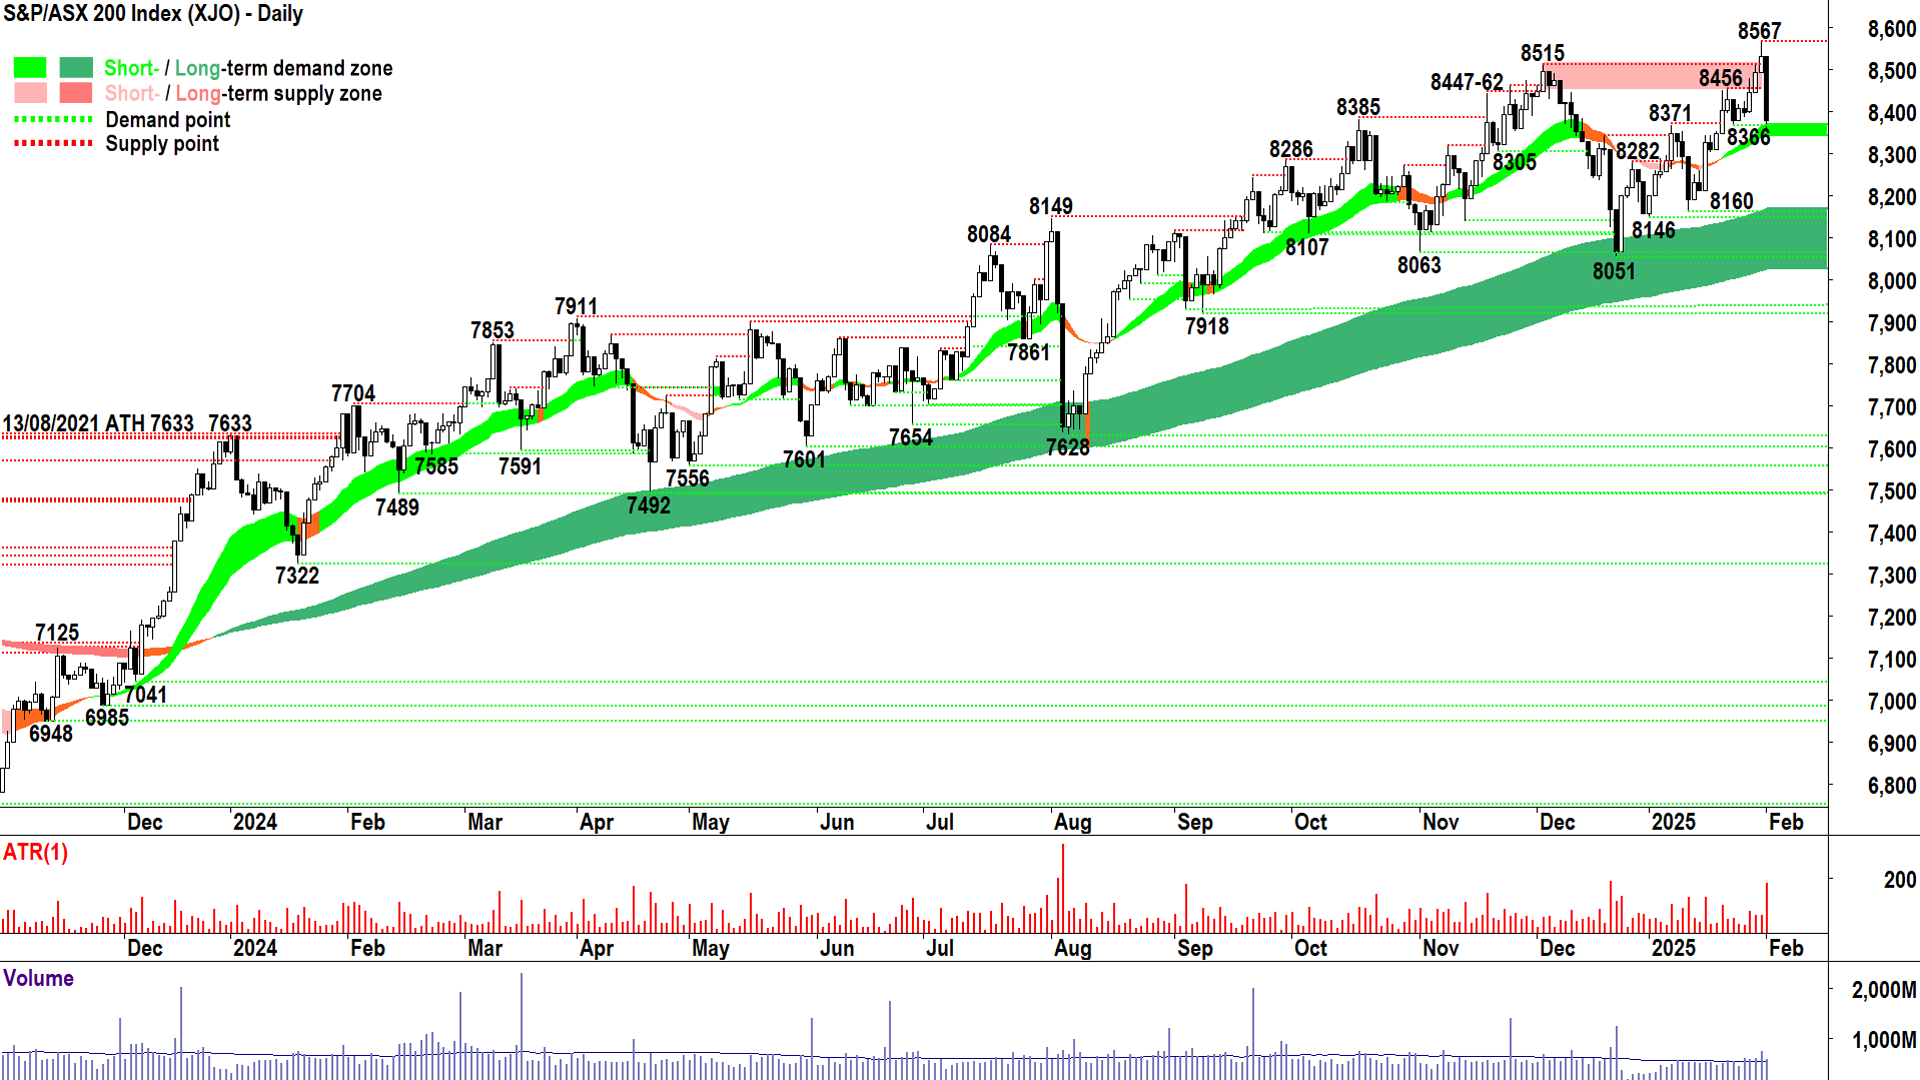
S&P/ASX 200 (XJO)
%20Chart%2003%20February%202025.png)
The ink on Friday's record high is still drying...😭 (click here for full size image)
The last time we covered the XJO was in ChartWatch in the Evening Wrap on Evening Wrap on 29 January.
If you skipped here from the blah warning in the COMP analysis – I don’t blame you – all this follow the trend stuff really gets boring after a while.
That’s not going to change my in analysis of Aussie stocks here – so you might want to keep skipping – but before you do, note that the technicals here are flashing a bigger warning signal than those in the US. ⚠️
Which suggests global investors see the latest developments as hurting the earnings of stocks on our market more than those of their US stocks counterparts.
Today's XJO candle is a proper supply side candle. Black and massive relative to its peers over the past few weeks + a close near the low of the session indicating the environment of excess supply lasted pretty much until the closing bell.
The combination of big black body and close near the low of the session usually means there’s more excess supply to come.
This is bitterly disappointing considering how good the XJO looked after logging a new record high and record high close on Friday. That’s just how the cookie crumbles, I’m afraid. News can in an instant change the demand-supply dynamics.
I derive some comfort from the fact that short and long term uptrend ribbons remain intact, and that the short term trend ribbon did act as a tentative zone of dynamic demand around today’s lows. Also, that the static point of demand at 8366 is so far holding.
We must return to demand-side candles quickly (i.e., white bodies and or downward pointing shadows). No mucking around – the demand-side must step in and soak up all this excess supply. If so, all is well with the world, and we’ll steady back towards 8567.
If not, and if the XJO closes below 8366/short term uptrend ribbon – then we could see price spill out towards 8160/long term uptrend ribbon – where I expect the demand-side will vigorously exert itself.
Economy
Today
AUS Retail Sales December
-0.1% m/m vs -0.7% m/m forecast and +0.7% m/m in November for a +4.6% p.a. increase
Food +0.1% (supermarkets & groceries -0.4%), Household Goods +1.6%, Clothing & Footwear -1.8%, Cafes, restaurants & Takeaway -0.5%, Online +4.2%
Monthly dip, but much better than expected, annual clip also very healthy and well up on December 2023 comparison (+1.0% p.a.) – indicates consumption in Australian economy remains strong
AUS Building Approvals December
+0.7% m/m vs 0.9% m/m forecast and -3.4% m/m in November
Private sector houses -3.0% m/m, private sector dwellings excluding houses +15.2%, total value -0.9%
CHN Caixin Manufacturing Purchasing Managers Index (PMI) January
50.1 vs 50.6 forecast and 50.5 in December
Readings >50 = expansion in sector, so a whisker of growth in Chinese manufacturing (from this private sector survey), and worse than expected
Later this week
Monday
EUR Core Consumer Price Index (CPI) Flash Estimate January (Flash, y/y) (+2.6% p.a. forecast vs +2.7% p.a. in December)
Tuesday
02:00 USA ISM Manufacturing PMI January (49.3 forecast vs 49.3 in December)
Wednesday
02:00 USA JOLTS Job Openings January (7.88 million forecast vs 8.10 million in December)
12:45 CHN Caixin Services PMI January (52.3 forecast vs 52.2 in December)
Thursday
02:00 USA ISM Services PMI January (54.2 forecast vs 54.1 in December)
23:00 UK Bank of England Official Bank Rate (4.50% forecast vs 4.75% previous)
Friday
00:00 USA Prelim Nonfarm Productivity & Unit Labor Costs December Quarter
Productivity: +1.8% p.a. forecast vs +2.2% p.a. in September quarter
Labor Costs: +3.3% p.a. forecast vs +0.8% p.a. in September quarter
Saturday
00:30 USA Non-Farm Payroll Data January
Employment Change: +154,000 forecast vs +256,000 in December
Average Hourly Earnings: +0.3% m/m forecast vs +0.3% m/m in December
Unemployment Rate: 4.1% forecast vs 4.1% in December
Latest News
Interesting Movers
Trading higher
+3.6% Lynas Rare Earths (LYC) - No news, exports to the US from Malaysia (not China) and Australia…perhaps this was looked upon favourably today
+2.2% Hansen Technologies (HSN) - Hansen Secures Strategic Agreement and Trading Update, rise is consistent with prevailing short and long term uptrends, a recent addition to ChartWatch ASX Scans Uptrends list 🔎📈
+2.0% Ramelius Resources (RMS) - No news, rise is consistent with prevailing short and long term uptrends, a regular in ChartWatch ASX Scans Uptrends list 🔎📈
+2.0% Regis Resources (RRL) - Regis Establishes a $300M Revolving Credit Facility, rise is consistent with prevailing short and long term uptrends, a regular in ChartWatch ASX Scans Uptrends list 🔎📈
+1.9% Capricorn Metals (CMM) - No news, rise is consistent with prevailing short and long term uptrends, a regular in ChartWatch ASX Scans Uptrends list 🔎📈
Trading lower
-19.0% Cettire (CTT) - Amendments to US Tariff regime, viewed as a Trump tariffs loser 😭
-12.4% Westgold Resources (WGX) - FY25 Guidance Update, fall is consistent with prevailing short term downtrend, long term trend is transitioning from up to down, a recent addition to ChartWatch ASX Scans Downtrends list 🔎📈
-12.3% Brainchip (BRN) - No news, ditto viewed as a Trump tariffs loser 😭
-9.9% Vulcan Energy Resources (VUL) - Change in substantial holding (dilution due to share issue), Trump China tariff fallout loser 😭
-9.7% Magellan Financial Group (MFG) - Continued negative response to 30-Jan N and several broker downgrades that followed (see Broker Moves section for more details)
-9.6% Resolute Mining (RSG) - Management Changes, fall is consistent with prevailing short and long term downtrends, a regular in ChartWatch ASX Scans Downtrends list 🔎📈
-9.4% Paradigm Biopharmaceuticals (PAR) - No news, ditto viewed as a Trump tariffs loser 😭
-9.2% Firefly Metals (FFM) - No news, Trump China tariff fallout loser 😭
-8.2% Droneshield (DRO) - No news, fall is consistent with prevailing short and long term downtrends, a regular in ChartWatch ASX Scans Downtrends list 🔎📉
-7.4% Fisher & Paykel Healthcare Corporation (FPH) - No news, ditto viewed as a Trump tariffs loser (Mexico production) 😭
Broker Moves
Aeris Resources (AIS)
Retained at buy at Bell Potter; Price Target: $0.290 from $0.340
Retained at outperform at Macquarie; Price Target: $0.270
Amcor (AMC)
Retained at neutral at UBS; Price Target: $16.65
ANZ Group (ANZ)
Retained at sell at Citi; Price Target: $25.25
AUB Group (AUB)
Downgraded to neutral from buy at UBS; Price Target: $33.30 from $36.80
Breville Group (BRG)
Retained at neutral at Citi; Price Target: $36.51
Bluescope Steel (BSL)
Upgraded to buy from neutral at Citi; Price Target: $24.00 from $21.00
Deterra Royalties (DRR)
Retained at neutral at Citi; Price Target: $4.40 from $4.20
Fortescue (FMG)
Retained at sell at UBS; Price Target: $17.50
Findi (FND)
Initiated at add at Morgans; Price Target: $7.17
GQG Partners (GQG)
Retained at neutral at UBS; Price Target: $2.32
Genetic Signatures (GSS)
Retained at buy at Bell Potter; Price Target: $1.050 from $1.100
Hastings Technology Metals (HAS)
Retained at hold at Ord Minnett; Price Target: $0.310
Hansen Technologies (HSN)
Retained at positive at RBC Capital Markets; Price Target: $6.00
Insurance Australia Group (IAG)
Retained at neutral at UBS; Price Target: $9.15 from $8.55
IDP Education (IEL)
Retained at neutral at UBS; Price Target: $14.70 from $16.45
IGO (IGO)
Retained at sell at Bell Potter; Price Target: $4.20 from $4.00
Retained at neutral at Citi; Price Target: $5.30 from $5.40
Retained at buy at Goldman Sachs; Price Target: $5.60 from $6.05
Retained at outperform at Macquarie; Price Target: $5.80 from $5.90
Retained at underweight at Morgan Stanley; Price Target: $4.50
Retained at neutral at UBS; Price Target: $5.45
Impedimed (IPD)
Retained at buy at Morgans; Price Target: $0.170 from $0.190
Retained at buy at Ord Minnett; Price Target: $0.120 from $0.130
Judo Capital (JDO)
Retained at hold at Morgans; Price Target: $1.960 from $1.920
Jupiter Mines (JMS)
Retained at outperform at Macquarie; Price Target: $0.22 from $0.21
Lendlease Group (LLC)
Retained at buy at Citi; Price Target: $8.00
Retained at equal-weight at Morgan Stanley; Price Target: $7.16
Lotus Resources (LOT)
Retained at buy at Canaccord Genuity; Price Target: $0.380 from $0.420
Retained at outperform at Macquarie; Price Target: $0.380 from $0.400
Meteoric Resources (MEI)
Retained at buy at Ord Minnett; Price Target: $0.200
Magellan Financial Group (MFG)
Downgraded to sell from neutral at UBS; Price Target: $10.30 from $10.90
Mineral Resources (MIN)
Retained at buy at Bell Potter; Price Target: $59.60 from $61.00
Retained at neutral at Goldman Sachs; Price Target: $34.00
Monadelphous Group (MND)
Retained at neutral at UBS; Price Target: $15.45 from $14.00
Nickel Industries (NIC)
Retained at buy at Bell Potter; Price Target: $1.390 from $1.430
Northern Minerals (NTU)
Retained at buy at Ord Minnett; Price Target: $0.030
Orora (ORA)
Retained at neutral at UBS; Price Target: $2.57 from $2.45
Origin Energy (ORG)
Retained at buy at Citi; Price Target: $11.50 from $12.50
Retained at neutral at Goldman Sachs; Price Target: $10.20 from $10.40
Retained at underweight at Jarden; Price Target: $10.45 from $10.65
Retained at neutral at JP Morgan; Price Target: $10.60 from $10.20
Downgraded to neutral from outperform at Macquarie; Price Target: $10.00 from $10.35
Retained at underweight at Morgan Stanley; Price Target: $9.06
Retained at buy at Ord Minnett; Price Target: $11.10 from $11.00
Retained at buy at UBS; Price Target: $11.90 from $11.75
Paradigm Biopharmaceuticals (PAR)
Retained at buy at Bell Potter; Price Target: $0.800
Pointsbet (PBH)
Retained at hold at Bell Potter; Price Target: $0.900 from $0.950
Downgraded to overweight from buy at Jarden; Price Target: $0.950 from $1.000
Retained at buy at Ord Minnett; Price Target: $0.950
Peninsula Energy (PEN)
Retained at buy at Canaccord Genuity; Price Target: $2.50 from $3.20
Premier Investments (PMV)
Retained at neutral at Citi; Price Target: $26.00 from $22.74
QBE Insurance Group (QBE)
Retained at buy at UBS; Price Target: $23.85 from $23.00
Ramsay Health Care (RHC)
Retained at neutral at Citi; Price Target: $42.00
Resmed Inc (RMD)
Retained at neutral at Citi; Price Target: $41.00 from $38.00
Retained at buy at Goldman Sachs; Price Target: $49.00 from $48.90
Retained at overweight at Jarden; Price Target: $41.48 from $36.60
Retained at outperform at Macquarie; Price Target: $45.10 from $41.10
Retained at buy at Ord Minnett; Price Target: $44.80 from $43.90
Upgraded to buy from neutral at UBS; Price Target: US$290 from US$255
Downgraded to market-weight from overweight at Wilsons; Price Target: $42.82 from $42.18
Resolute Mining (RSG)
Retained at outperform at Macquarie; Price Target: $0.470 from $0.600
St Barbara (SBM)
Retained at outperform at Macquarie; Price Target: $0.390
Steadfast Group (SDF)
Retained at buy at UBS; Price Target: $6.85 from $6.70
Sandfire Resources (SFR)
Retained at buy at Canaccord Genuity; Price Target: $11.00 from $10.75
Retained at hold at Morgans; Price Target: $10.55 from $9.70
SGH (SGH)
Retained at buy at Bell Potter; Price Target: $53.00 from $48.50
Retained at buy at UBS; Price Target: $56.00 from $45.00
Strike Energy (STX)
Downgraded to hold from buy at Bell Potter; Price Target: $0.270 from $0.290
Retained at neutral at Macquarie; Price Target: $0.240 from $0.210
Suncorp Group (SUN)
Downgraded to neutral from buy at UBS; Price Target: $20.70 from $20.20
Sayona Mining (SYA)
Retained at outperform at Macquarie; Price Target: $0.040
Vitrafy Life Sciences (VFY)
Retained at buy at Bell Potter; Price Target: $2.36
Wagners Holding Company (WGN)
Initiated at buy at Unified Capital Partners; Price Target: $2.02
Scans
Top Gainers
Code | Company | Last | % Chg |
|---|---|---|---|
| OZM | Ozaurum Resources Ltd | $0.06 | +66.67% |
| BB1 | Blinklab Ltd | $0.335 | +26.42% |
| PUA | Peak Minerals Ltd | $0.015 | +25.00% |
| RTG | RTG Mining Inc | $0.03 | +20.00% |
| MVP | Medical Developments International Ltd | $0.795 | +19.55% |
Top Fallers
Code | Company | Last | % Chg |
|---|---|---|---|
| XF1 | Xref Ltd | $0.155 | -24.39% |
| HPC | The Hydration Pharmaceuticals Company Ltd | $0.012 | -20.00% |
| ODA | Orcoda Ltd | $0.092 | -20.00% |
| CTT | Cettire Ltd | $1.175 | -18.97% |
| FTZ | Fertoz Ltd | $0.032 | -17.95% |
52 Week Highs
Code | Company | Last | % Chg |
|---|---|---|---|
| OZM | Ozaurum Resources Ltd | $0.06 | +66.67% |
| PUA | Peak Minerals Ltd | $0.015 | +25.00% |
| SIO | Simonds Group Ltd | $0.215 | +7.50% |
| REM | Remsense Technologies Ltd | $0.055 | +5.77% |
| BXN | Bioxyne Ltd | $0.046 | +4.55% |
52 Week Lows
Code | Company | Last | % Chg |
|---|---|---|---|
| ODA | Orcoda Ltd | $0.092 | -20.00% |
| PGO | Pacgold Ltd | $0.059 | -13.87% |
| TEE | Top End Energy Ltd | $0.095 | -13.64% |
| RTH | Ras Technology Holdings Ltd | $0.655 | -12.67% |
| HIO | Hawsons Iron Ltd | $0.015 | -11.77% |
Near Highs
Code | Company | Last | % Chg |
|---|---|---|---|
| SMLL | Betashares Australian Small Companies Select ETF | $3.74 | +0.54% |
| OZBD | Betashares Australian Composite Bond ETF | $44.35 | -0.18% |
| PCI | Perpetual Credit Income Trust | $1.185 | +0.85% |
| WVOL | Ishares MSCI World Ex Aust Minimum Volatility ETF | $43.77 | +0.78% |
| AII | Almonty Industries Inc | $1.35 | 0.00% |
Relative Strength Index (RSI) Oversold
Code | Company | Last | % Chg |
|---|---|---|---|
| NXL | NUIX Ltd | $4.49 | +4.91% |
| PLY | Playside Studios Ltd | $0.22 | +7.32% |
| RFF | Rural Funds Group | $1.62 | -0.31% |
| CXL | CALIX Ltd | $0.595 | -3.25% |
| AIS | Aeris Resources Ltd | $0.145 | -3.33% |
