News | Market Wraps
Evening Wrap: ASX 200 keeps good times rolling as big tech, real estate, and consumer staples stocks surge
The S&P/ASX 200 closed 19.4 points higher, up 0.24%.

Mentioned
The S&P/ASX 200 closed 19.4 points higher, up 0.24%.
A relatively quiet day by comparison to some of the stonking gains we've seen in many sessions over the last couple of weeks, but a very solid day for Australian shares nonetheless.
Technology shares are back in a big way, surging over 4% at a sector level on the back of the likes of Megaport (MP1), Technology One (TNE) and Xero (XRO) - all either stalwarts or new re-appearances in our ChartWatch ASX Scans Uptrends list.
Elsewhere, Real Estate stocks continued their recent strong form, with ever-defensive Consumer Staples not far behind. Endeavour Group (EDV) (+5%) led the charge in that sector.
Not-so-good bits? Energy and Resources again, I'm afraid. They've been notably absent from the last few day's gains on the benchmark ASX 200. Today, another dour affair, with Woodside Energy (WDS) (-2.6%) leading Energy lower, and gold stocks once again dragging on the broader Resources index.
To make sense of all the above, I have detailed technical analysis on the Nasdaq Composite, S&P/ASX 200 and US Bonds in today's ChartWatch.
Be sure to click/scroll through for the usual reporting of the major sector and stock-specific moves, the broker responses to them, as well as all the key upcoming economic data in tonight's Evening Wrap.
Let's dive in!
Today in Review
Thu 01 May 25, 5:04pm (AEST)
Name | Value | % Chg |
|---|---|---|
Major Indices | ||
| ASX 200 | 8,145.6 | +0.24% |
| All Ords | 8,365.7 | +0.30% |
| Small Ords | 3,068.3 | +0.49% |
| All Tech | 3,620.1 | +2.28% |
| Emerging Companies | 2,220.2 | -0.11% |
Currency | ||
| AUD/USD | 0.6399 | -0.05% |
US Futures | ||
| S&P 500 | 5,642.0 | +0.98% |
| Dow Jones | 40,977.0 | +0.51% |
| Nasdaq | 19,930.5 | +1.38% |
Name | Value | % Chg |
|---|---|---|
Sector | ||
| Information Technology | 2,500.4 | +4.01% |
| Real Estate | 3,749.2 | +1.61% |
| Consumer Staples | 12,432.5 | +1.42% |
| Industrials | 8,012.7 | +0.94% |
| Communication Services | 1,742.0 | +0.75% |
| Consumer Discretionary | 4,013.4 | +0.41% |
| Health Care | 41,554.1 | +0.36% |
| Financials | 8,788.7 | -0.01% |
| Utilities | 9,221.4 | -0.13% |
| Materials | 15,950.9 | -0.84% |
| Energy | 7,228.4 | -1.35% |
Markets
%20intraday%20chart%2001%20May%202025.png)
ASX 200 Session Chart
The S&P/ASX 200 (XJO) finished 19.4 points higher at 8,145.6, 0.44% from its session high and just 0.08% from its low. Despite the relatively modest gain in the benchmark index compared to recent sessions, in the broader-based S&P/ASX 300 (XKO) advancers still manage to beat decliners by a very tidy 182 to 93.
In last night's wrap I noted the importance of keeping an eye out for a potential upcoming "inflection point" for US risk-free yields. For now, falling risk-free yields on US 10's and 30's indicate some capital flowing back into these global reserve assets. That's good for "The US is not a spent forces in global reserve assets" narrative.
Maintaining that narrative is important, because if the US loses its status as the pre-eminent risk-free currency/bond/return combination destination, it will likely mean Uncle Sam might have a tough time paying his substantial tab. A tab which is getting bigger by the billions each day.
But concerns over economic growth can also force yields lower, as investors (domestic to the US and external) flock to the relative safety of these risk-free assets (while stocks are likely to be tanking on fears of lower earnings).
I suggest there's a point where falling US 10s/30s yields will stop being perceived as a good thing by markets, and begin to be perceived as something more sinister – that the US economy is sliding into the toilet.
Naturally, when this has happened in the past, the Fed has ridden to the rescue with lower official interest rates to lessen the impact, and hopefully, to jump start the US economy again.

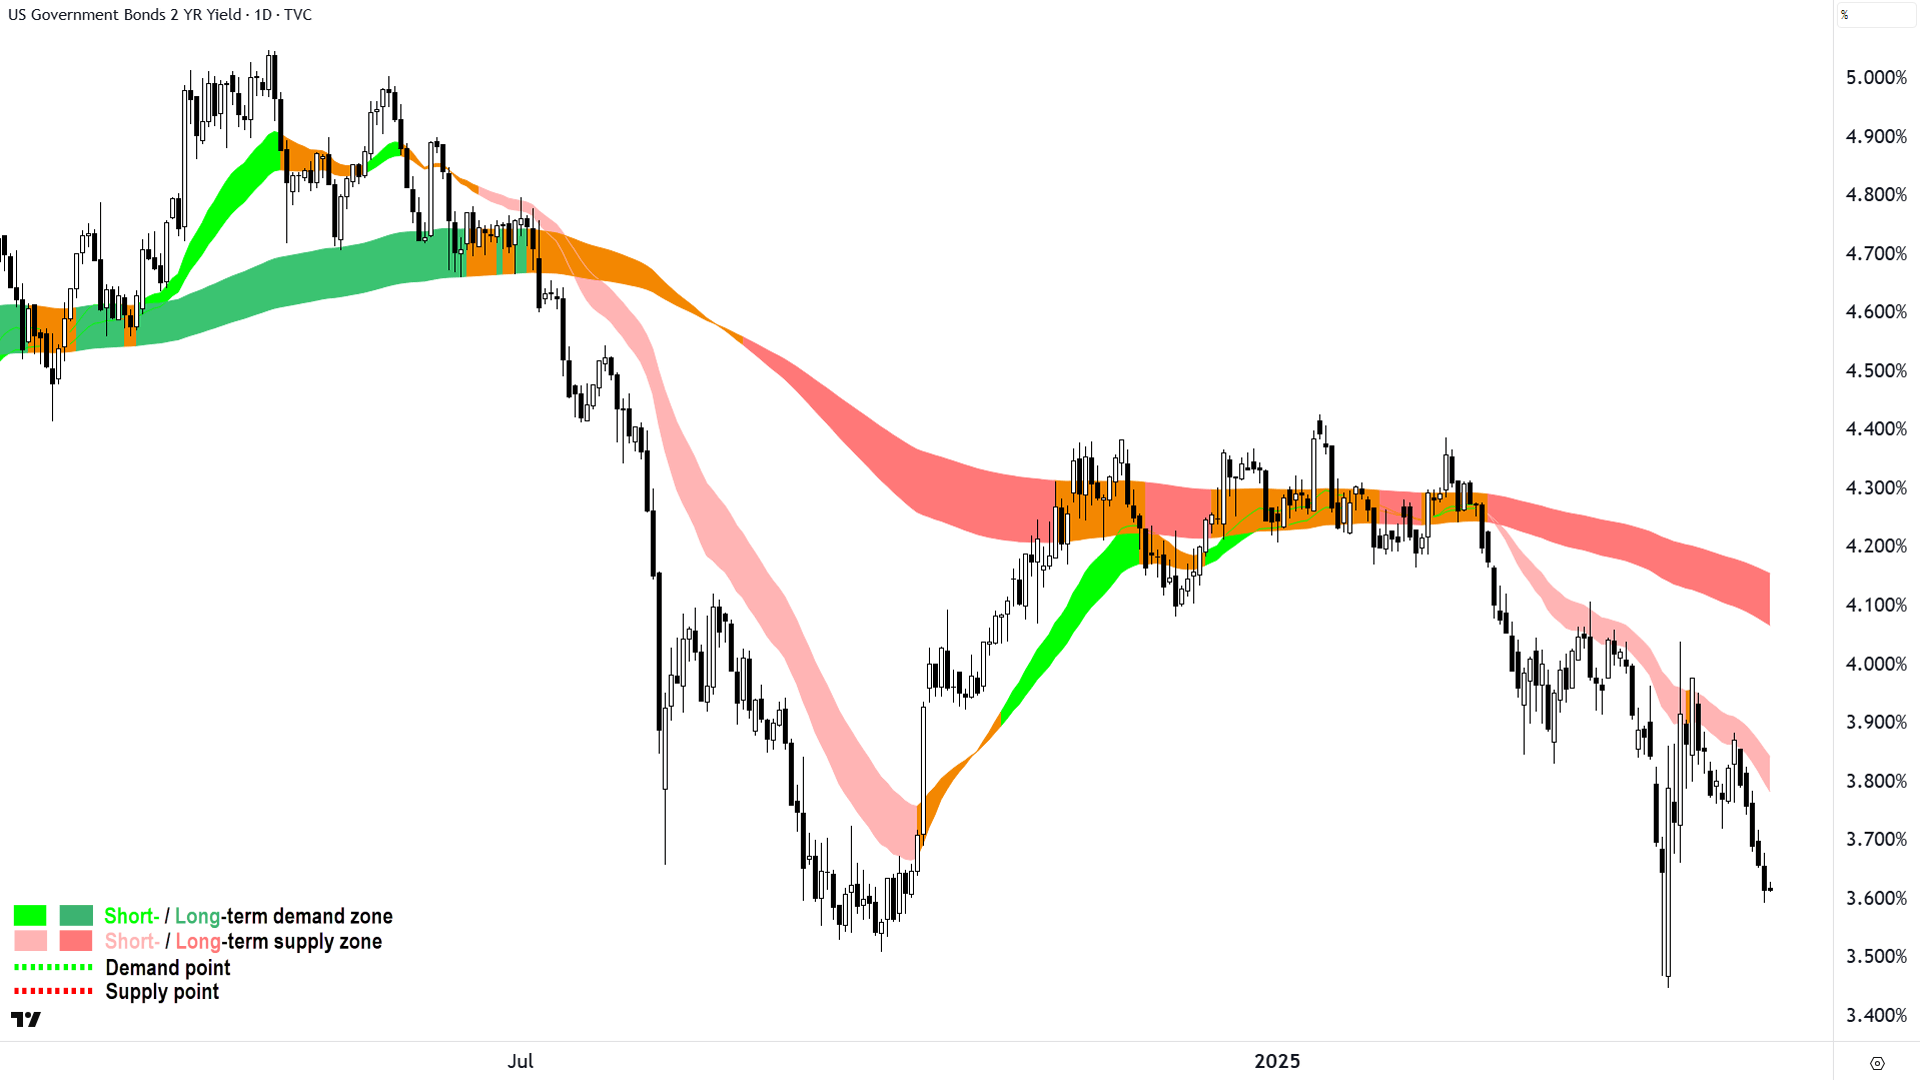
The US 2 Year T-Bond Yield is more sensitive to expected Fed policy shifts and US economic growth (click here for full size image)
I believe the 10s/30s yields are too caught up in the Trump trade war / reserve risk-free asset narrative to give us a clear picture of how investors are really positioning on the Fed + US economy front.
Can I suggest then, that you watch more closely for your reference on this item the US 2-year Treasury bond yield. It's traditionally the coal face of investor sentiment for near-to-medium term Fed policy – which itself depends on the health, or lack thereof, of the US economy.
Looking at the chart above, it's telling a very different story to the 10/30s yields charts, which are paring back to be fair, but nowhere near as fast.
ChartWatch
NASDAQ Composite Index

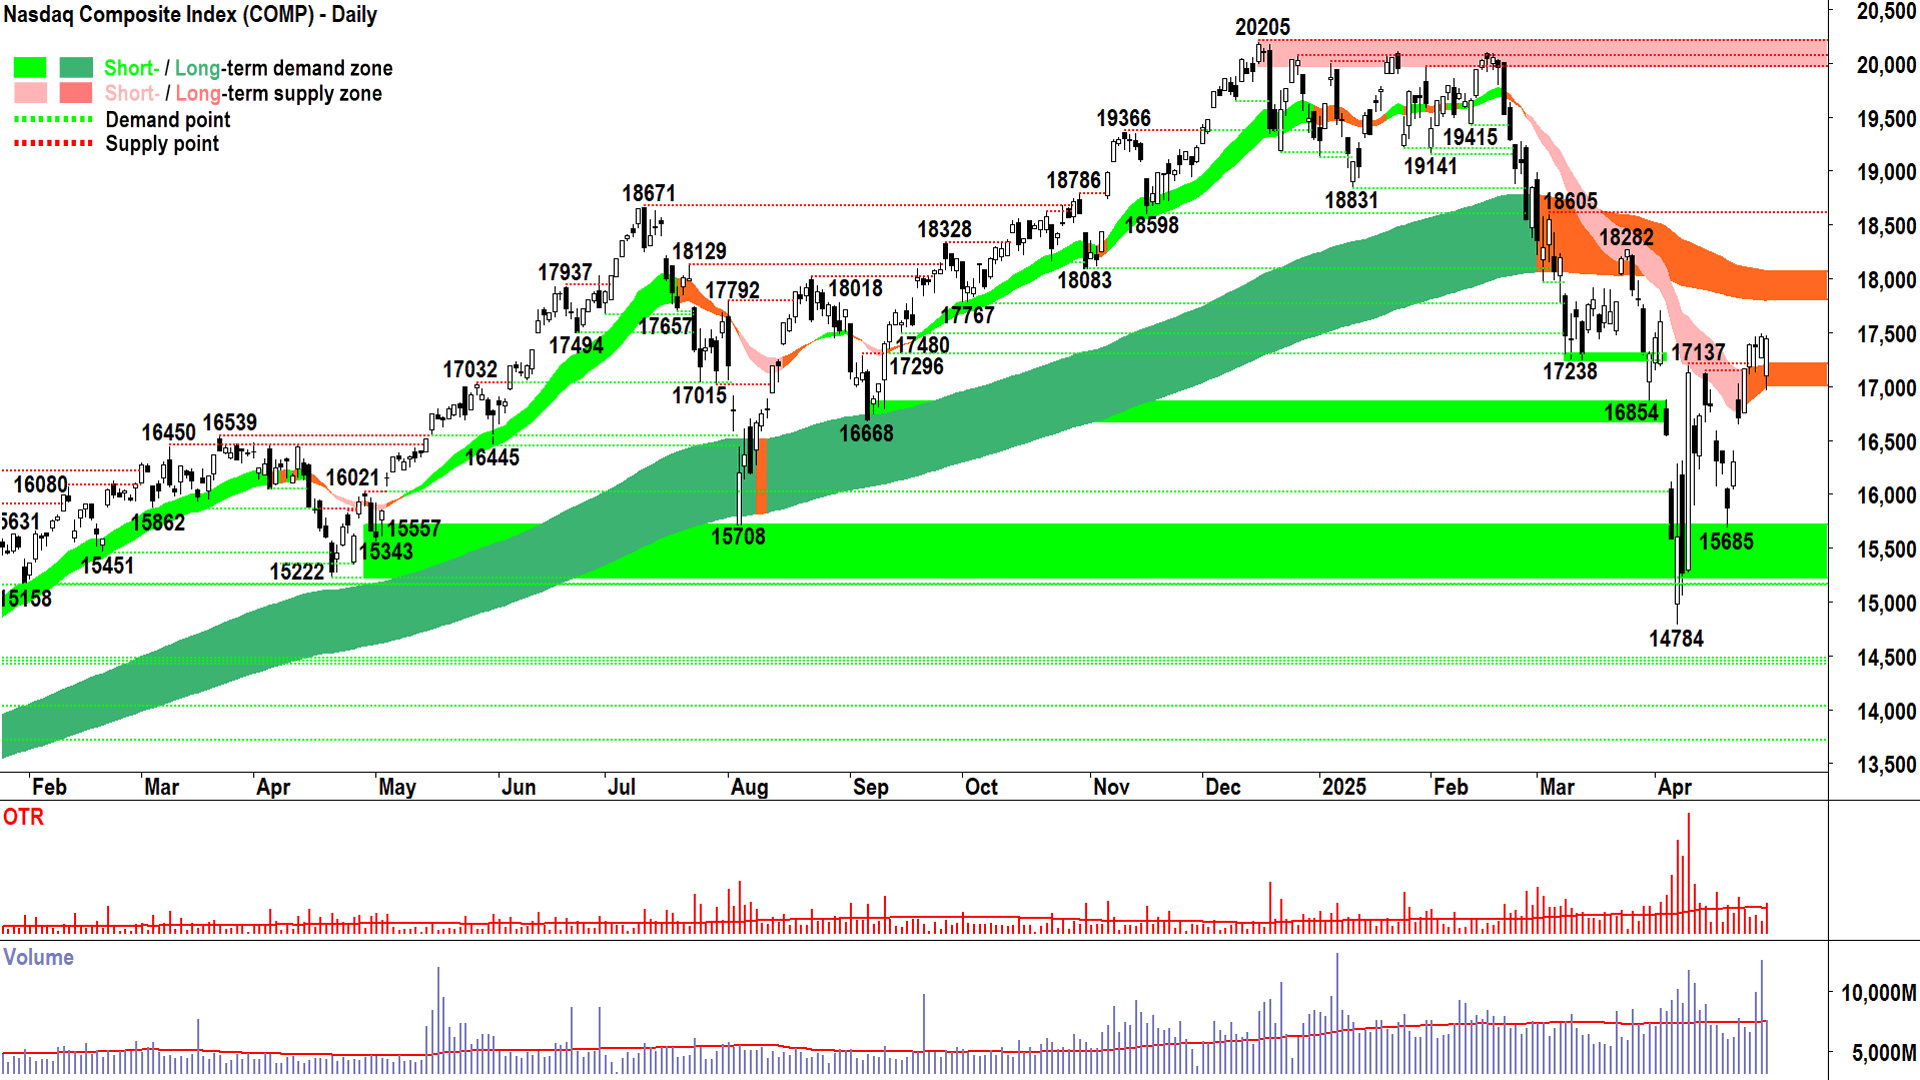
Demand was strong + Supply got out of town = Bullish indication (click here for full size image)
No doubt on your regular market news outlets you read something about the Nasdaq being down on Wednesday. Depending on whether you looked at the Comp chart before or after reading that useless piece of information, you knew better.
Wednesday’s price action remains consistent with the prevailing buy-the-dip mentality, and of our contention here that the demand-side is in control of at least short term price action.
If you’re new to ChartWatch, and have no idea what I’m referring to, no problems. The only way you can get a white coloured body (that’s the box part of the candle) is if the close is above the open for a trading session. The longer the white box, the greater the excess demand that drove prices during the session. The smaller the shadow on top of that box (that’s the line part of the candle above the box), the lesser was the supply lurking in the system wanting to sell into those higher prices.
Demand was strong + Supply got out of town = Bullish indication.
Consider though (looking up at the last two candles), that we have two white bodies side by side. Indeed, the Wednesday’s candle’s body starts much lower than Tuesday’s. This is because the Comp opened sharply lower than Tuesday’s close – and indeed lower than the prior day's low.
The only way this could have occurred is if there was a substantial amount of excess supply at Wednesday's open.
Note also, there’s a downward pointing shadow poking out from that last candle (that’s the line part of the candle below the box). This means that in addition to what could be argued as a panicked open, there was some follow through excess supply after the open. In short, it was a very bearish open.
This puts the ensuing rally, to close very near the top of the session and less than 15 points from the previous candle’s close into perspective – after that initial burst of “get me the hell out, the economy is tanking” selling – there was nothing but a wall of demand and a vacuum of supply.
I also note that Wednesday’s candle nicely held the dynamic demand zone of the short term uptrend ribbon.
So, in conclusion, Wednesday was a credible demand-side showing, and the bears must really be scratching their collective heads, wondering, “How is it possible this market is so damned strong!?”.
I prefer not to think too much about anything apart from trends, price action and candles. So, on the basis of these items, I maintain my view we’re more likely to continue to probe into overhead supply, most likely around the long term trend ribbon.
The truly emphatic nature of Wednesday’s price action stamps out for us an important point of demand in Wednesday’s low. Given it also coincides with the low of the short term uptrend ribbon, I think it’s safe to say that we can maintain our positive near term bias on the Comp until a close below that point – i.e., below 16959.
S&P/ASX 200 (XJO)
%20chart%2023%20April%202025.png)
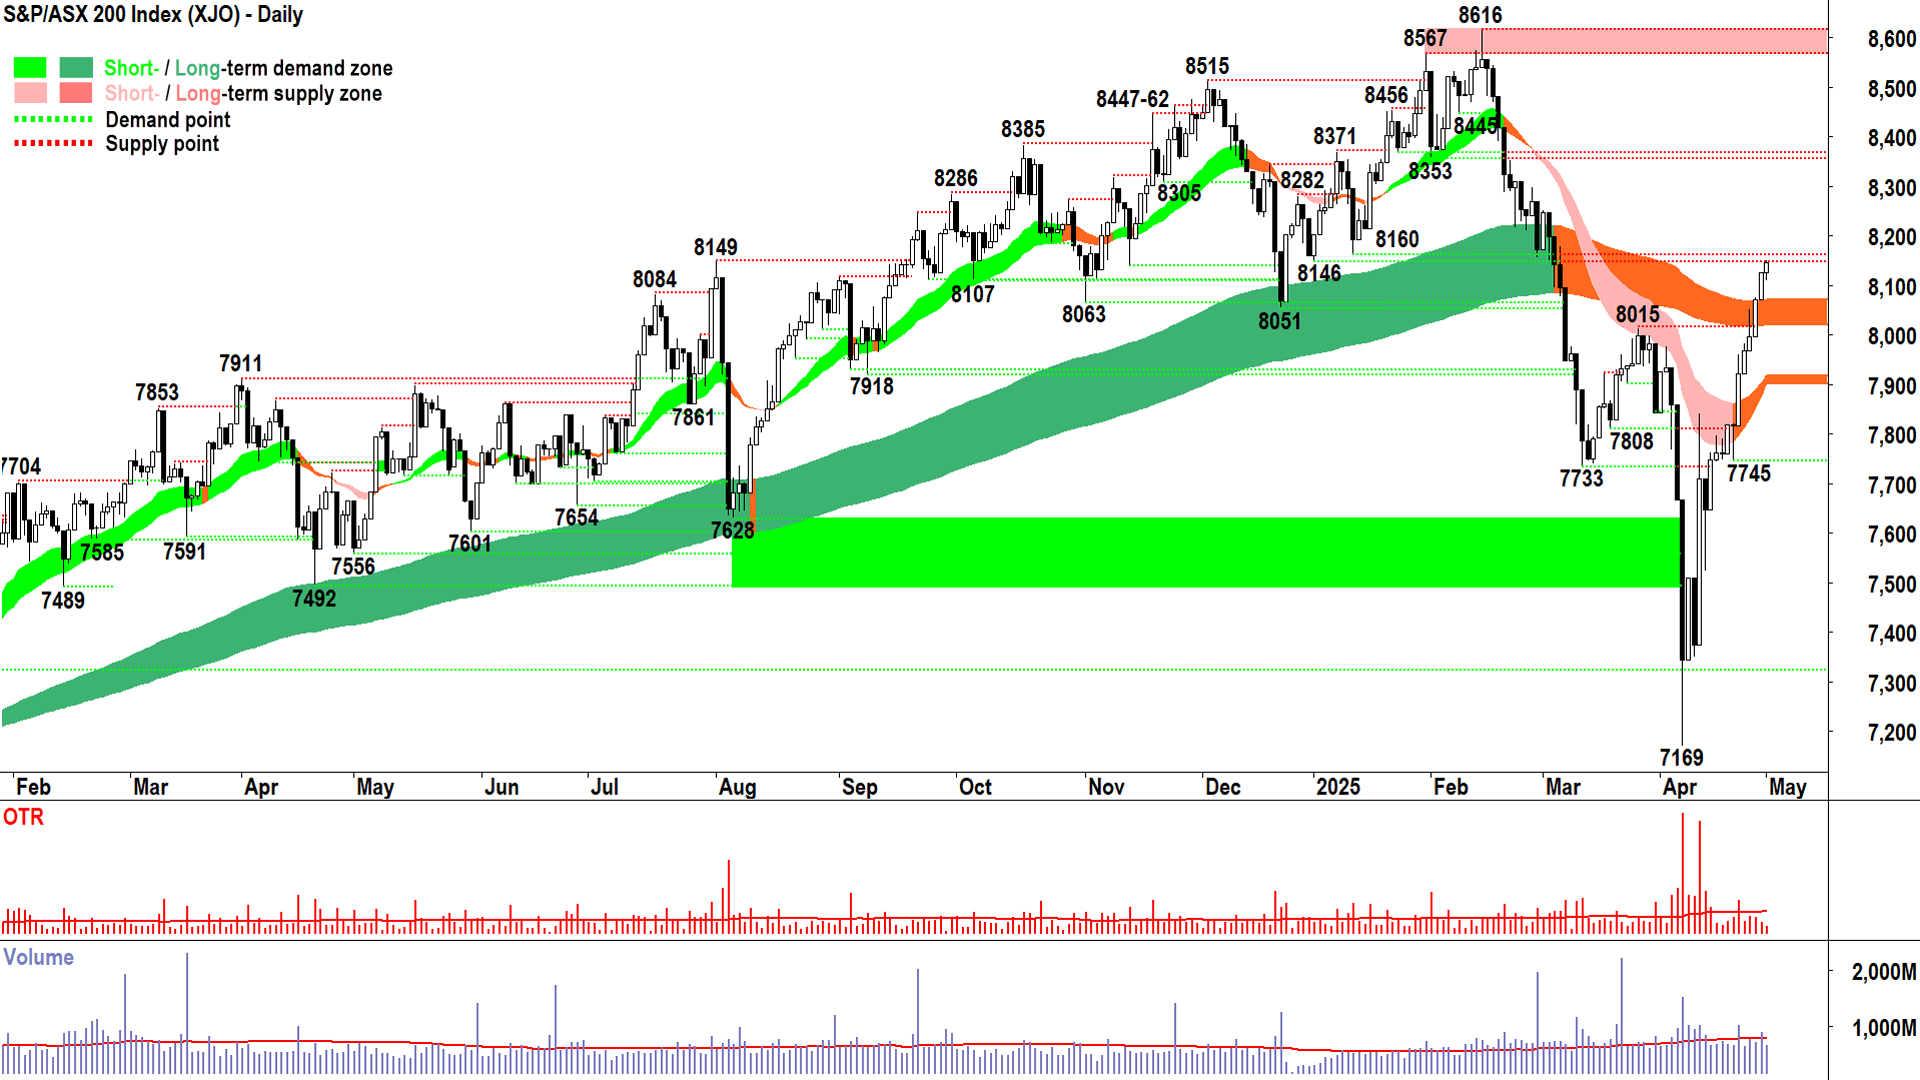
There’s probably not much to panic about (click here for full size image)
Not much to add here really.
Now 11 out of 15 white bodies since the 7169 low. Still V-shaped. Still indicative only of short term demand-side control.
Were just a shallow pullback to-and-hold of the long term trend ribbon to be able to confirm long term demand-side control / resumption of the long term uptrend.
I note there’s potentially a minor pressure point at the current price – i.e., from two historic points of demand at 8146-8160. Probably nothing to worry about, but old points of demand can act as future points of supply.
8353 is the more likely key upside point of supply pressure point.
The long term trend ribbon is the key zone of demand. 8015 is there or thereabouts also. I suggest that as long as the XJO closes above those points there’s probably not much to panic about.
Economy
Today
There weren't any major data releases in our time zone today
Later this week
Thursday
22:00 USA ISM Manufacturing PMI April (48.0 forecast vs 49.0 in March)
Friday
ALL DAY CHN May Day Bank Holiday
09:30 Retail Sales m/m March (+0.4% forecast and +0.2% in February)
20:30 Non-Farm Employment Data April
Employment Change m/m: +129,000 forecast vs +228,000 in March
Average Hourly Earnings m/m: +0.3% forecast vs +0.3% in March
Unemployment Rate: 4.2% forecast vs 4.2% in March
Saturday
ALL DAY AUS Parliamentary Elections (forecast 🤔???)
Latest News
Interesting Movers
Trading higher
+78.6% Andromeda Metals (ADN) – Andromeda Achieves HPA Breakthrough.
+41.7% Dimerix (DXB) – Dimerix Licenses DMX-200 in the US, rise is consistent with prevailing short and long term uptrends, a regular in ChartWatch ASX Scans Uptrends list 🔎📈
+21.0% AMA Group (AMA) – 3Q25 Quarterly Business Update, rise is consistent with prevailing short term uptrend and long term trend is transitioning from down to up, a regular in ChartWatch ASX Scans Uptrends list 🔎📈
+11.4% Platinum Asset Management (PTM) – PTM potential merger with L1 Capital.
+8.2% HMC Capital (HMC) – No news 🤔.
Trading lower
-16.9% Judo Capital (JDO) – Judo Q3 Trading Update.
-10.3% Antipa Minerals (AZY) – Shaw and Partners Gold Conference, general weakness across the broader Gold sector today.
-10.3% Coronado Global Resources (CRN) – No news since 30-Apr Q1 2025 Quarterly Activities Report, downgraded to hold from buy at Bell Potter, price target cut there and with other brokers (see Broker Moves section for details).
-9.5% Larvotto Resources (LRV) – No news since 30-Apr Quarterly Activities/Appendix 5B Cash Flow Report, general weakness across the broader Gold sector today.
-7.4% Brainchip (BRN) – No news 🤔.
Broker Moves
AIC Mines (A1M)
Retained at buy at Bell Potter; Price Target: $0.670 from $0.660
Actinogen Medical (ACW)
Retained at buy at Ord Minnett; Price Target: $1.330
Retained at buy at Shaw and Partners; Price Target: $1.300
Adriatic Metals (ADT)
Retained at buy at Canaccord Genuity; Price Target: $4.55 from $4.50
Aristocrat Leisure (ALL)
Retained at outperform at Macquarie; Price Target: $75.00
ALS (ALQ)
Retained at buy at Goldman Sachs; Price Target: $17.80
ASX (ASX)
Retained at sell at UBS; Price Target: $62.50
Australian Vanadium (AVL)
Retained at buy at Shaw and Partners; Price Target: $0.060
American West Metals (AW1)
Retained at buy at Shaw and Partners; Price Target: $0.200
Antipa Minerals (AZY)
Retained at buy at Shaw and Partners; Price Target: $0.660
Boab Metals (BML)
Retained at buy at Shaw and Partners; Price Target: $0.400
Beach Energy (BPT)
Retained at sell at Citi; Price Target: $1.150
Brightstar Resources (BTR)
Retained at buy at Shaw and Partners; Price Target: $1.140
Brambles (BXB)
Retained at sell at Goldman Sachs; Price Target: $18.70 from $18.35
Champion Iron (CIA)
Retained at buy at Bell Potter; Price Target: $6.20
Retained at buy at Citi; Price Target: $7.30 from $7.50
Retained at outperform at Macquarie; Price Target: $6.10
Collins Foods (CKF)
Retained at buy at Citi; Price Target: $9.60
Capricorn Metals (CMM)
Retained at hold at Bell Potter; Price Target: $9.03 from $8.77
Retained at buy at Canaccord Genuity; Price Target: $10.60
Retained at buy at Goldman Sachs; Price Target: $10.00 from $9.90
Retained at overweight at Jarden; Price Target: $9.28 from $9.04
Retained at neutral at Macquarie; Price Target: $8.40 from $8.20
Coles Group (COL)
Retained at hold at Bell Potter; Price Target: $22.10 from $21.15
Retained at hold at Jefferies; Price Target: $20.00
Retained at underweight at JP Morgan; Price Target: $20.00
Retained at outperform at Macquarie; Price Target: $23.10 from $22.00
Retained at overweight at Morgan Stanley; Price Target: $21.70
Retained at hold at Morgans; Price Target: $20.95 from $20.90
Retained at accumulate at Ord Minnett; Price Target: $22.00 from $21.00
Retained at outperform at RBC Capital Markets; Price Target: $22.00
Retained at buy at UBS; Price Target: $23.50
Coronado Global Resources (CRN)
Retained at buy at Argonaut Securities; Price Target: $0.700
Downgraded to hold from buy at Bell Potter; Price Target: $0.230 from $0.500
Retained at neutral at Goldman Sachs; Price Target: $0.300 from $0.350
Retained at hold at Jefferies; Price Target: $0.220 from $0.300
Retained at neutral at Macquarie; Price Target: $0.250 from $0.300
Cedar Woods Properties (CWP)
Retained at buy at Bell Potter; Price Target: $7.30 from $7.20
Retained at buy at Shaw and Partners; Price Target: $7.00
Dalrymple Bay Infrastructure/Notes (DBI)
Retained at add at Morgans; Price Target: $4.35 from $4.13
Deterra Royalties (DRR)
Retained at buy at Canaccord Genuity; Price Target: $4.90
Endeavour Group (EDV)
Retained at neutral at Citi; Price Target: $4.50
Firefly Metals (FFM)
Retained at buy at Shaw and Partners; Price Target: $1.900
GPT Group (GPT)
Retained at buy at Citi; Price Target: $5.00
Genetic Signatures (GSS)
Retained at buy at Bell Potter; Price Target: $0.750 from $1.050
Insurance Australia Group (IAG)
Retained at outperform at Macquarie; Price Target: $8.50
IGO (IGO)
Retained at buy at Argonaut Securities; Price Target: $6.20
Retained at sell at Bell Potter; Price Target: $3.25 from $3.85
Retained at hold at Canaccord Genuity; Price Target: $3.60 from $3.50
Retained at buy at Citi; Price Target: $4.40 from $4.00
Retained at hold at CLSA; Price Target: $3.70 from $3.30
Retained at outperform at Macquarie; Price Target: $5.50
Retained at equal-weight at Morgan Stanley; Price Target: $3.50
Retained at neutral at UBS; Price Target: $4.30
Jupiter Mines (JMS)
Retained at outperform at Macquarie; Price Target: $0.230
Kingsgate Consolidated (KCN)
Retained at buy at Canaccord Genuity; Price Target: $4.00
Retained at buy at Canaccord Genuity; Price Target: $0.000
Light & Wonder (LNW)
Retained at outperform at Macquarie; Price Target: $198.00
Lotus Resources (LOT)
Retained at buy at Canaccord Genuity; Price Target: $0.310 from $0.340
Retained at buy at Ord Minnett; Price Target: $0.350
Metals Acquisition (MAC)
Retained at buy at Canaccord Genuity; Price Target: $20.50
Microba Life Sciences (MAP)
Retained at buy at Morgans; Price Target: $0.320 from $0.340
Mirvac Group (MGR)
Retained at neutral at Citi; Price Target: $2.30 from $2.20
Mineral Resources (MIN)
Retained at sell at Goldman Sachs; Price Target: $21.00 from $18.00
Mesoblast (MSB)
Retained at buy at Bell Potter; Price Target: $3.40
Nickel Industries (NIC)
Retained at buy at Citi; Price Target: $0.900 from $1.000
Northern Star Resources (NST)
Downgraded to hold from buy at Bell Potter; Price Target: $20.85 from $22.15
Ora Banda Mining (OBM)
Retained at buy at Canaccord Genuity; Price Target: $1.250 from $1.200
Origin Energy (ORG)
Retained at buy at Citi; Price Target: $11.50
Retained at neutral at Goldman Sachs; Price Target: $10.15 from $10.05
Retained at neutral at Jarden; Price Target: $10.25 from $10.00
Retained at neutral at Macquarie; Price Target: $10.00 from $9.94
Retained at buy at UBS; Price Target: $11.70
Peninsula Energy (PEN)
Retained at buy at Shaw and Partners; Price Target: $1.000
Peoplein (PPE)
Downgraded to speculative buy from add at Morgans; Price Target: $1.050 from $1.400
Retained at buy at Ord Minnett; Price Target: $1.060 from $1.150
Perseus Mining (PRU)
Retained at buy at Argonaut Securities; Price Target: $4.90 from $5.00
Retained at buy at Canaccord Genuity; Price Target: $5.00
Retained at neutral at Citi; Price Target: $3.50
Retained at buy at Euroz Hartleys; Price Target: $3.95
Retained at outperform at Macquarie; Price Target: $3.80
Retained at buy at UBS; Price Target: $4.40 from $4.60
QBE Insurance Group (QBE)
Retained at buy at Goldman Sachs; Price Target: $25.00
Regis Resources (RRL)
Downgraded to accumulate from buy at Bell Potter; Price Target: $4.57 from $4.34
Retained at hold at Canaccord Genuity; Price Target: $4.10 from $3.95
Downgraded to neutral from outperform at Macquarie; Price Target: $4.30
Retained at add at Morgans; Price Target: $4.80 from $4.65
Retained at outperform at RBC Capital Markets; Price Target: $4.80
Retained at neutral at UBS; Price Target: $4.20
Stockland (SGP)
Retained at buy at Citi; Price Target: $6.00 from $5.80
Downgraded to hold from outperform at CLSA; Price Target: $5.60 from $5.58
Suncorp Group (SUN)
Retained at neutral at Macquarie; Price Target: $19.20
Turaco Gold (TCG)
Retained at buy at Canaccord Genuity; Price Target: $0.800
Titomic (TTT)
Retained at buy at Shaw and Partners; Price Target: $0.300
Woodside Energy Group (WDS)
Retained at hold at Ord Minnett; Price Target: $27.00
Westgold Resources (WGX)
Retained at outperform at Macquarie; Price Target: $3.50 from $3.70
Retained at buy at Ord Minnett; Price Target: $3.65 from $3.85
Woolworths Group (WOW)
Retained at outperform at Macquarie; Price Target: $30.80
Wisetech Global (WTC)
Retained at buy at Citi; Price Target: $115.00
Wisr (WZR)
Retained at buy at Shaw and Partners; Price Target: $0.067 from $0.060
Scans
Top Gainers
Code | Company | Last | % Chg |
|---|---|---|---|
| ADN | Andromeda Metals Ltd | $0.025 | +78.57% |
| PSL | Paterson Resources Ltd | $0.018 | +50.00% |
| DXB | Dimerix Ltd | $0.68 | +41.67% |
| NPM | Newpeak Metals Ltd | $0.012 | +33.33% |
| DKM | Duketon Mining Ltd | $0.16 | +23.08% |
Top Fallers
Code | Company | Last | % Chg |
|---|---|---|---|
| DY6 | DY6 Metals Ltd | $0.078 | -52.73% |
| WOA | Wide Open Agriculture Ltd | $0.026 | -26.76% |
| ARN | Aldoro Resources Ltd | $0.35 | -26.32% |
| BLG | Bluglass Ltd | $0.012 | -25.00% |
| EG1 | Evergreen Lithium Ltd | $0.038 | -22.45% |
52 Week Highs
Code | Company | Last | % Chg |
|---|---|---|---|
| ADN | Andromeda Metals Ltd | $0.025 | +78.57% |
| DXB | Dimerix Ltd | $0.68 | +41.67% |
| DKM | Duketon Mining Ltd | $0.16 | +23.08% |
| AMA | AMA Group Ltd | $0.075 | +20.97% |
| NH3 | NH3 Clean Energy Ltd | $0.027 | +8.00% |
52 Week Lows
Code | Company | Last | % Chg |
|---|---|---|---|
| BLG | Bluglass Ltd | $0.012 | -25.00% |
| EXL | Elixinol Wellness Ltd | $0.015 | -21.05% |
| CRN | Coronado Global Resources Inc | $0.175 | -10.26% |
| FUL | Fulcrum Lithium Ltd | $0.07 | -10.26% |
| HCF | H&G High Conviction Ltd | $0.045 | -10.00% |
Near Highs
Code | Company | Last | % Chg |
|---|---|---|---|
| WVOL | Ishares MSCI World Ex Aust Minimum Volatility ETF | $44.04 | +1.01% |
| AII | Almonty Industries Inc | $2.75 | +3.38% |
| IAGPF | Insurance Australia Group Ltd | $104.18 | -0.14% |
| GCI | Gryphon Capital Income Trust | $2.03 | -0.49% |
| IHD | Ishares S&P/ASX DIV Opportunities Esg Screened ETF | $14.48 | +0.07% |
Relative Strength Index (RSI) Oversold
Code | Company | Last | % Chg |
|---|---|---|---|
| NWSLV | News Corporation | $41.25 | -0.72% |
| CRN | Coronado Global Resources Inc | $0.175 | -10.26% |
| AOF | Australian Unity Office Fund | $0.485 | +1.04% |
| CTT | Cettire Ltd | $0.43 | -4.44% |
| MPW | Metal Powder Works Ltd | $0.455 | -3.19% |
