ChartWatch ASX Scans: APA Group, Alpha HPA, Atlas Arteria, Artrya, Deep Yellow, Mesoblast, Polymetals, Starpharma
Your daily dose of the most actionable uptrends and downtrends on the ASX based on expert technical analysis.


Source: Shutterstock
Mentioned
KEY POINTS
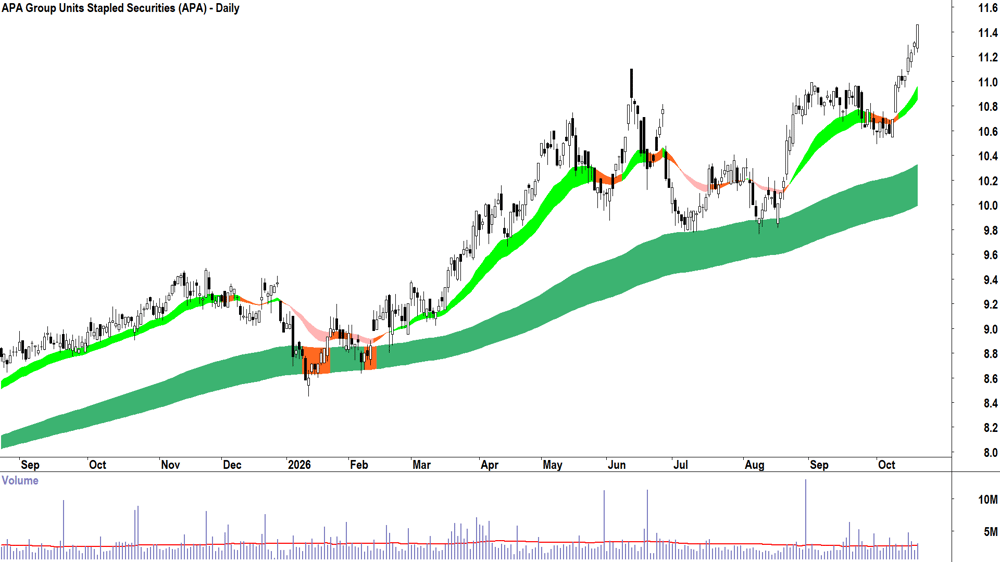
- Today’s most interesting uptrend: APA (APA).
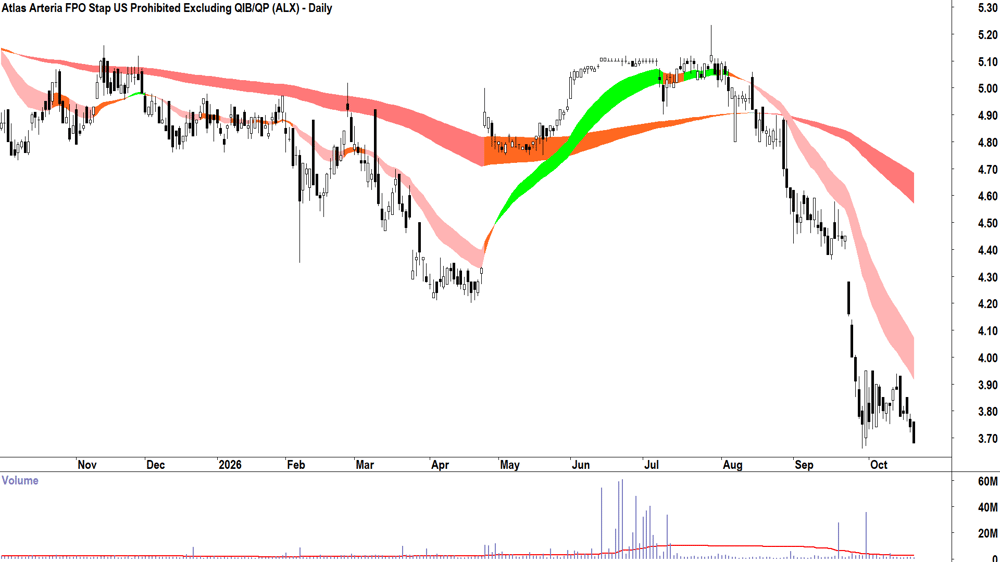
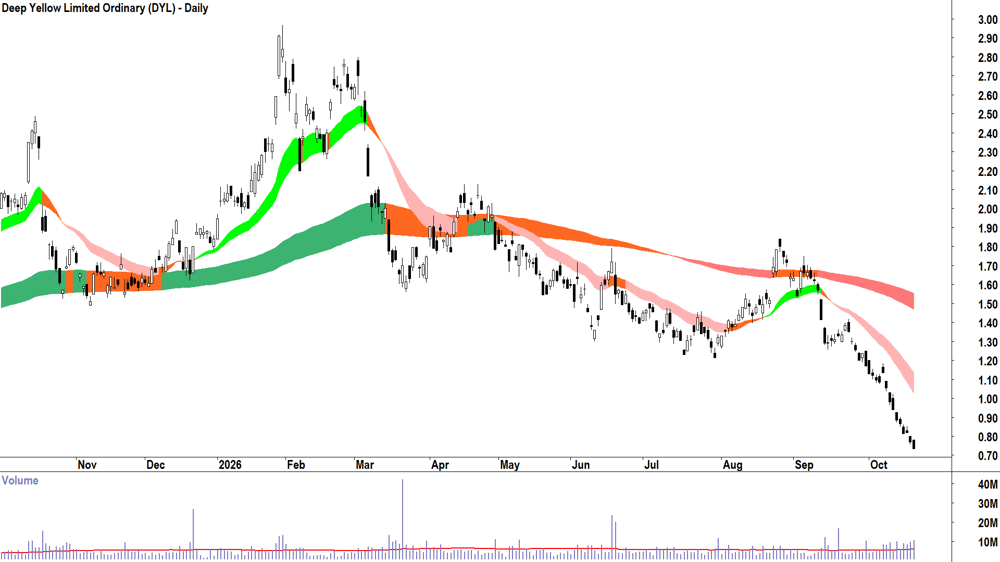
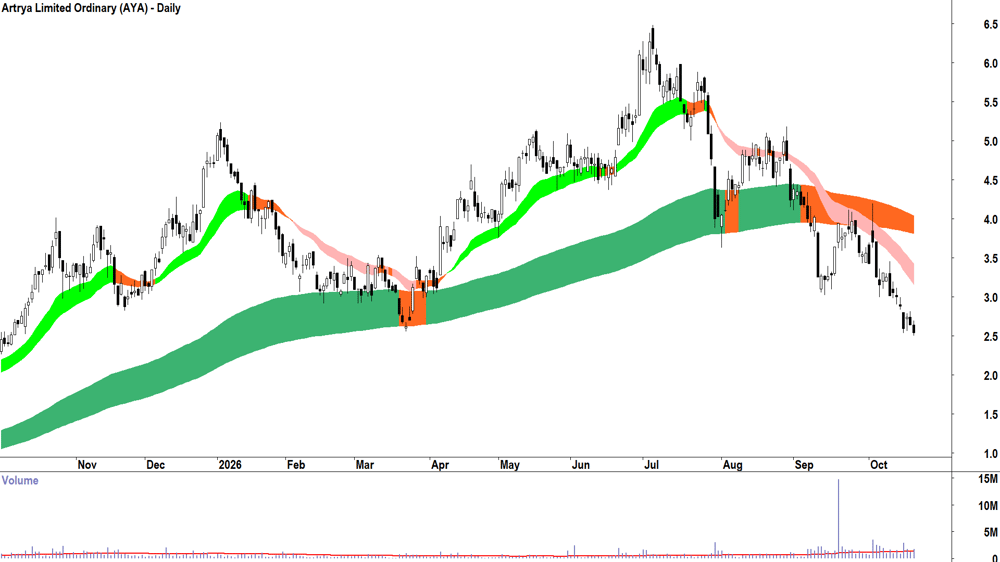
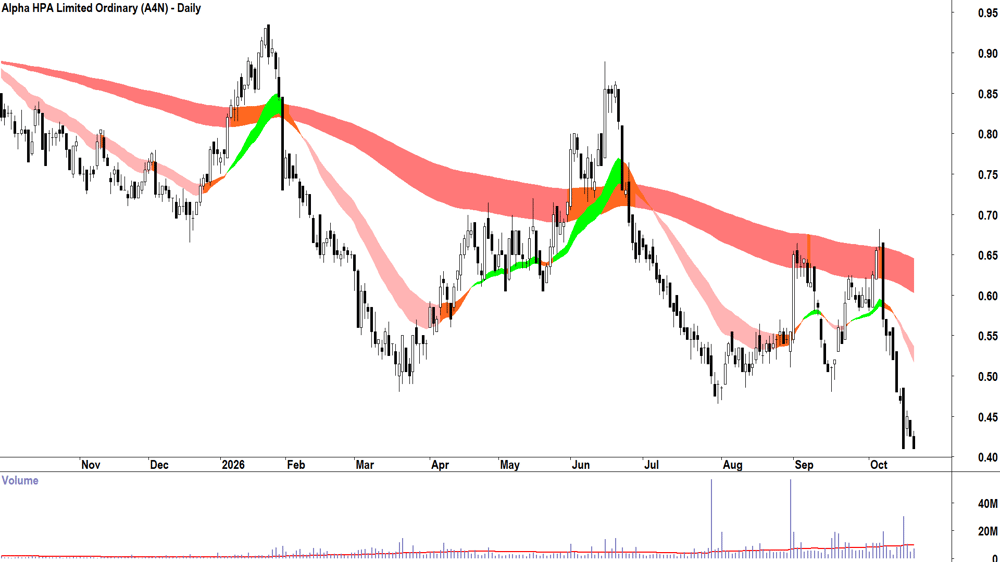
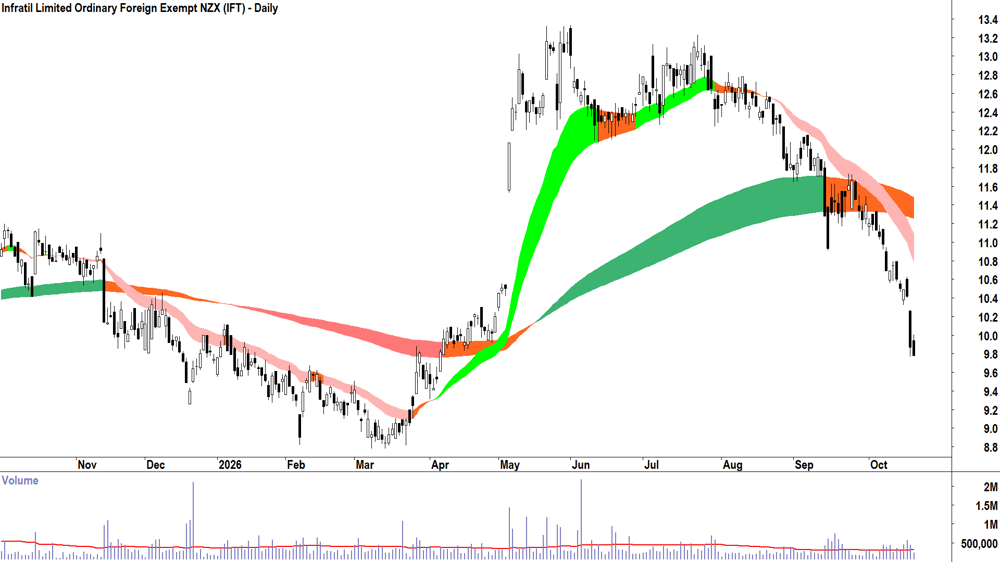
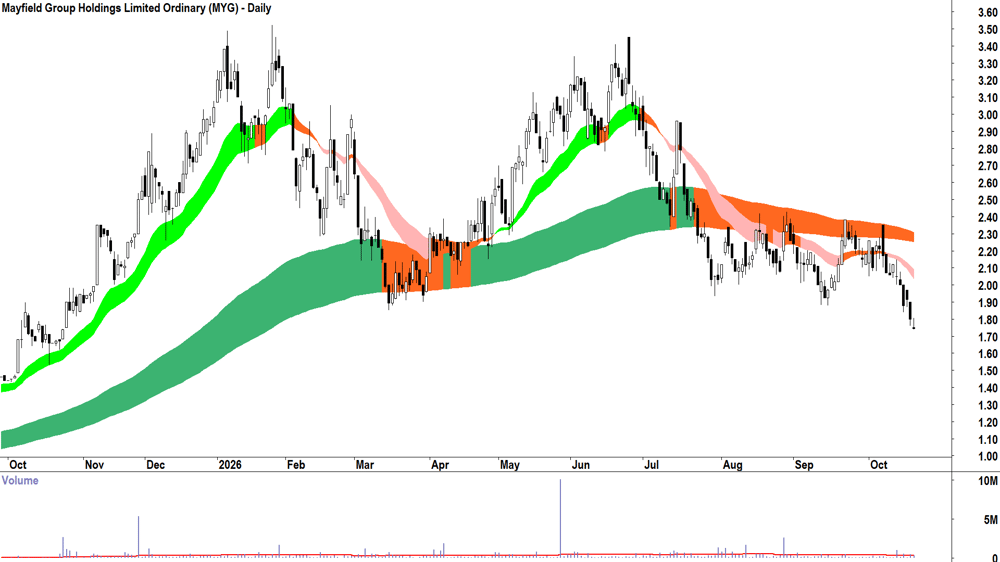
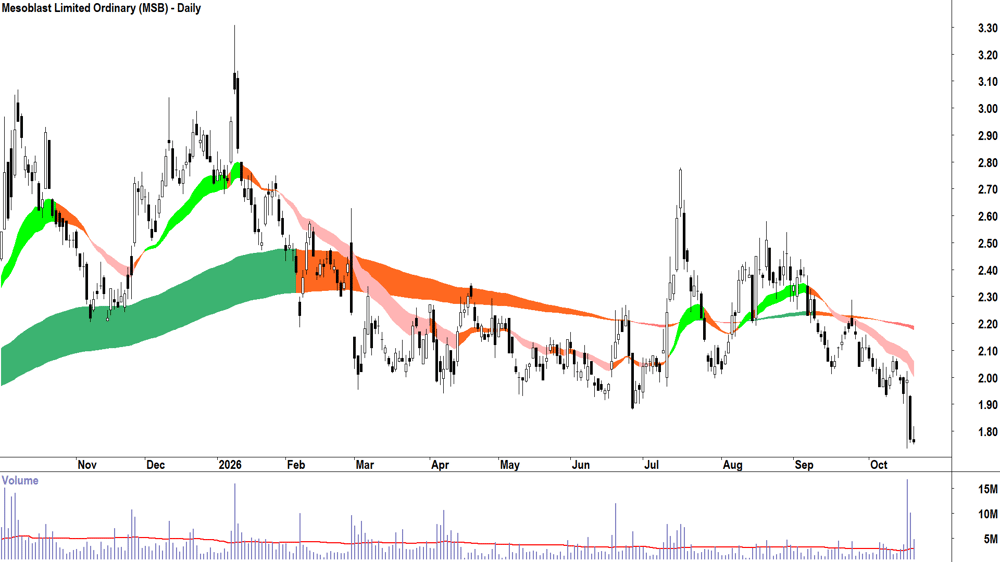
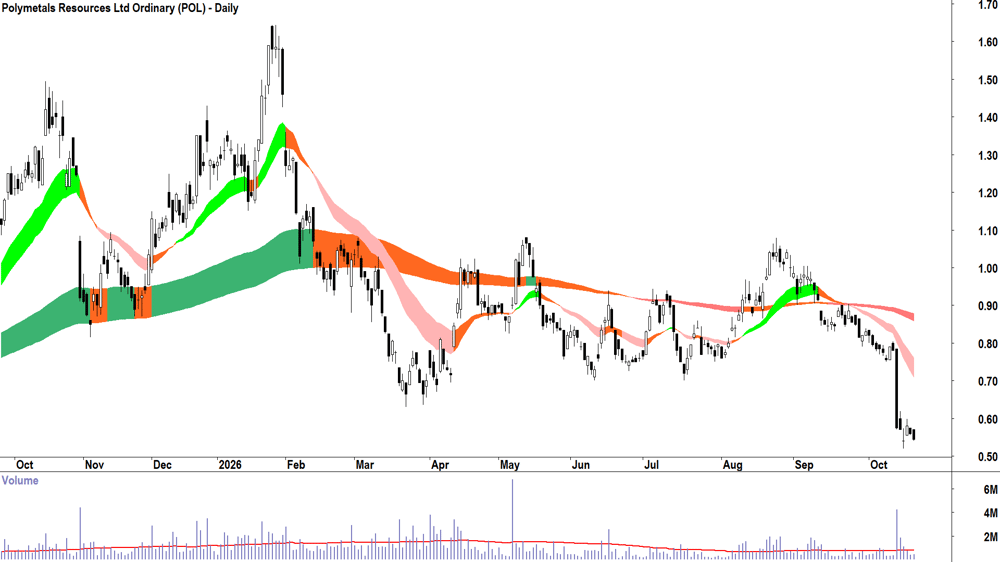
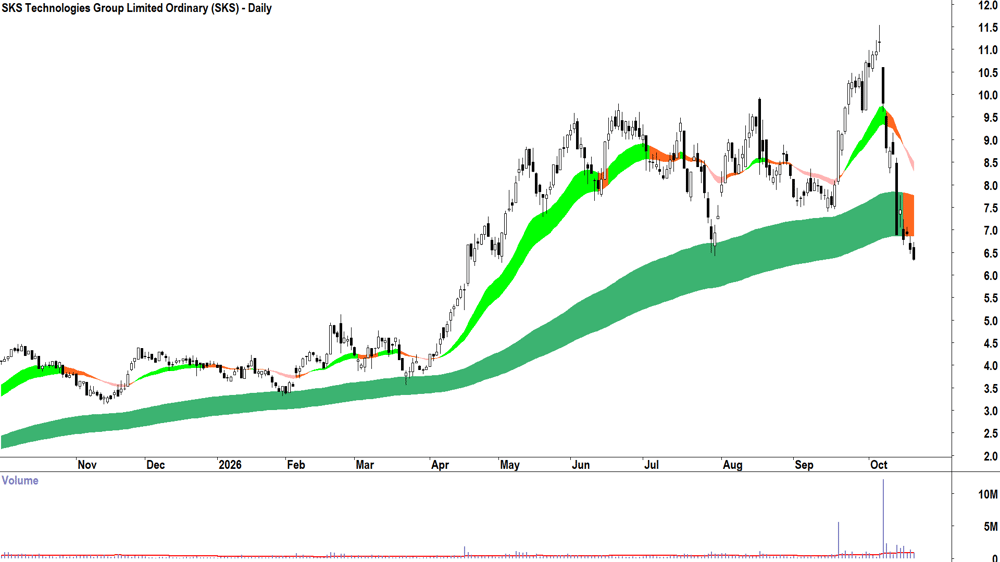
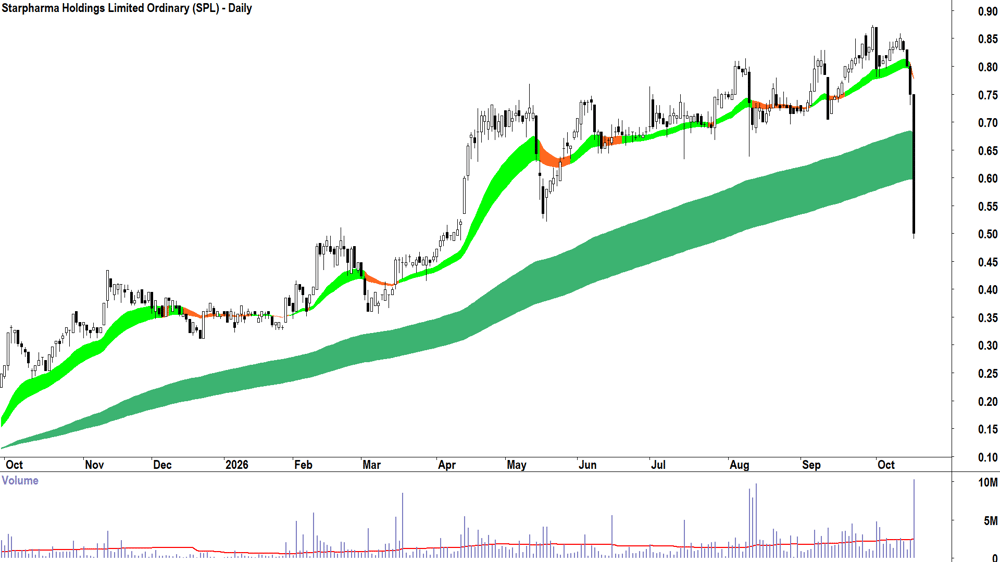
- Today’s most interesting downtrends: Alpha HPA (A4N), Atlas Arteria (ALX), Artrya (AYA), Deep Yellow (DYL), Infratil (IFT), Mesoblast (MSB), Mayfield (MYG), Polymetals Resources (POL), SKS Technologies (SKS), Starpharma (SPL).
Welcome to my ChartWatch Daily ASX Scans series. Here, I present scan lists based on my trend following technical analysis methodology. My goal is to alert you to the best uptrends and downtrends on the ASX. You can also watch these videos 📺 in which I perform live analysis of ASX stocks as requested by viewers, including detailed explanations of how my technical model works.
How to use the Uptrends & Downtrends lists, and Feature Chart lists
Feel free to get your favourite AI to convert the tables below into lists you can upload to your favourite trading platform like TradingView. Then you'll be able to skip from chart to chart and quickly and easily see the best uptrends and downtrends on the ASX.
Some investors prefer to buy those stocks in strong uptrends, and avoid, sell, or short sell those stocks in strong downtrends – but how you use my ChartWatch lists is really up to you!
Note, many stocks in both lists have appeared there many times before. As long as they keep meeting my criteria – they'll keep appearing. But note, there won't be any notifications when they don't – so you'll have to do your own research on when a particular trend has changed!
Uptrends Scan List 📈
Company | Code | Last Price | 1mo % | 1yr % | Mkt Cap |
|---|---|---|---|---|---|
APA | APA | $11.46 | +5.4% | +26.1% | $15.3b |
Bluescope Steel | BSL | $32.83 | +9.6% | +65.9% | $14.4b |
Collins Foods | CKF | $8.98 | +13.4% | -15.5% | $1.1b |
Coles | COL | $24.25 | +5.7% | +5.0% | $32.6b |
EVT | EVT | $14.98 | +11.3% | +16.3% | $2.4b |
Fisher & Paykel Healthcare | FPH | $39.90 | +11.6% | +27.4% | $23.5b |
Woolworths | WOW | $41.61 | +9.2% | +55.7% | $50.8b |
Today's Uptrends Scan List
Feature Charts from today's Uptrends List 🔎
The stock that I feel is showing the strongest excess demand from today's Uptrends List is: APA Group (APA).
Feature Uptrend Chart:
ChartWatch *LIVE* Webinar
ChartWatch *LIVE* Webinars – WEEKLY Wednesday's @ 12pm AEDT
Learn more about technical analysis and trend following through real case studies on ASX stocks. Australia's premier technical analyst, Carl Capolingua, shares his unique insights on stocks as requested by viewers. Ask about a company in your portfolio or anything related to trading and investing and get Carl's expert opinion.
Places are limited so >REGISTER NOW!<
Downtrends Scan List 📉
Company | Code | Last Price | 1mo % | 1yr % | Mkt Cap |
|---|---|---|---|---|---|
Alpha HPA | A4N | $0.410 | -24.1% | -50.3% | $595.3m |
Aussie Broadband | ABB | $4.00 | -5.0% | -31.7% | $1.2b |
Atlas Arteria | ALX | $3.68 | -17.1% | -24.6% | $5.3b |
Andean Silver | ASL | $1.500 | -24.2% | -25.0% | $345.3m |
Artrya | AYA | $2.54 | -32.6% | -22.8% | $415.6m |
Boab Metals | BML | $0.325 | -27.0% | -31.6% | $188.0m |
Centuria Industrial Reit | CIP | $2.75 | -3.5% | -20.3% | $1.7b |
Cromwell Property | CMW | $0.315 | -11.3% | -32.3% | $824.9m |
Duratec | DUR | $1.980 | -7.0% | -1.5% | $516.8m |
Deep Yellow | DYL | $0.735 | -44.9% | -68.3% | $716.2m |
HOT Chili | HCH | $1.410 | -8.1% | +41.0% | $286.1m |
HMC Capital | HMC | $2.70 | -16.9% | -19.9% | $1.1b |
Infratil | IFT | $9.78 | -13.2% | -11.1% | $9.8b |
Imricor Medical Systems | IMR | $1.375 | -22.8% | -10.1% | $127.8m |
Ioneer | INR | $0.100 | -13.0% | -60.0% | $308.8m |
Jupiter Mines | JMS | $0.235 | -4.1% | -7.8% | $462.0m |
Metro Mining | MMI | $0.820 | -36.2% | -41.4% | $253.2m |
Mesoblast | MSB | $1.760 | -17.4% | -32.8% | $2.3b |
Metallium | MTM | $0.210 | -45.5% | -81.7% | $158.6m |
Mayfield | MYG | $1.745 | -22.8% | -1.4% | $204.8m |
Nova Minerals | NVA | $0.385 | -45.8% | -3.8% | $176.4m |
NRW | NWH | $6.70 | -16.4% | +37.3% | $3.1b |
Polymetals Resources | POL | $0.545 | -37.7% | -55.7% | $168.1m |
Pepper Money | PPM | $1.670 | -1.8% | -22.3% | $750.5m |
Rural Funds | RFF | $1.880 | -3.1% | -2.1% | $732.7m |
Regal Partners | RPL | $2.04 | -10.9% | -37.2% | $849.0m |
South32 | S32 | $4.40 | -9.7% | +36.6% | $19.7b |
Sims | SGM | $20.55 | -15.3% | +49.1% | $4.0b |
SKS Technologies | SKS | $6.35 | -30.3% | +62.0% | $733.1m |
Santana Minerals | SMI | $0.415 | -20.2% | -55.9% | $409.1m |
Spark New Zealand | SPK | $1.505 | -6.5% | -28.0% | $2.9b |
Starpharma | SPL | $0.500 | -35.1% | +83.3% | $239.9m |
Smart Parking | SPZ | $0.640 | -20.0% | -39.0% | $266.7m |
Sunrise Energy Metals | SRL | $14.40 | -20.7% | +268.3% | $2.5b |
Saturn Metals | STN | $0.425 | -18.3% | -26.1% | $319.7m |
Terra Metals | TM1 | $0.130 | -33.3% | -13.3% | $134.1m |
Unico Silver | USL | $0.600 | -24.5% | -3.2% | $432.8m |
Virgin Australia | VGN | $2.43 | -11.6% | -29.6% | $1.9b |
Vysarn | VYS | $0.710 | -12.9% | +19.3% | $427.3m |
Today's Downtrends Scan List
Feature Charts from today's Downtrends List 🔎
The stocks that I feel are showing the strongest excess supply from today's Downtrends List are: Alpha HPA (A4N), Atlas Arteria (ALX), Artrya (AYA), Deep Yellow (DYL), Infratil (IFT), Mesoblast (MSB), Mayfield (MYG), Polymetals Resources (POL), SKS Technologies (SKS), Starpharma (SPL).
Feature Downtrend Charts:
Important considerations for using the ChartWatch Daily ASX Scans
1. For more information on Carl's trend following information, check out his Technical analysis for beginners: ChartWatch Primer. 2. The future is unknown: Anything can happen to change the trends in the lists above. A stock in a perfect uptrend or downtrend may not remain that way by the next trading today. 3. These lists are not exhaustive, they are carefully curated by Carl. You will find that certain stocks might not appear in a particular list on consecutive days but might reappear when Carl feels it deserves to return to the list. 4. This is not a recommendation service, merely an aid to help you better understand the workings of Carl’s technical analysis model in a practical way. Carl will not alert you to stocks that have dropped off a list because their trend has changed – it's up to you to apply the criteria to determine why a particular stock might not still be included. 5. This is general, educational information only – so always do your own research!!!