ChartWatch Markets: Welcome to a new bull market in uranium, but not lithium (yet!) Plus the hottest ASX uranium stocks to watch
Technical analysis of the most important global stock indices, commodities, bonds, FX, and crypto impacting your ASX portfolio each day.


Source: Shutterstock
Mentioned
KEY POINTS
- Finally, some supply has arrived on the Nasdaq Composite, but it is yet to threaten even the closest key points of demand.
- In Monday’s edition of ChartWatch Markets we noted that uranium had likely started a new bull market phase, but that one final point of confirmation was required… Well guess what!?
- Lithium has been flirting with its own major transition from bear market to bull market, but unlike uranium, its recent price action has been far from inspiring. What will it take to trigger lithium’s bull market?
In today's edition of ChartWatch Markets, we'll be covering:
Nasdaq Composite
Uranium Futures (Front month, back-adjusted) COMEX
Highlighting several ASX Uranium stocks that have featured in my Uptrends Scans Lists
Lithium Carbonate Futures (Benchmark month, back-adjusted) GFEX
Nasdaq Composite Index

Don't fear the next candle! (click here for full size image)
In our last update on Tuesday, we only had perfect trends, price action, and candles to look at ✅✅✅.
We know as trend followers, this is merely a snapshot of the demand-supply environment at an instant – i.e., at the close of regular trading in New York on Monday at 4:30pm.
It says nothing of how the world’s most influential stock market will trade at 9:30am on Tuesday morning!
The circumstances that drive demand and supply are not static. They are constantly changing and therefore, are constantly being assessed and reassessed by those who control cash and stock (i.e., demand and supply).
As trend followers, we accept that the perfect picture of demand-side control depicted on Monday’s candle can look like anything else by the close of Tuesday’s candle. It really is that simple.
Yet, we don’t fear the next candle because we have a rock-solid method for assessing what it implies about changing demand-supply dynamics – but more importantly – what it requires from our risk allocation.
That’s a bit of a long winded intro… Yes, I could have just said:
We are trend followers, not prognosticators. We can’t tell the future, so we simply make our best bets based upon the information we have. Stuff’s gonna happen, things are gonna change – our job is to do the analysis and allocate the risk. Decisively, with consistency and discipline.
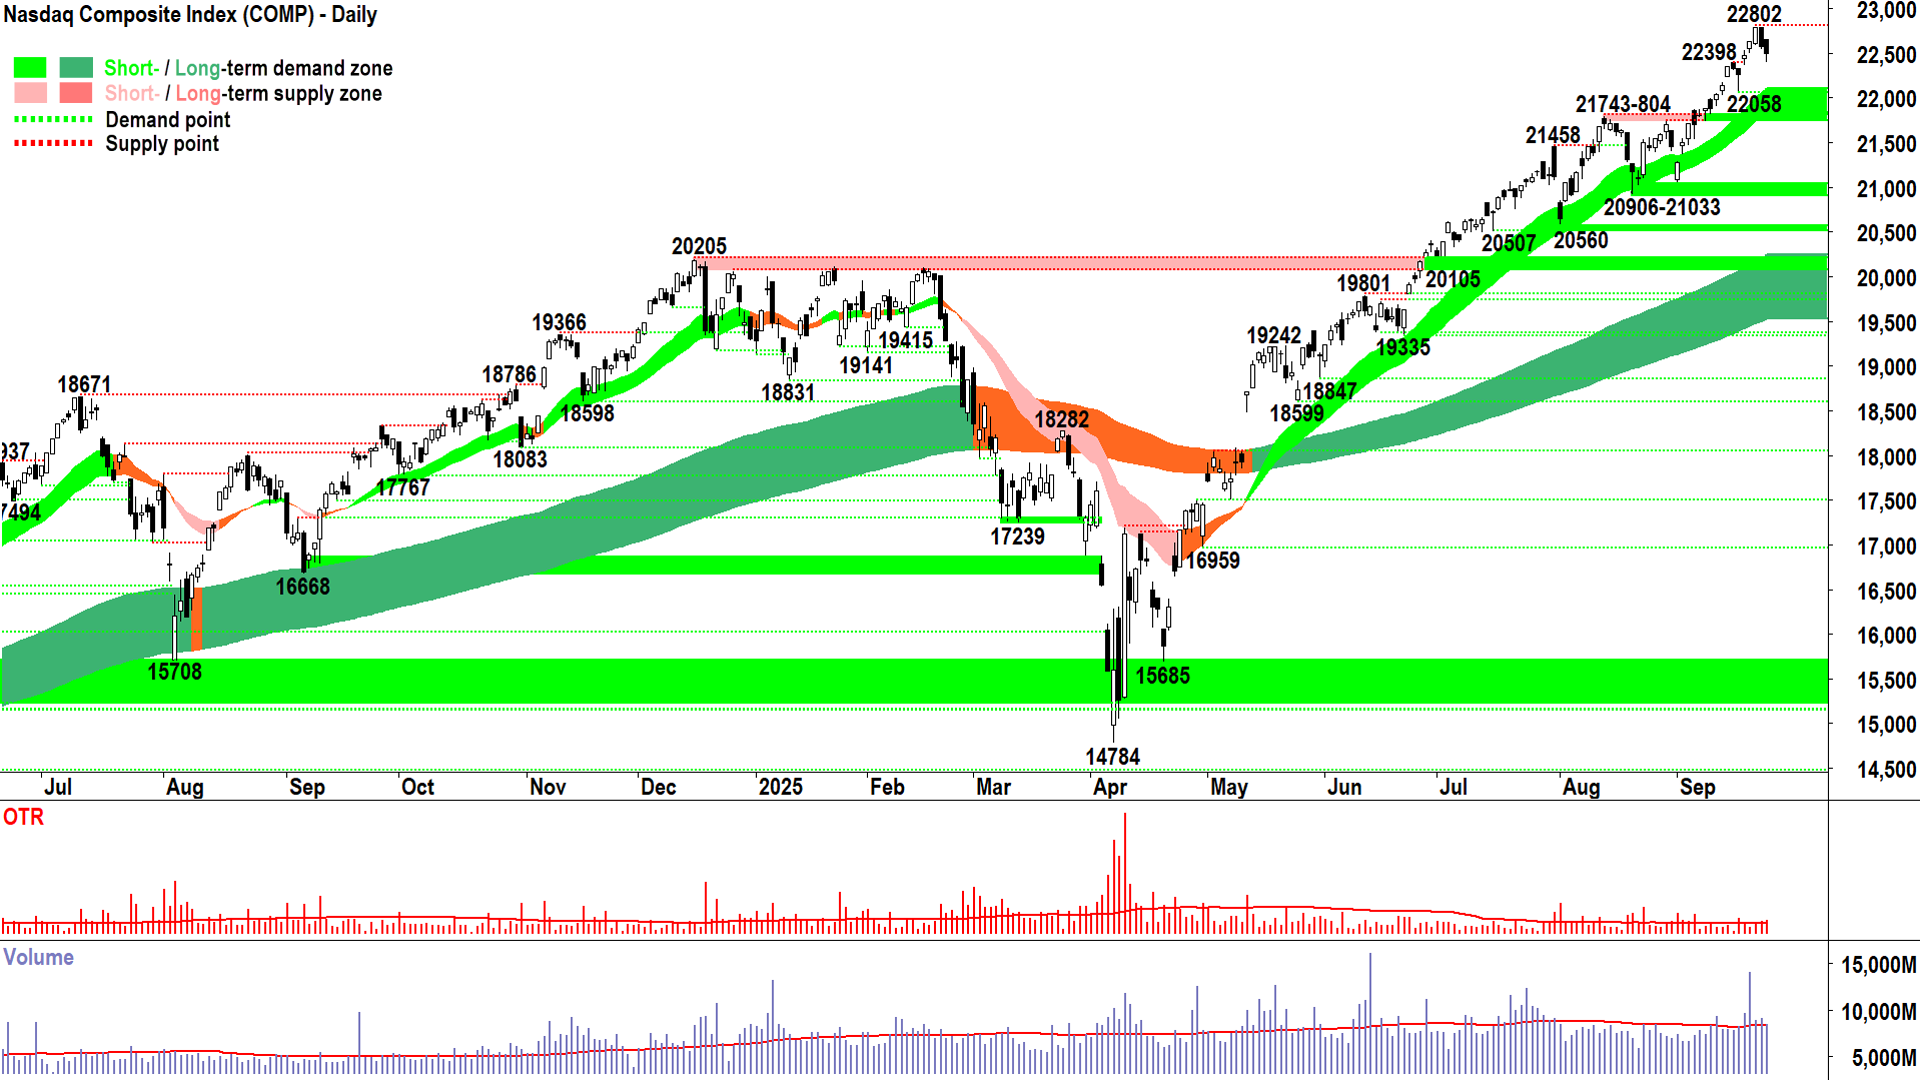
Not that I think there’s anything really sinister about Tuesday’s and Wednesday’s supply-side candles! They’re not what we as “bulls in a bull market” prefer, but they are typical of the ebb-and-flow of a bull market. Nothing goes up in a straight line forever. Something will inevitably occur to trigger the release of sufficient supply to check and then overwhelm demand for a session… or two sessions… or however many.
The important thing is how the demand-side responds, and just as importantly, does the supply-side grow more urgent in their activities?
That’s a wait and see for me, two supply side candles of the magnitude we’ve seen is a bit “meh”. Order of magnitude, two supply-side candles have nullified the two prior demand-side candles. Otherwise, short and long term trends and price action remain intact.
Previous points of supply tend to act as points of demand. So, 22398 should in theory be a minor demand-side pressure point – so far it is holding – and that’s a positive. Even if it should slip, 22058 and the dynamic excess demand of the short term uptrend ribbon (presently 21830-22105) is the key level for determining demand-or-supply-side control in the short term.
So, in summary, I see no reason yet to change my personal portfolio risk positioning here. I am watchful (as always), for further signs that the supply-side is gaining increasing control over the Comp’s price, such as:
Long black candles and or those with long upward pointing shadows = short term motivated excess supply and sell the rally activity.
A lower peak to 22802, and or a lower trough to 22058 = supply reinforcement and demand removal respectively.
A close below the short term uptrend ribbon = negates the short term uptrend = ⚠️.
In the meantime, there’s a bloody great big bull market in the chart above that one cannot ignore = Stay the course, FRP (Full Risk Position).
Uranium Futures (Front month, back-adjusted) COMEX
%20COMEX%20chart_24%20Sep.png)
Welcome to the new uranium bull market (click here for full size image)
The last time covered uranium was in ChartWatch Markets on Monday 22-Sep.
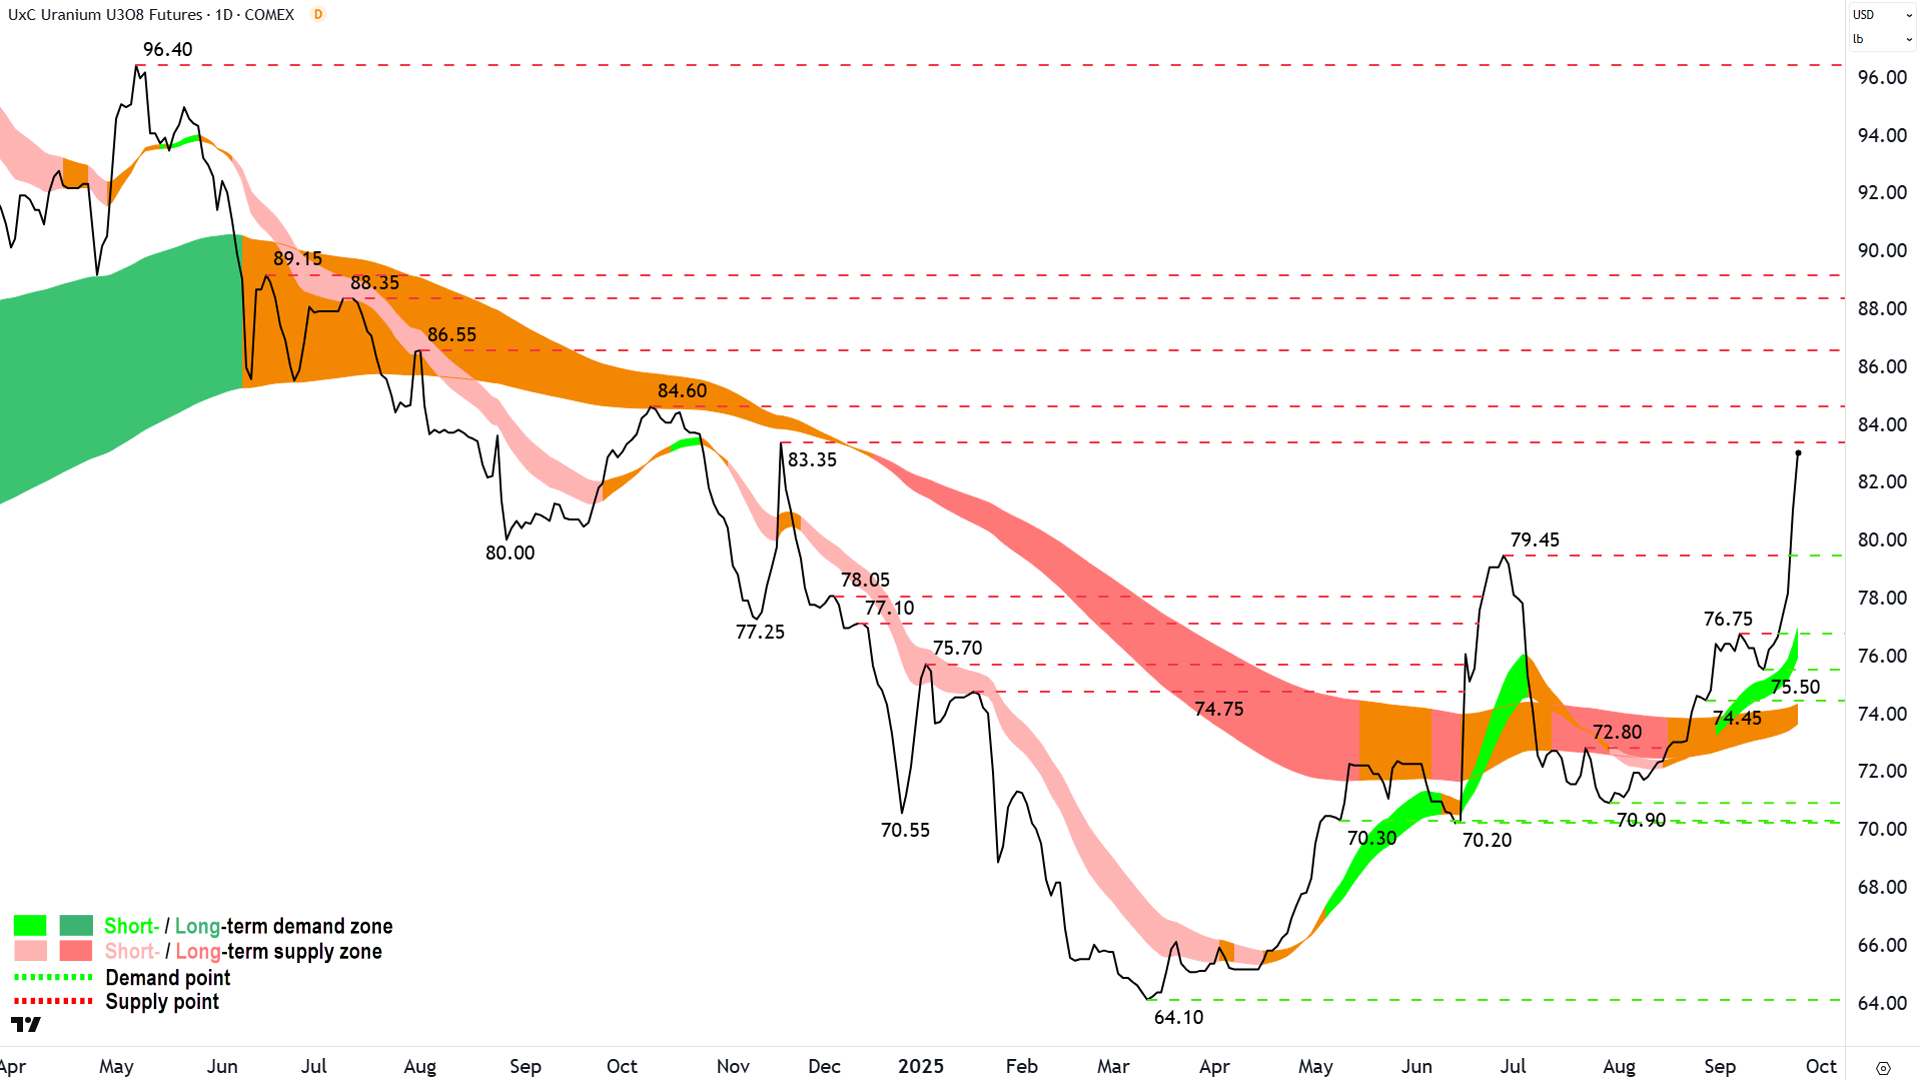
In that update, I noted that I was “happy to make a 'tentative' call that a new bull market is in place”, but also that to be really sure, I wanted to see uranium "close above the critical 79.45 major point of supply".
Good news. Check on that last point! ✅
So, as far as my technical model is concerned, uranium has entered a new bull market phase 🐂. For those who like check lists, here are the specific criteria I use to determine the start of a new bull market phase – or “long term uptrend” as I prefer (yes, my definition is far less exciting, but it’s more accurate, I think!):
The short term trend is up and the short term trend ribbon is acting as a zone of excess demand. ✅
The long term trend ribbon is neutral or up (i.e., not down). ✅
The price is above the long term uptrend ribbon and the long term trend ribbon is acting as a zone of excess demand. ✅
The price action is rising peaks and rising troughs. ✅
There is a predominance of demand-side candles (note: not relevant for uranium)
Okay, uranium’s in a bull market / long term uptrend – whatever you want to call it… So what? Tell me how long it will last, and which uranium stocks I should be buying right now smarty pants!
Sure, here’s my answers:
Q: How long will the uranium bull market last? 🤔
A: As long as it lasts... I don’t know... I can’t tell the future! Go ask someone who can, or check YouTube / TikTok, etc. as no doubt, there's an abundance of spruikers out there more than willing to make bold predictions so they can get more clicks.
Based on my model, the long term uptrend is intact until uranium closes back below the long term trend ribbon – whenever that occurs! However, I will have much earlier warning signs that the supply-side is grappling control of the price before that, namely lower peaks and lower troughs and/or a close below the short term uptrend ribbon.
Q: Which uranium stocks I should be buying right now smarty pants!? 🤔
A: This one I can answer, although: General Advice Warning here, because I just do charts… NOT what’s best for your personal financial situation – that’s up to you 🫵. I can however, point out which ASX uranium stocks are in strong uptrends. I do this for you on a daily basis for free in my ChartWatch ASX Scans articles. I note:
Deep Yellow (ASX: DYL) first appeared as a Feature Chart (i.e., highest conviction) in its latest run after the 8-May candle (close $1.335, yesterday’s close $2.05)
Nexgen Energy (ASX: NXG), which also trades on the TSX under ticker NXE, first appeared as a Feature Chart in its latest run after the 12-Jun candle (close $10.17, yesterday’s close $13.68)
Aura Energy (ASX: AEE) first appeared as a Feature Chart in its latest run after the 2-Sep candle (close $0.22, yesterday’s close $0.27)
Bannerman Energy (ASX: BMN) first appeared in its latest run after the 8-Sep candle (close $3.38, yesterday’s close $3.72)
And just this week:
Paladin Energy (ASX: PDN), Sylex Systems (ASX: SLX), Elevate Uranium (ASX: EL8), Terra Uranium (ASX: T92), Gladiator Resources (ASX: GLA), and Haranga Resources (ASX: HAR) have all Featured, but it's still early days on these!
So, it’s clear that ASX uranium stocks have led the recent uranium rally – which is what we’d ordinarily expect. Also, it's clear that as the new bull market in uranium has grown more pronounced, there has been an influx of ASX uranium stocks breaking into similarly strong trends (particularly this week).
One thing should become clear from this analysis: One doesn’t need to understand anything the fundamental price drivers of uranium the commodity, or uranium stocks to be able to find timely opportunities in the uranium sector!
Lithium Carbonate Futures (Benchmark month, back-adjusted) GFEX

No bull market here, yet! (click here for full size image)
The last time we covered lithium carbonate was in ChartWatch in the Evening Wrap on 10-Sep.
In that update, I described the June-July lithium rally – which took most by surprise in terms of its timing and severity – as “cooked”. I had in an update over a week earlier, already pointed to growing and decisive signs of its impending demise.
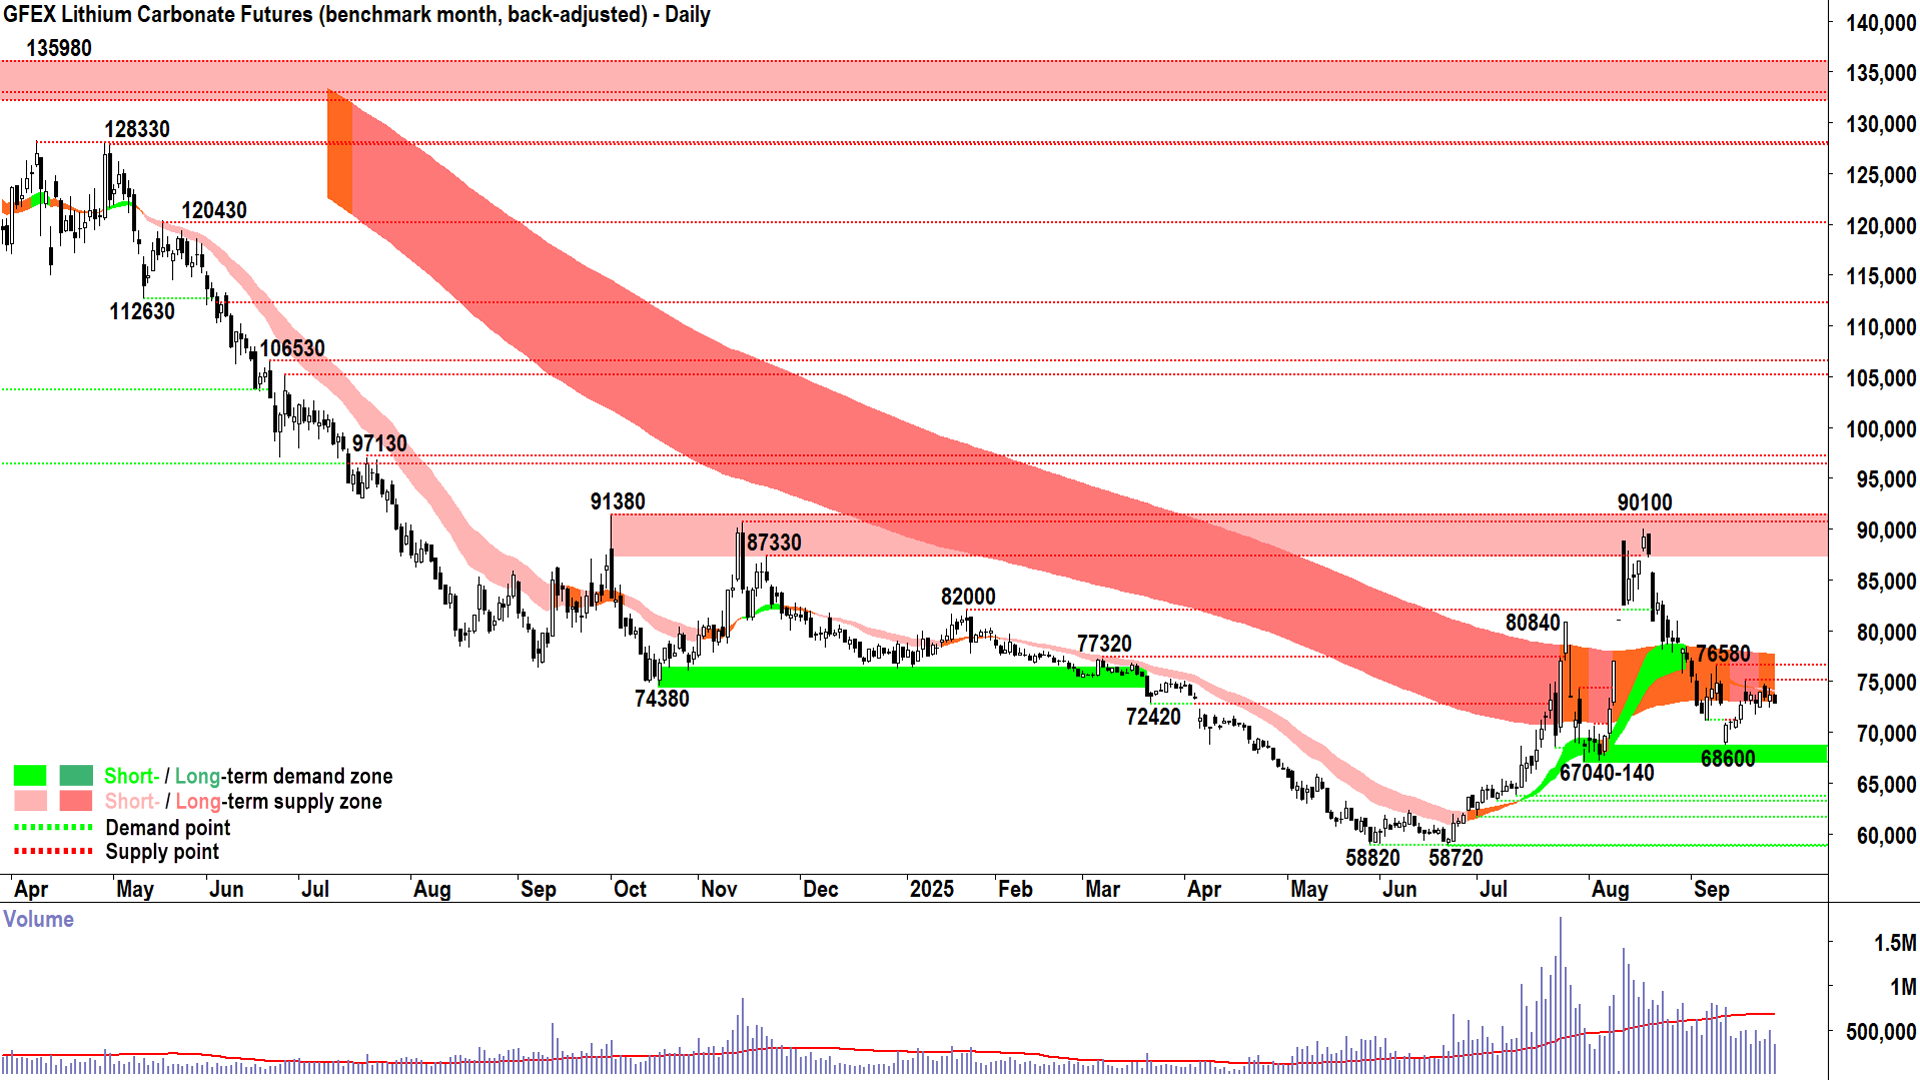
By the 10-Sep update the price had again forlornly dipped back below the long term trend ribbon, that trend ribbon had reverted to a downtrend (dark pink), and price action and candles had turned decidedly supply-side in nature: i.e., the short term rally was cooked!
Looking at the candle for yesterday’s trade (today’s candle is live – so we discount it), we can see that the price action in lithium carbonate has improved very slightly, with the rally from 68600 showing some sound demand-side candles on 10 and 15-Sep. However, thus far, the best that rally has been able to do is crash into the dynamic excess supply of the short and long term trend ribbons – which appear to be holding it at bay.
History (and my experience in using these ribbons) suggests that the longer the price fails to consume the excess supply at the trend ribbons – the greater the probability the price action will rollover and revert to the prevailing short and long term downtrends.
That’s big the risk here ⚠️.
So, I propose that the price of the benchmark lithium carbonate futures contract must close above the 16-Sep peak of 75100 quickly (not marked on the chart to reduce clutter) to have any chance of continuing the rally that started on 10-Sep. Ideally, it closes above what I expect will be an even greater supply-side test at 76580, which if it occurs, would likely coincide with a close above the long term uptrend ribbon (presently 73080-77670).
Until then, I feel the balance of probability lies with a roll-back towards what's shaping as a strong and absolutely critical demand zone at 67040-68600. There’s a chance for lithium as long as that level continues to hold – below it – it could get very ugly very quickly.
My hunch here remains a “bounce along the bottom” basing period that could last many months as lithium builds a strong foundation from which it may well mount a more meaningful rally down the track – as in, I do feel that the June-July rally wasn’t a fluke – and that we have likely seen “the big low” in this 3-year bear market.
First things first! Get above 76580 and that pesky long term uptrend ribbon (and whatever happens – and don’t dip below 67040! We’ll see what happens from there.
ChartWatch *LIVE* Webinar
ChartWatch *LIVE* Webinars – WEEKLY Wednesday's @ 12pm AEDT
Learn more about technical analysis and trend following through real case studies on ASX stocks. Australia's premier technical analyst, Carl Capolingua, shares his unique insights on stocks as requested by viewers. Ask about a company in your portfolio or anything related to trading and investing and get Carl's expert opinion.
Places are limited so >REGISTER NOW!<
