ChartWatch Markets: Energy markets check up – Crude Oil, Coking Coal, Thermal Coal, plus two strikes for US stocks...
Technical analysis of the most important global stock indices, commodities, bonds, FX, and crypto impacting your ASX portfolio each day.


Source: Shutterstock
Mentioned
KEY POINTS
- The Nasdaq Composite has had two clear supply-side showings in a row, but is it time to panic?
- Energy markets have experienced their most volatile in many this year as one geopolitical event after another shifts the demand versus supply landscape. We check how the crude oil price as tracking into year’s end.
- ASX coal stocks Whitehaven Coal (WHC), New Hope Corp. (NHC), and Yancoal Australia (YAL) have suffered their own version of volatility in 2025 – largely on the back of falling thermal and coking coal prices. How are the trends in these markets looking now?
In today's edition of ChartWatch Markets, we'll be covering the technicals for:
Nasdaq Composite
Brent Crude Oil Futures (Front month, back-adjusted) ICE
Newcastle Coal Futures (Front month, back-adjusted) ICE
Australian Premium Coking Coal Futures (Front month, back-adjusted) SGX
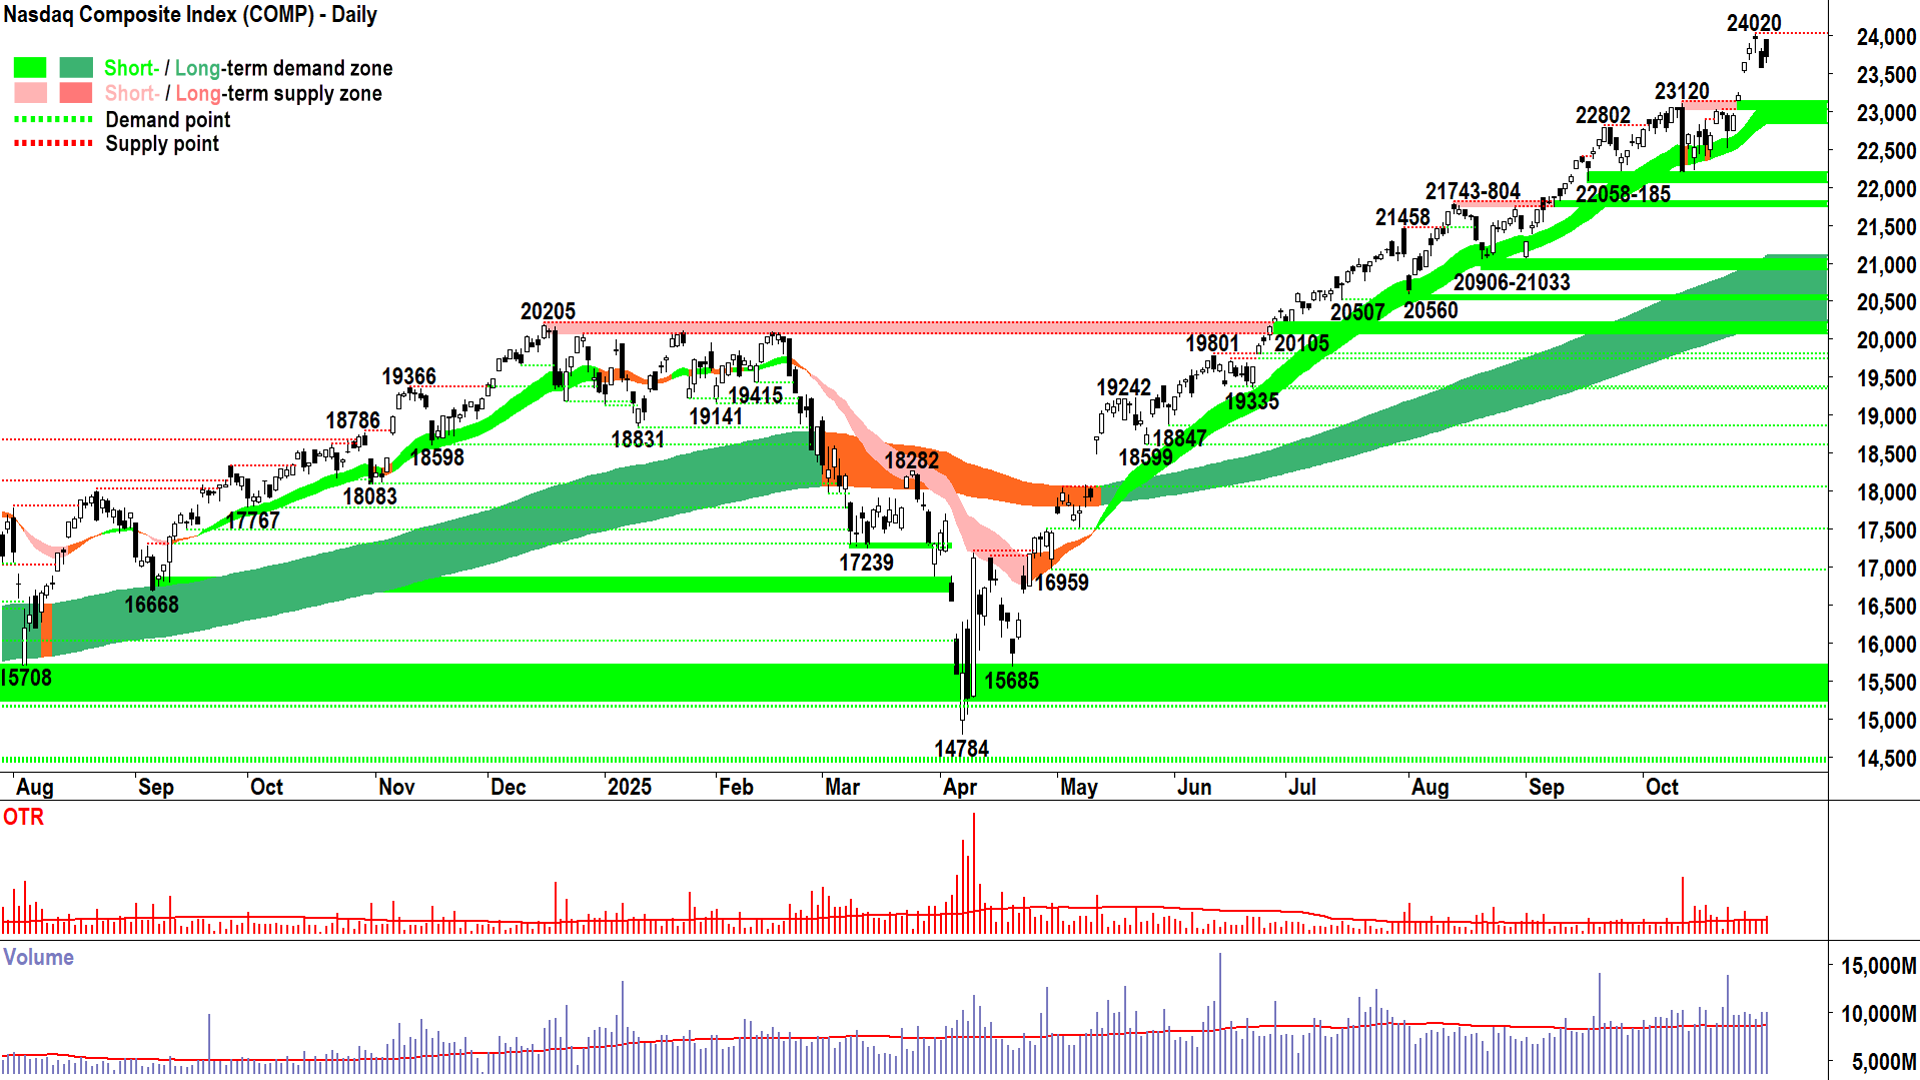
Nasdaq Composite Index

Nasdaq Composite Index chart (click here for full size image)
Supply and demand ⚖️.
Everything that ever mattered in the market for any asset – since the beginning of commerce – could have been explained by the interaction of these two forces.
At the end of the day, nothing else matters when it comes to discovering the price of an asset.
If I could add one extra, defining element, it would be motivation.
The motivation of the participants driving each force is just as pivotal as the quantities they wish to transact – although surpluses and scarcity generally lead to the greatest motivation!
Sure, imbalances between demand and supply are likely to result in at least some price movement:
D > S = P⬆️
S > D = P⬇️
But it’s the relative motivation of the demand and supply-sides that determines the magnitude of P⬆️ or P⬇️.
Why do I bring this up? 🤔
Firstly, if I was a stock market analyst at a major investment bank and I told you my view on the present value of stocks, you could easily find 1,000 others with the opposite view.
If I was an economist frequently quoted in the press and I told you my views on the labour market, the potential growth of the domestic economy, and the future path of interest rates, you could easily find 1,000 others with the opposite view.
But I challenge you to find just one person who will challenge my views on D > S = P⬆️ and S > D = P⬇️!
Any time.
If we all agree that everything comes down to D vs S, then why waste one’s time looking anywhere else for answers as to where P might be headed next?
Notice I used the word “might” there… I never talk in absolutes – only those who can see the future are allowed to do so with any authority.
I’ve never met anyone who fits this bill… have you? 🤷
I didn’t think so.
My philosophy is simple:
Only consider D vs S.
Try to identify scenarios where D > S = P⬆️ MOTN
Try to identify scenarios where S > D = P⬇️ MOTN
Those 4 letters at the end of the two most basic tenets of economics is what I feel sets my approach apart from most others.
MOTN (More Often Than Not)
I don’t require 100% of the time like most other investors aspire to. MOTN is just fine with me. I know I will be wrong often, but I also know that my model wins more when it does hit a trend than it loses when it doesn’t.
This is why I don’t fret about any individual trade… they’re just another in a long stream of trades I will make between now and the day I stop trading.
D vs S = P.
+ MOTN.
+ Repeat with consistency and discipline.
But I am a little off topic today. Candles like those last two on the Comp’s chart will do that to me – make me get all philosophical! I just can’t help but appreciate their beauty!
Ok, before you think I’m a bit weird… beauty is in the eye of the beholder – remember!
For me, all I can see in those last two candles is excess supply. Excess supply near a previous point of supply (24020). Excess supply near a previous point of supply after a strong run up.
It just makes so much sense – after all, tell me what else you’d expect to see in such a situation!? 🤷
Volume is above average for both candles, not massively so, therefore I don’t expect they constitute a major shift in market thinking or resultant positioning – but a decent whack of supply is hitting a decent whack of demand, and supply is a bit more motivated.
Make of that what you will, but I propose that given it’s occurring near a historic point of supply (i.e., where there was motivated excess supply around this price in the past) and after a sharp run up – that the supply on Thursday and Friday makes plenty of sense. Others might call it “profit taking” or “a few nerves at the old highs”.
I don’t think it’s sinister yet, because I know there’s still plenty of demand in the system – look at the volume, look at the broader trends, price action and candles (above average, short and long term up, rising peaks and rising troughs, predominance of demand-side candles, respectively).
So, I remain happy to back the trend here – but naturally I am on alert that the supply-side is active in the system now – compared to a distinct lack of engagement during that last move from the 22-Oct trough.
Stuff I don’t want to see (i.e., signals greater supply-side control of the Comp’s price):
Short and long term trend ribbons: Contracting (getting weaker), not acting acting as a zone of dynamic excess demand (i.e., price closes below short term uptrend ribbon) = ⚠️.
Price action: Lower peak to 24020, lower trough to 23578 (30-Oct low) (i.e., demand removal and supply reinforcement = ⚠️).
Candles: Supply-side control (i.e., black-bodied candles and or upward pointing shadows – particularly long ones!) = ⚠️.
View: I am FRP (Full Risk Position corresponds to a 100% allowable capital allocation limit for US stocks based on my personal risk management model).
Key levels: 23032-23120 is the closest point of demand, the price should not close below here if the demand-side is in control of the Comp's price; a close below the short term uptrend ribbon (presently 22785-23050) will nullify the short term uptrend = ⚠️
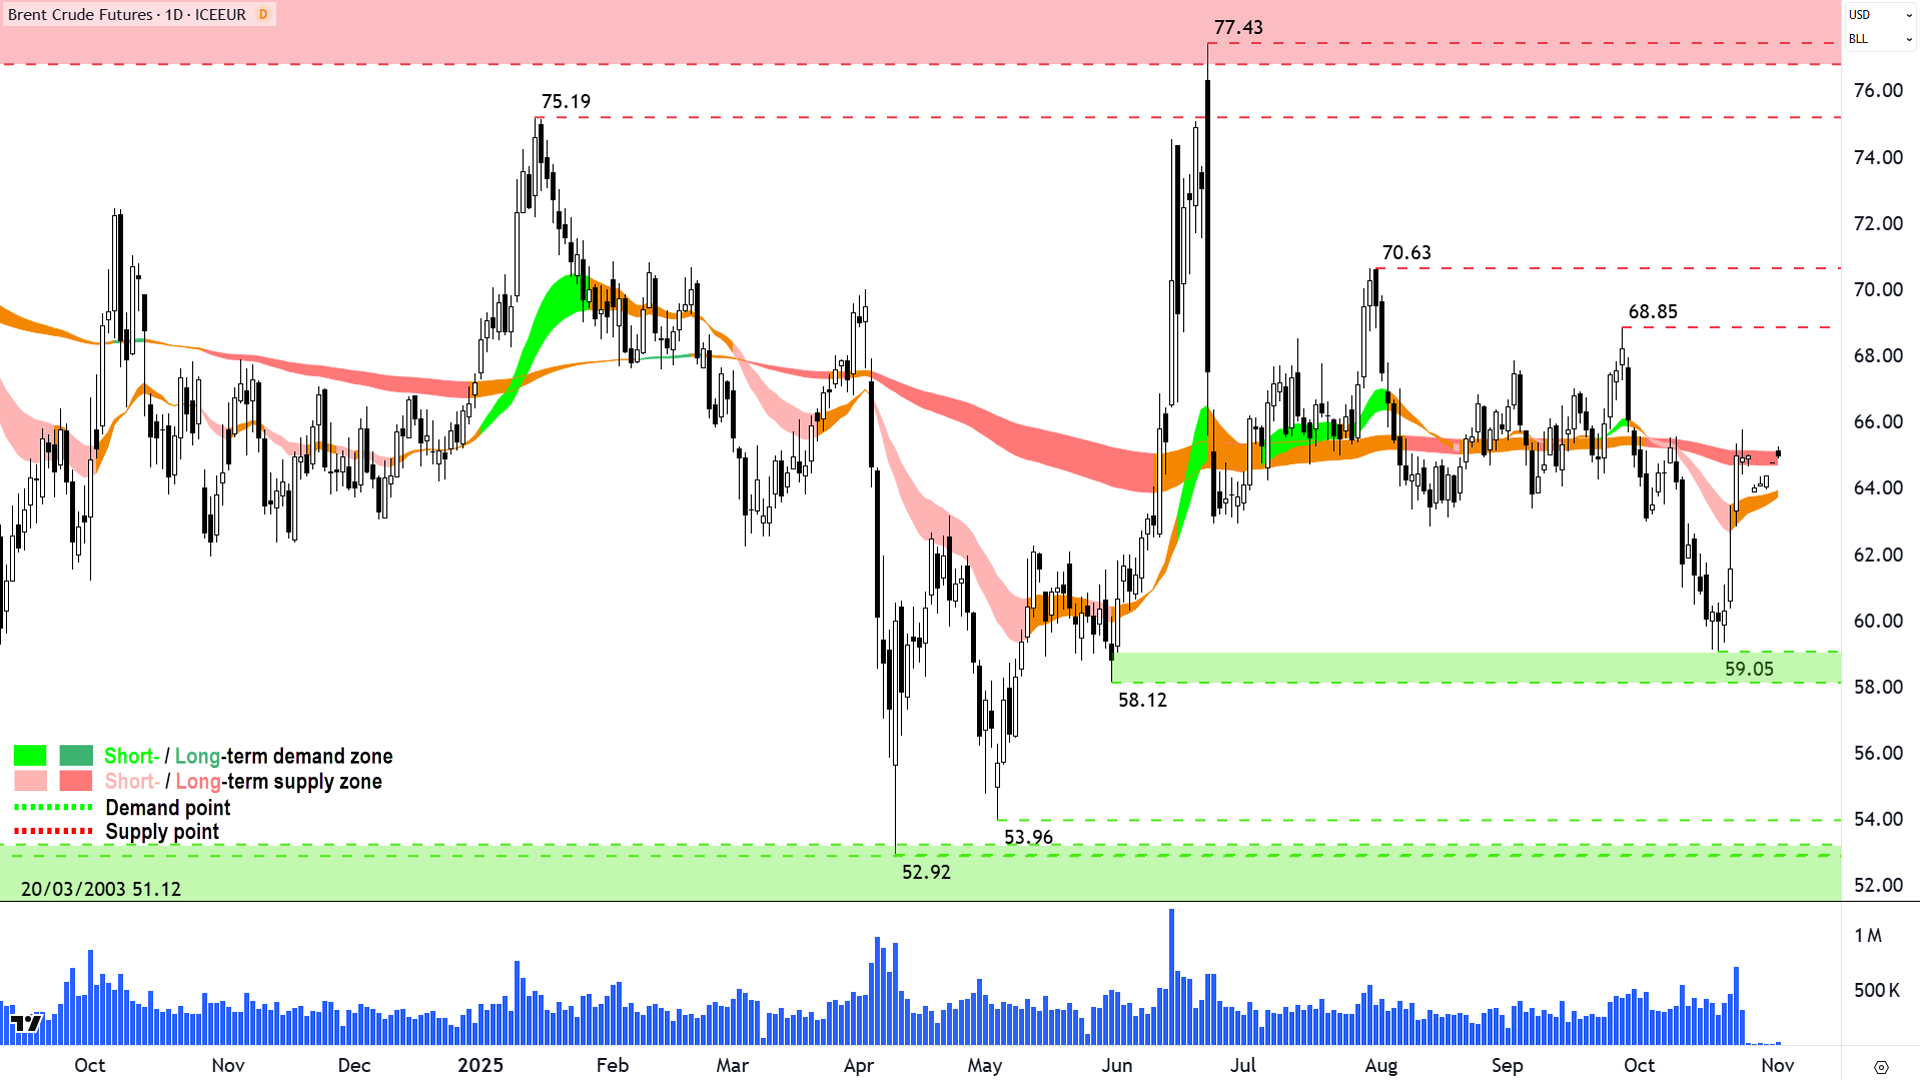
Brent Crude Oil Futures (Front month, back-adjusted) ICE
%20ICE%20chart_3%20Nov.png)
An interesting chart (click here for full size image)
I won’t spend much time here – after all, please tell me what the trend is? That’s right… there isn’t one! 🙅
But then thereis… because if there’s no uptrend and there’s no downtrend, then by definition, there’s a sideways trend – and it’s Just as valid: D = S = P↔️.
The main issue I have here, apart from the fact I find this chart thoroughly uninteresting… is that there are fundamental news hand grenades that get lobbed in from time to time that tend to ruin any fledging trend that might be developing. For example:
3-4 April = US China tariffs + OPEC daily output increase
23 June = US’s attack on Iran
23 October = President Trum convinced Prime Minister Mohdi to significantly scale back India’s purchase of Russian oil
There are probably others I can’t remember, but I think you get my drift.
I love to trade crude when it trends – when it gets going, we’re talking some of the best trends one could ask for 🚀. But that’s just not right now. So, this is a big fat ZRP for me.
View: ZRP (Zero Risk Position is my way of saying – I can’t see any reason to allocate risk to this trend. You could also consider this to be a -R scenario by default, i.e., I prefer to reduce any risk that happens to be in the system towards ZRP).
Key Levels: Maybe above 70.63 this could look interesting – assuming the right price action (i.e., rising peaks and rising troughs) and candles (i.e., long white-bodied and or long downward pointing shadows). Alternatively, maybe below 58.12 it would be setting up for shorts – assuming the right price action (i.e., falling peaks and falling troughs) and candles (i.e., long black-bodied and or long upward pointing shadows). Maybe… thoroughly uninteresting… remember!?
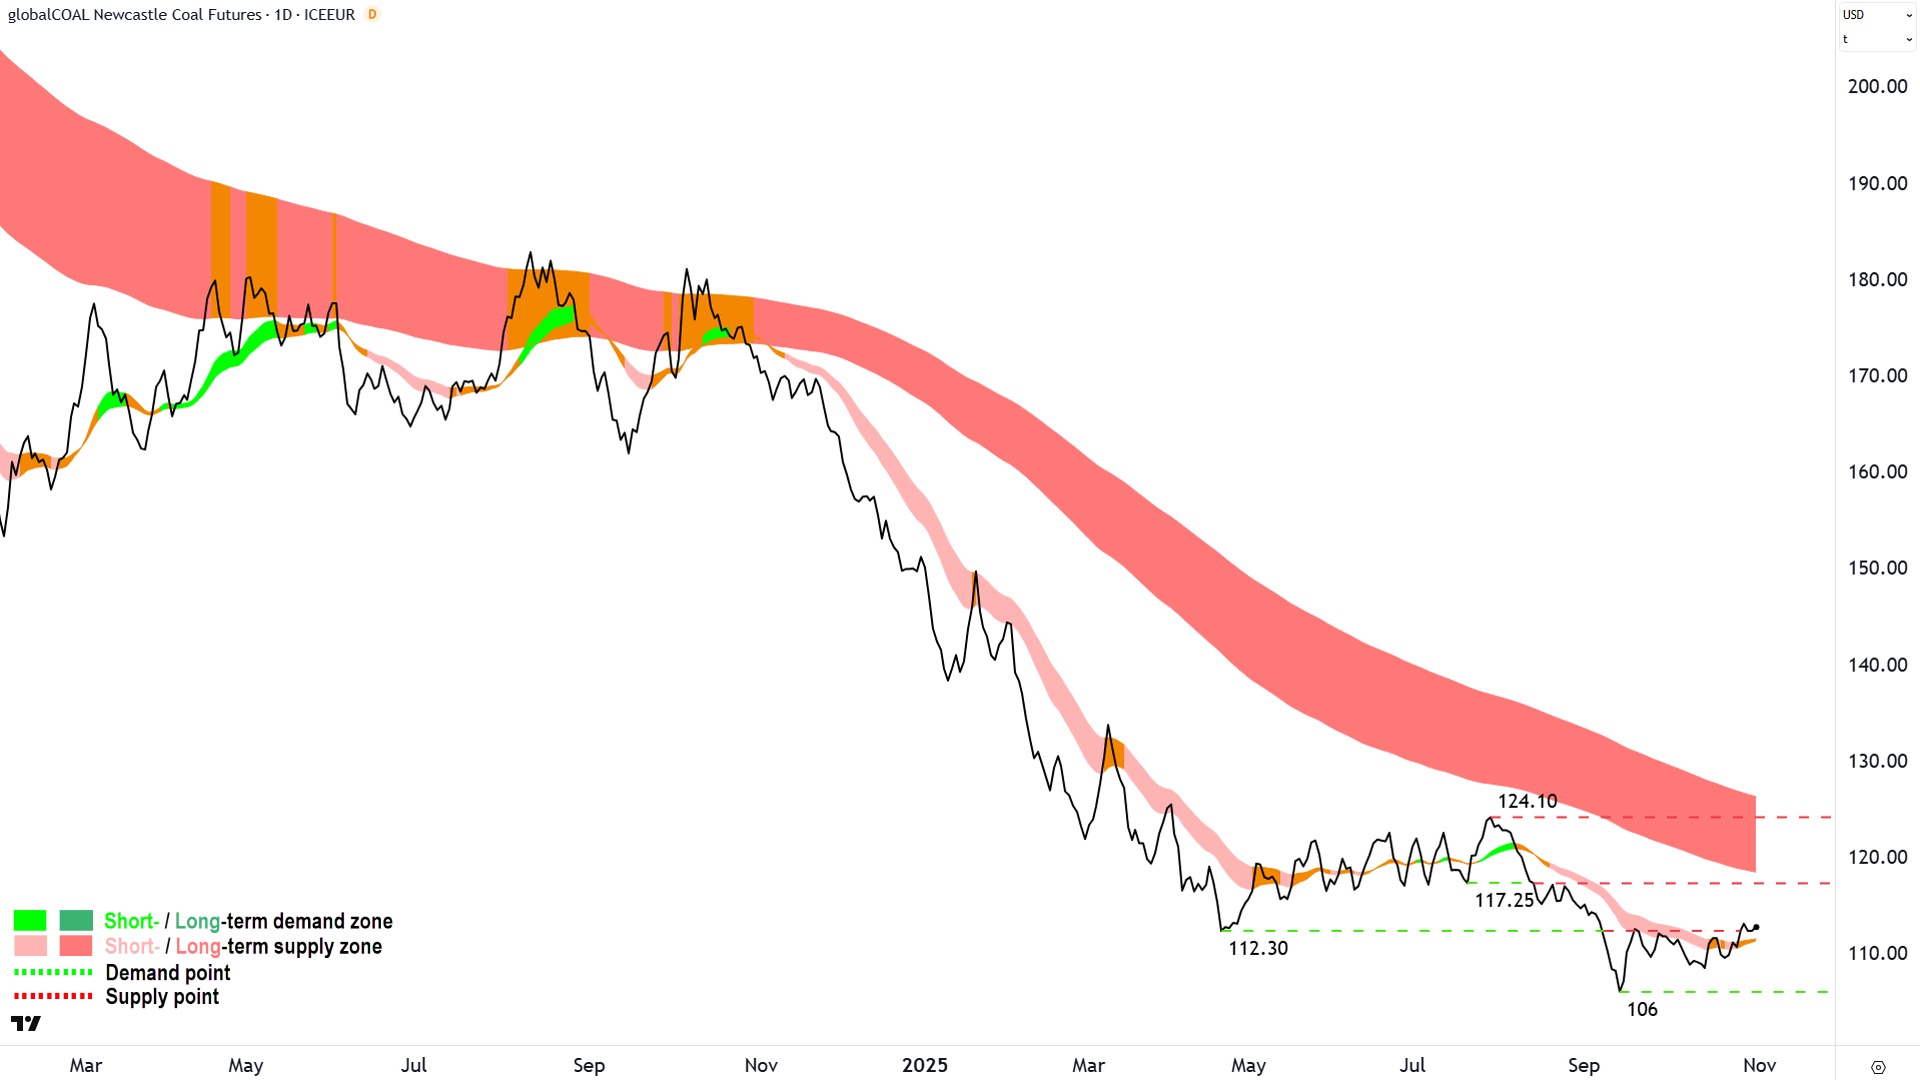
Newcastle Coal Futures (Front month, back-adjusted) ICE
%20ICE%20chart_31%20Nov.png)
An interesting chart (click here for full size image)
More interesting here than brent crude, as in, there is a clearly defined long term downtrend – but much the same in terms of more recent price action chopping around within a broad range.
The last drive lower from 124.10 to 106 is far smaller than the September 2024 to April 2025 wipe out – that’s a small positive. But otherwise, it’s still very much a picture of dominant supply-side control.
The short term trend it neutral, and whilst the price action is rising peaks and rising troughs, they’re so flattened out – one is best calling this neutral also.
View: ZRP or -R to get that way, for me. There’s so much that needs to occur (let’s start with closing above the absolute beast that is the long term downtrend ribbon) before I would even consider an =R stance, let alone a +R stance! (=R is my way of saying I’m comfortable maintaining any existing risk positions, versus +R which implies I’m happy to add risk).
Key Levels: It’s pointless even looking at this chart for a bullish turnaround until the price closes above the long term trend ribbon (presently 118-126). A close below 106 recommences the short term downtrend.
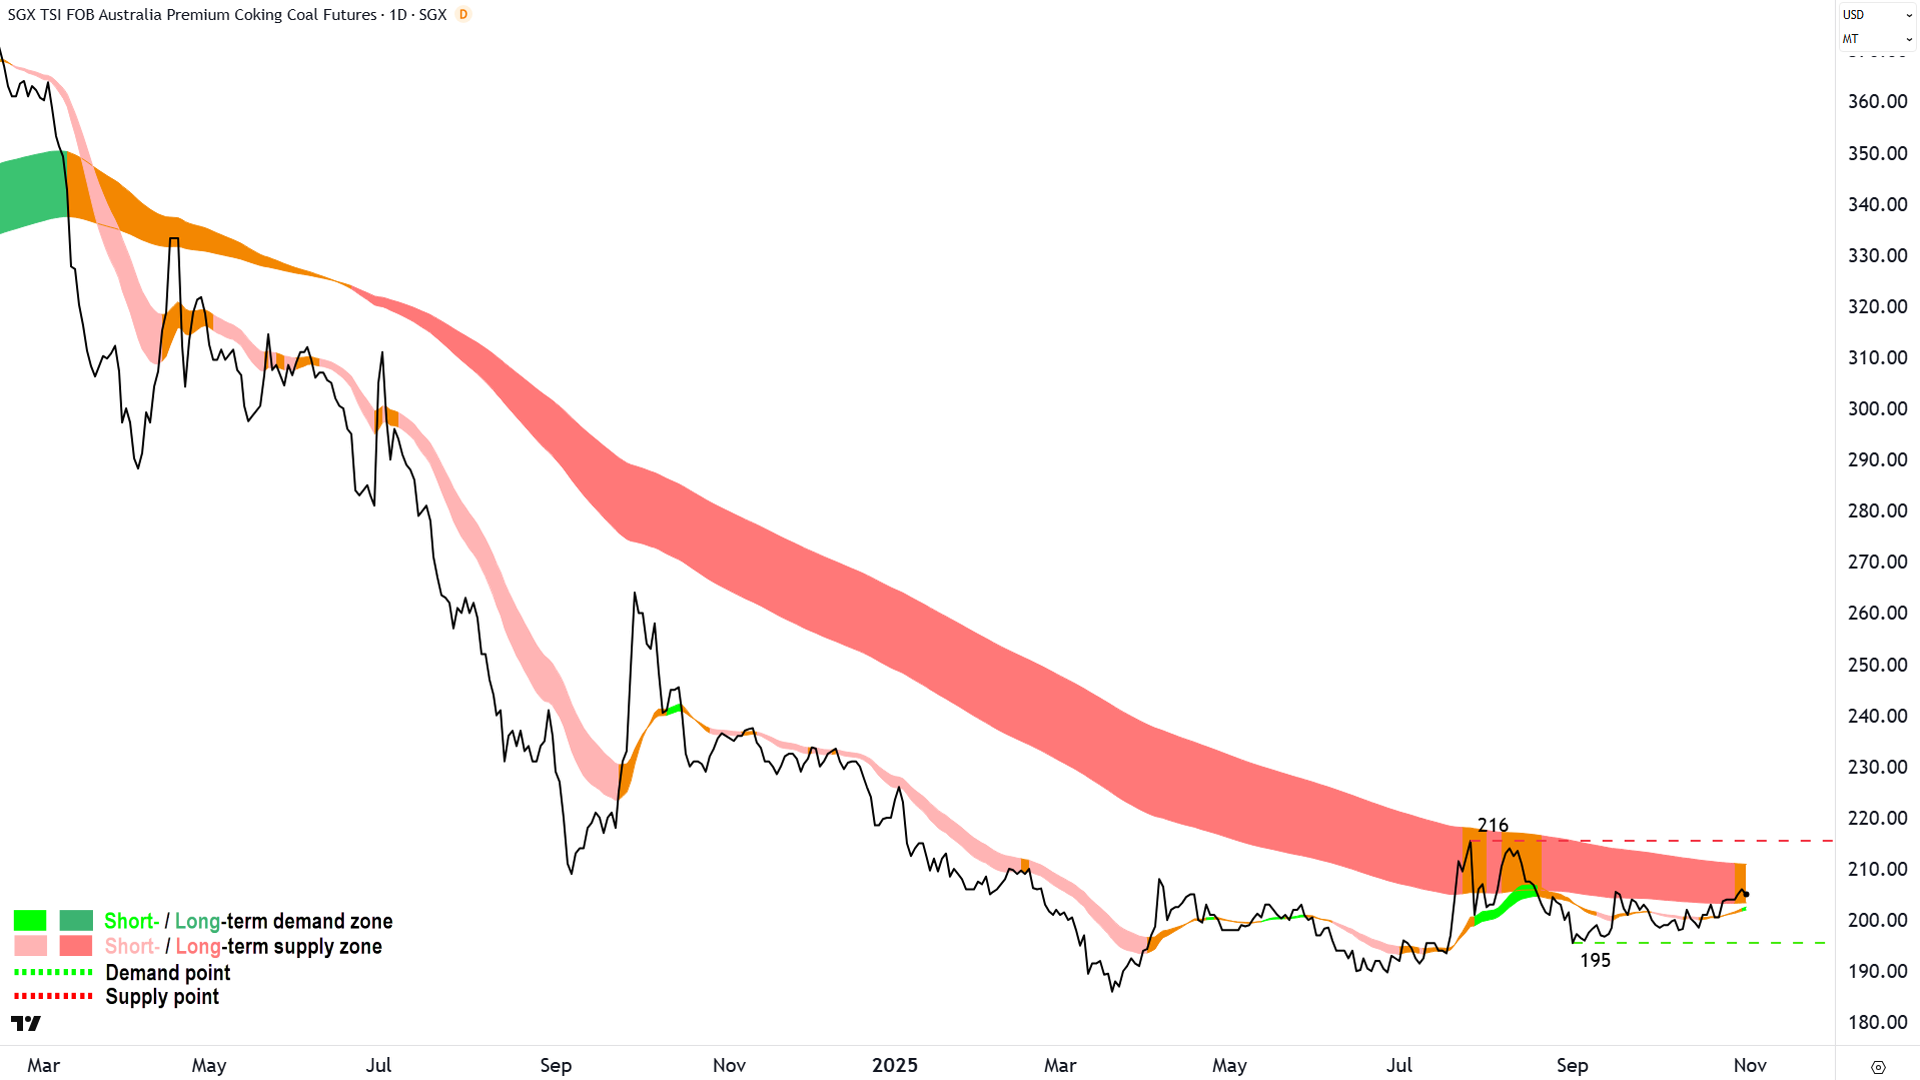
Australian Premium Coking Coal Futures (Front month, back-adjusted) SGX
%20SGX%20chart_31%20Nov.png)
An interesting chart (click here for full size image)
Squint really, really, hard and you might be able to see the signs of equilibrium in the coking coal market. No, harder than that!
Ok, relax, you’re about to bust an eyeball! 👀
The long term trend ribbon has neutralised, the short term trend ribbon just swung to up (squint again!), the price action is rising peaks and rising troughs – albeit flat as a pancake!
= Neutral, equilibrium, nothing to see here (until, perhaps… see “Key levels”).
View: Still too early for me, ZRP or =R if I squint – but I acknowledge we’re likely equilibrium here and not dominant supply-side control. Still, that remains the most likely next scenario, given the long term trend before this equilibrium phase was a “strong down”.
Key levels: A close above the long term trend ribbon (presently 203-210) would be the earliest trigger for considering +R. A close below 195 would move me back to -R.
ChartWatch *LIVE* Webinar
ChartWatch *LIVE* Webinars – WEEKLY Wednesday's @ 12pm AEDT
Learn more about technical analysis and trend following through real case studies on ASX stocks. Australia's premier technical analyst, Carl Capolingua, shares his unique insights on stocks as requested by viewers. Ask about a company in your portfolio or anything related to trading and investing and get Carl's expert opinion.
Places are limited so >REGISTER NOW!<
