Is the low in uranium in? If it is, which uranium stocks might be a buy?
Major news events have rocked the uranium market, sending share prices soaring. But can it continue? What do the charts say?

Source: Shutterstock, Market Index
Mentioned
KEY POINTS
- Separate news triggers in recent weeks have stoked share prices in the uranium sector
- Prior to the news, share prices in the sector were generally under heavy selling pressure, leaving many wondering if they should bail out after this latest bounce, or hold on for more
- After the dust has settled on the recent rally, do the charts indicate the low in uranium is in? We investigate the charts of uranium futures and global and ASX uranium stocks to find out
It has been an incredible couple of weeks for Aussie resources investors. Just a couple of weeks ago, share prices of many ASX-listed resources companies, including uranium stocks, were nursing double-digit 2024 falls. But, in just a few trading sessions, stocks throughout the sector have logged near-vertical rallies of 20-30% in some cases.
Much of the about-face is a result of renewed hopes the Chinese economy may finally find a firmer footing after the latest round of stimulus measures announced by Beijing last week. Turning to the focus of this article, uranium – certainly a stronger Chinese economy won’t hurt the uranium price, and therefore the fortunes of uranium stocks – but there have been several other additional positive news items that have helped stoke the sector’s recovery:
23 August
Kazatomprom (the world’s largest producer of uranium) announces a 5,000t cut to its uranium production guidance for 2025 blaming continued uncertainty over sulphuric acid supply (Note: 2025 production is still expected to be greater than 2024 production).
12 September
Comments from Russian president Vladimir Putin that his country would consider limiting its exports of uranium (along with other minerals) in retaliation to Western sanctions.
20 September
Microsoft signs a 20-year power purchase agreement with major US nuclear power producer Constellation which will see that company restart the Three Mile Island Unit 1 nuclear power plant. Markets extrapolated other major IT power consumers (e.g., data centre operators) may also seek similar low carbon emission energy deals with utilities.
23 September
Global financial institutions including Goldman Sachs, Citi, and Bank of America pledged support for tripling global nuclear energy capacity by 2050, potentially easing financing challenges for the sector
Given the combination of the above factors, I suggest it’s never been a better time to investigate the technicals of the broader uranium picture. In this article, I will assess the charts of uranium plus those of the key global and ASX-listed uranium producers. Let’s dial down the rumours, news, and rhetoric to try and answer the question: Is the low in uranium in?
(Note: I did a similar technical analysis overview for Lithium on Friday. Also, to better understand the workings of Technical Model you may wish to read my Technical Analysis Primer)
Is the low in uranium in?
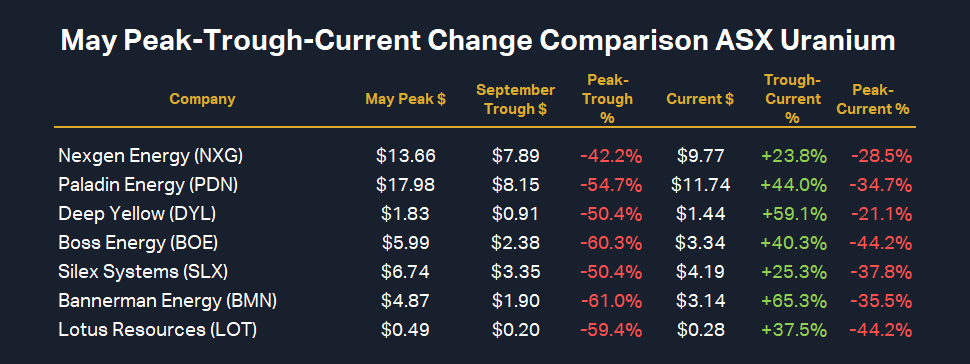
Price increases in ASX-listed uranium stocks of between 30-40% have not been uncommon over the last two weeks. This sounds fantastic for long-suffering uranium investors, but prior to the latest rally, many uranium stocks were down over 60% from their May peak. The maths suggests that even a 40% rally on one’s remaining 40% investment – still leaves one nursing some nasty losses (theoretically 44% to be precise!).

Peak to trough to current performances of key uranium stocks (click here for full size image)
Let’s begin our investigation with analysis of COMEX uranium futures.
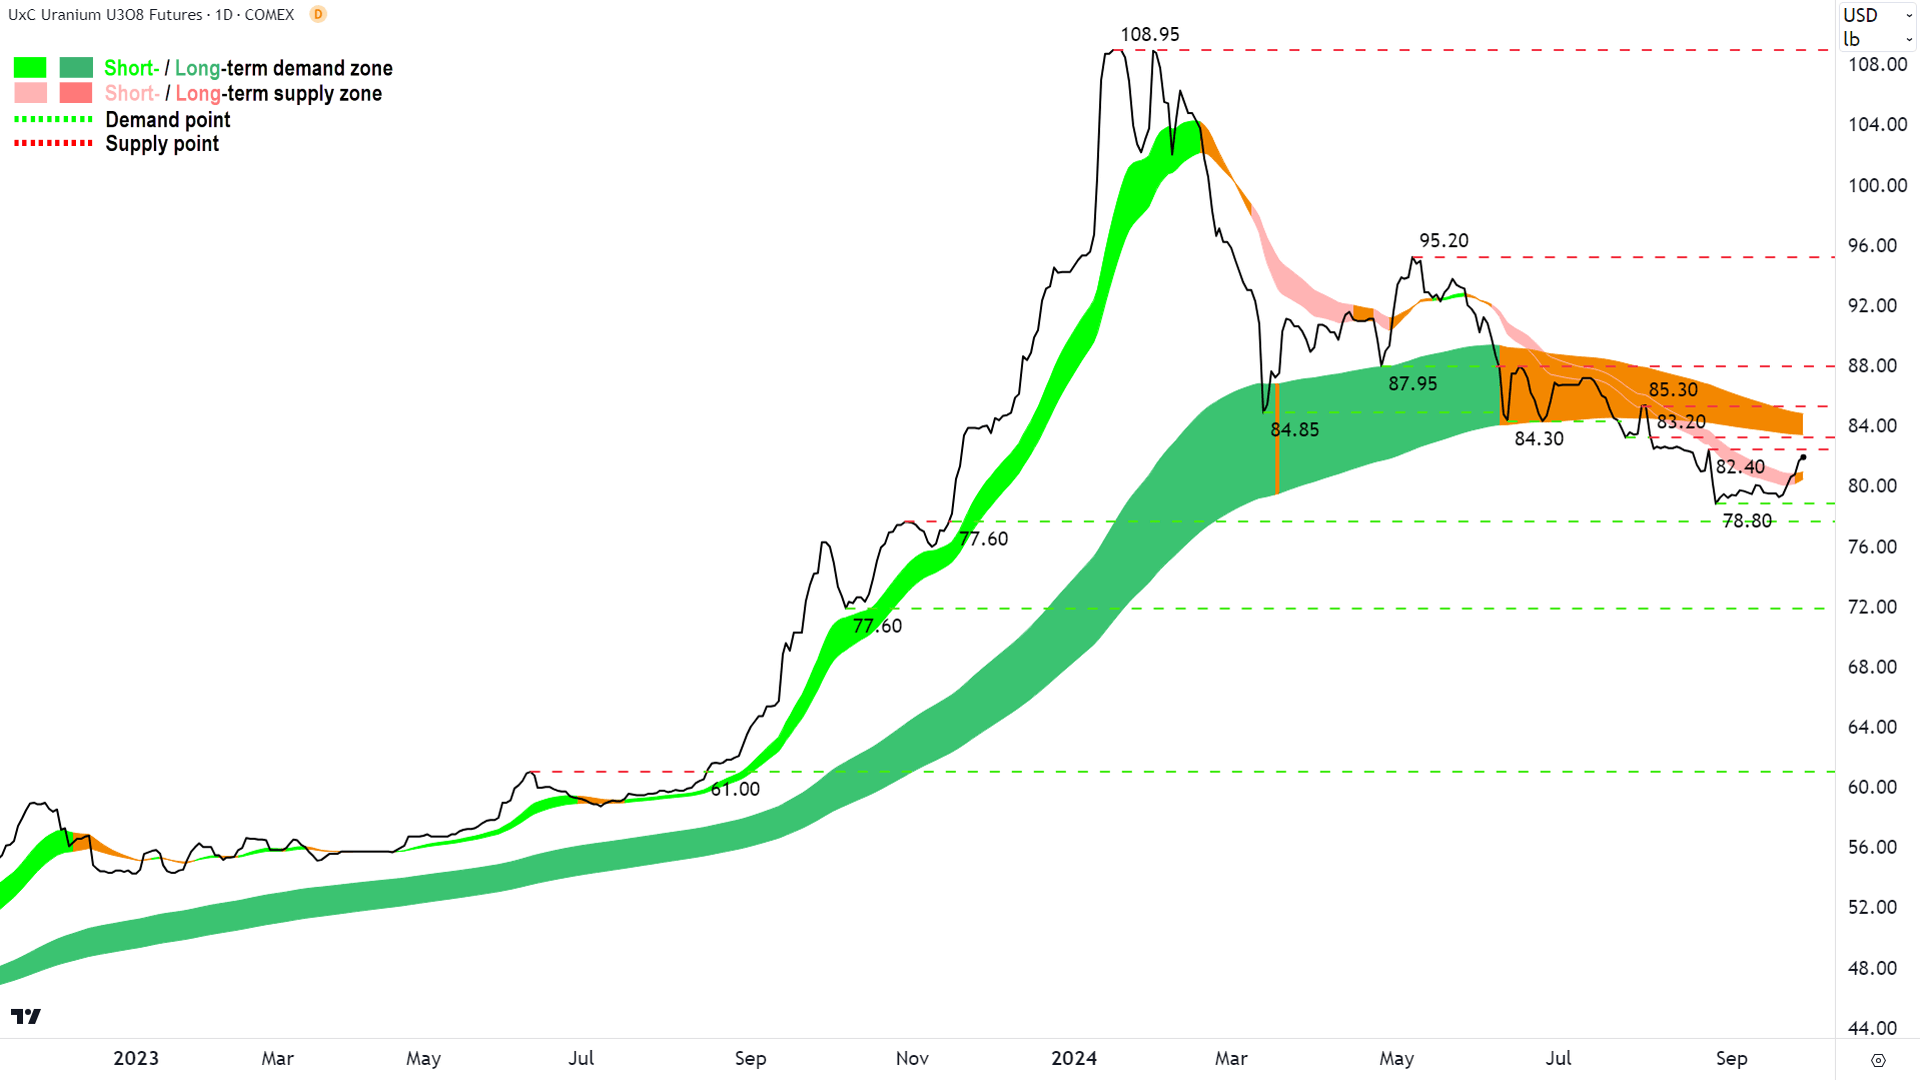
Uranium Futures (Front month, back-adjusted) COMEX

Uranium Futures (Front month, back-adjusted) COMEX chart (click here for full size image)
78.80 to 81.90, or around 3.9%. That’s the magnitude of the rally in uranium futures since the first positive news item listed above broke on 23 August. Compare this increase with some of the trough-to-current gains in ASX-listed uranium stocks of over 40% – and you might think there’s a bit of a discrepancy here.
There are two possibilities here: 1. Uranium stocks were “oversold” prior to the uranium price bounce (we could discuss the impact of growing short seller percentages here); or 2. Uranium stocks have overshot the rally.
The wonderful thing about technical analysis is that we don’t need to concern ourselves with either prospect – because neither really matters. All that matters is price action and trends, i.e., what is the interaction between demand and supply now and what does it tell us about demand-side or supply side control?
With respect to COMEX uranium futures, I note neutral short and long term trend ribbons are an excellent place to start. They’re indicative of a state of general equilibrium between demand and supply for uranium. For the most part, it appears investors are undecided about the future direction of the uranium price.
However, it’s typically bearish to see the price of any asset trading below the long term trend ribbon, particularly if there is evidence that the long term trend ribbon has been impeding rallies. In this regard, the peak at 85.30 appears to confirm the long term trend ribbon is now acting as a zone of excess supply. We may get another, and likely to be critical test soon, with the present rally from 78.80 edging closer to the long term trend ribbon.
Should the uranium price fail to close back above the long term uptrend ribbon on this next attempt – it will put the transition to long term downtrend beyond doubt and increase the likelihood of greater falls.
If this scenario plays out, 77.60-78.80 is the next key demand zone. Beneath it lies 77.60, and then there’s very little until 61.
Should uranium find a way to close back above the trend ribbon, and then continue with rising troughs and rising peaks from there, 87.95 is a key point of supply that must be overcome. A move like this could seal the deal for a resumption of the 2023 bull market. Note in this scenario, 95.20 and then the peak of the last bull market at 108.95 are the next two key points of supply.
Given current trends and price action, I’d have to peg the bear case as the more likely of the two scenarios at this point.
Let’s now investigate the charts of several key global uranium stocks, including the world’s top two producers, Kazatomprom (approx. 43%) and Cameco (approx. 14%). Note, I have focussed here on pure-play uranium stocks, and therefore I have not included major producer BHP Group (ASX: BHP) which is the world’s third largest uranium producer (approx. 7%).
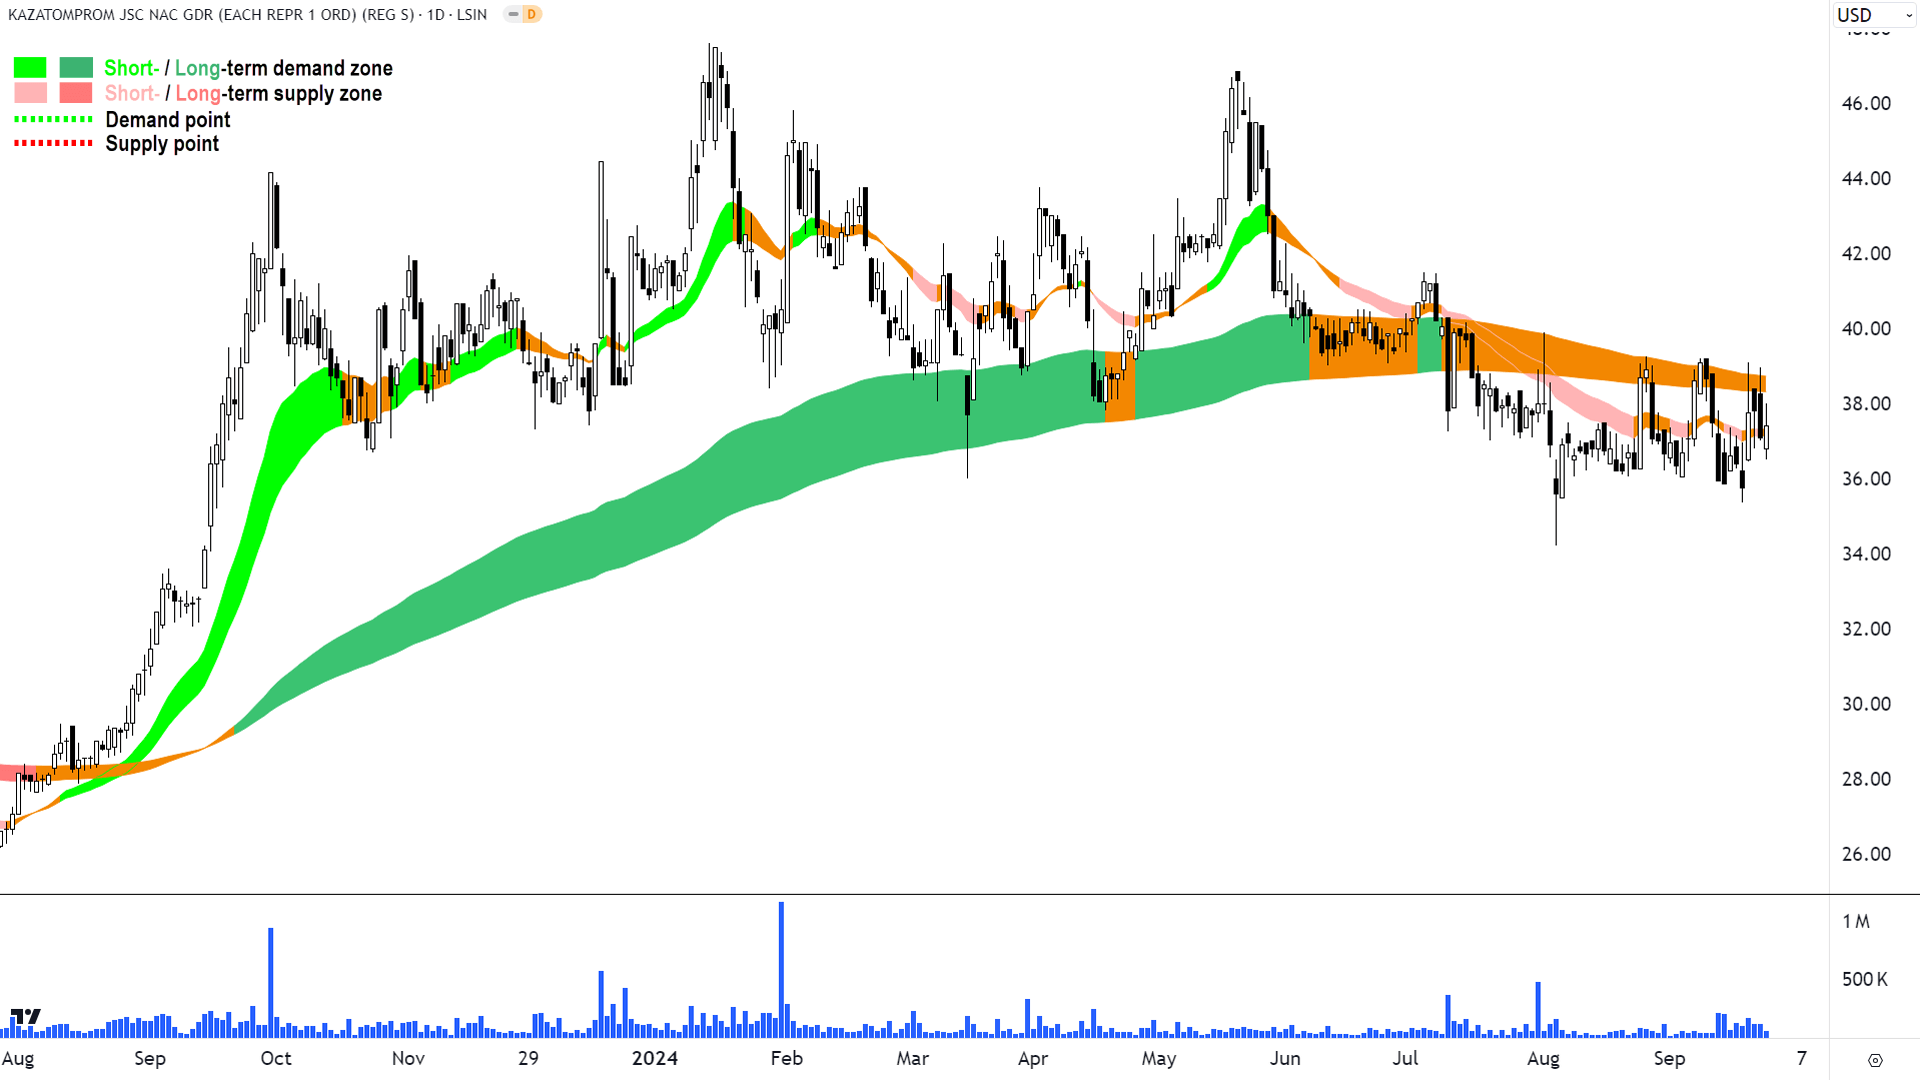
National Atomic Company Kazatomprom (LSIN: KAP)
%20chart%2027%20September.png)
Kazatomprom chart (click here for full size image)
Surprise, surprise, the chart of the world’s biggest uranium producer looks very similar to the chart of uranium. Short and long term trends are neutral, price action is roughly steady peaks and troughs, however one could argue there is a very slight trend lower on this item. Candles are largely mixed, but also could be argued are slightly skewed to the supply side.
The long term trend ribbon appears to have transitioned from a zone of excess demand to a zone of excess supply. I suggest this is now the critical point the KAP price must close above, and hold with higher troughs and subsequently then, higher peaks.
The 23 Sep low of 35.35 is the next key point of demand, and below it, the 5 Aug low of 34.20. A close below 35.35 begins a journey down a potentially slippery slope, and a close below 34.20 would seal the deal on a transition to long term downtrend. You should be able to match up the key points here and in the uranium chart. We’re in limbo on both, and on both, the next move is likely critical.
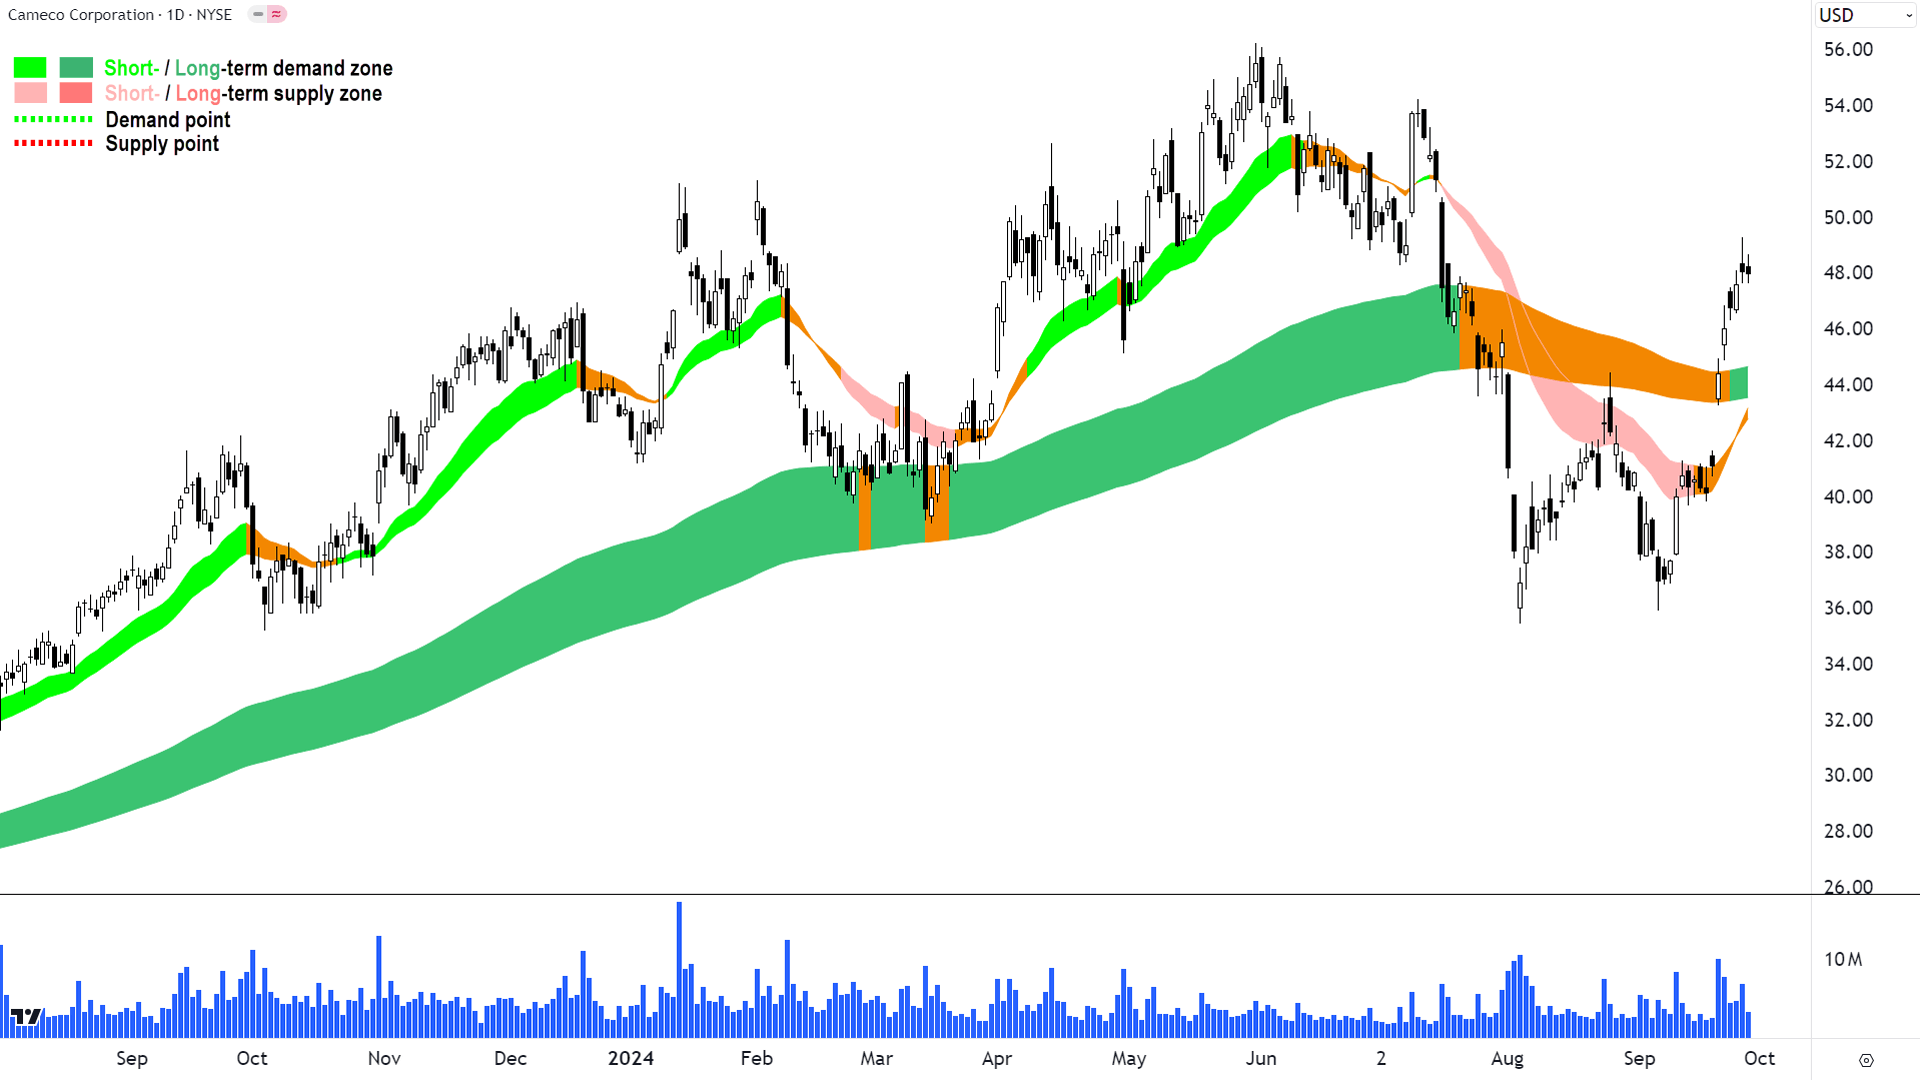
Cameco Corporation (NYSE: CCJ)
%20chart%2027%20September.png)
Cameco chart (click here for full size image)
If the first two charts were largely neutral, the recent rally in the CCJ chart sees it leaning more towards demand-side control. The short and long term trend ribbons have swung back up and the price action is rising peaks and rising troughs. The latest push from the 6 Sep low of 35.89 has seen very little downside volatility, which indicates the supply side is unable or unwilling to contend with the recent influx of demand.
Thursday and Friday’s candles, with their black bodies and upward pointing shadows – whilst modest – do indicate some supply has entered the system / and or demand is taking a breather.
The next move from here should set the tone for near term price action. A shallow pullback terminating well above the now dynamic demand of the long term trend ribbon would auger well for a continued trend higher towards the May highs. Alternatively growing supply-side candles and a close below the short and long term trend ribbons would set CCJ up for move back to the Aug-Sep lows in the mid-30’s.
Watch the candles and price action closely from here: White-bodied candles with downward pointing shadows plus rising peaks and rising troughs is bullish, versus black-bodied candles with upward pointing shadows plus falling peaks and falling troughs is bearish.
Uranium Energy Corporation (NYSE: UEC)
%20chart%2027%20September.png)
Uranium Energy Corporation chart (click here for full size image)
I can really just “ditto” this one with CCJ. It’s leaning back to demand-side control here, with the next move crucial to confirming the fledgling trend change or condemning it back to the prior developing long term downtrend.
A close above the 15 Jul peak of 6.97 would be a good sign, but even then, I see a wall of latent supply all the way up to the 1 Feb major peak at 8.34. So even if the bull case does play out here, it’s likely to be a hard slog to make new highs any time soon.
The bear case would be greatly aided by a close back below the short and long term trend ribbons. The bottom line is that none of the charts so far are consistent with strong demand-side control.
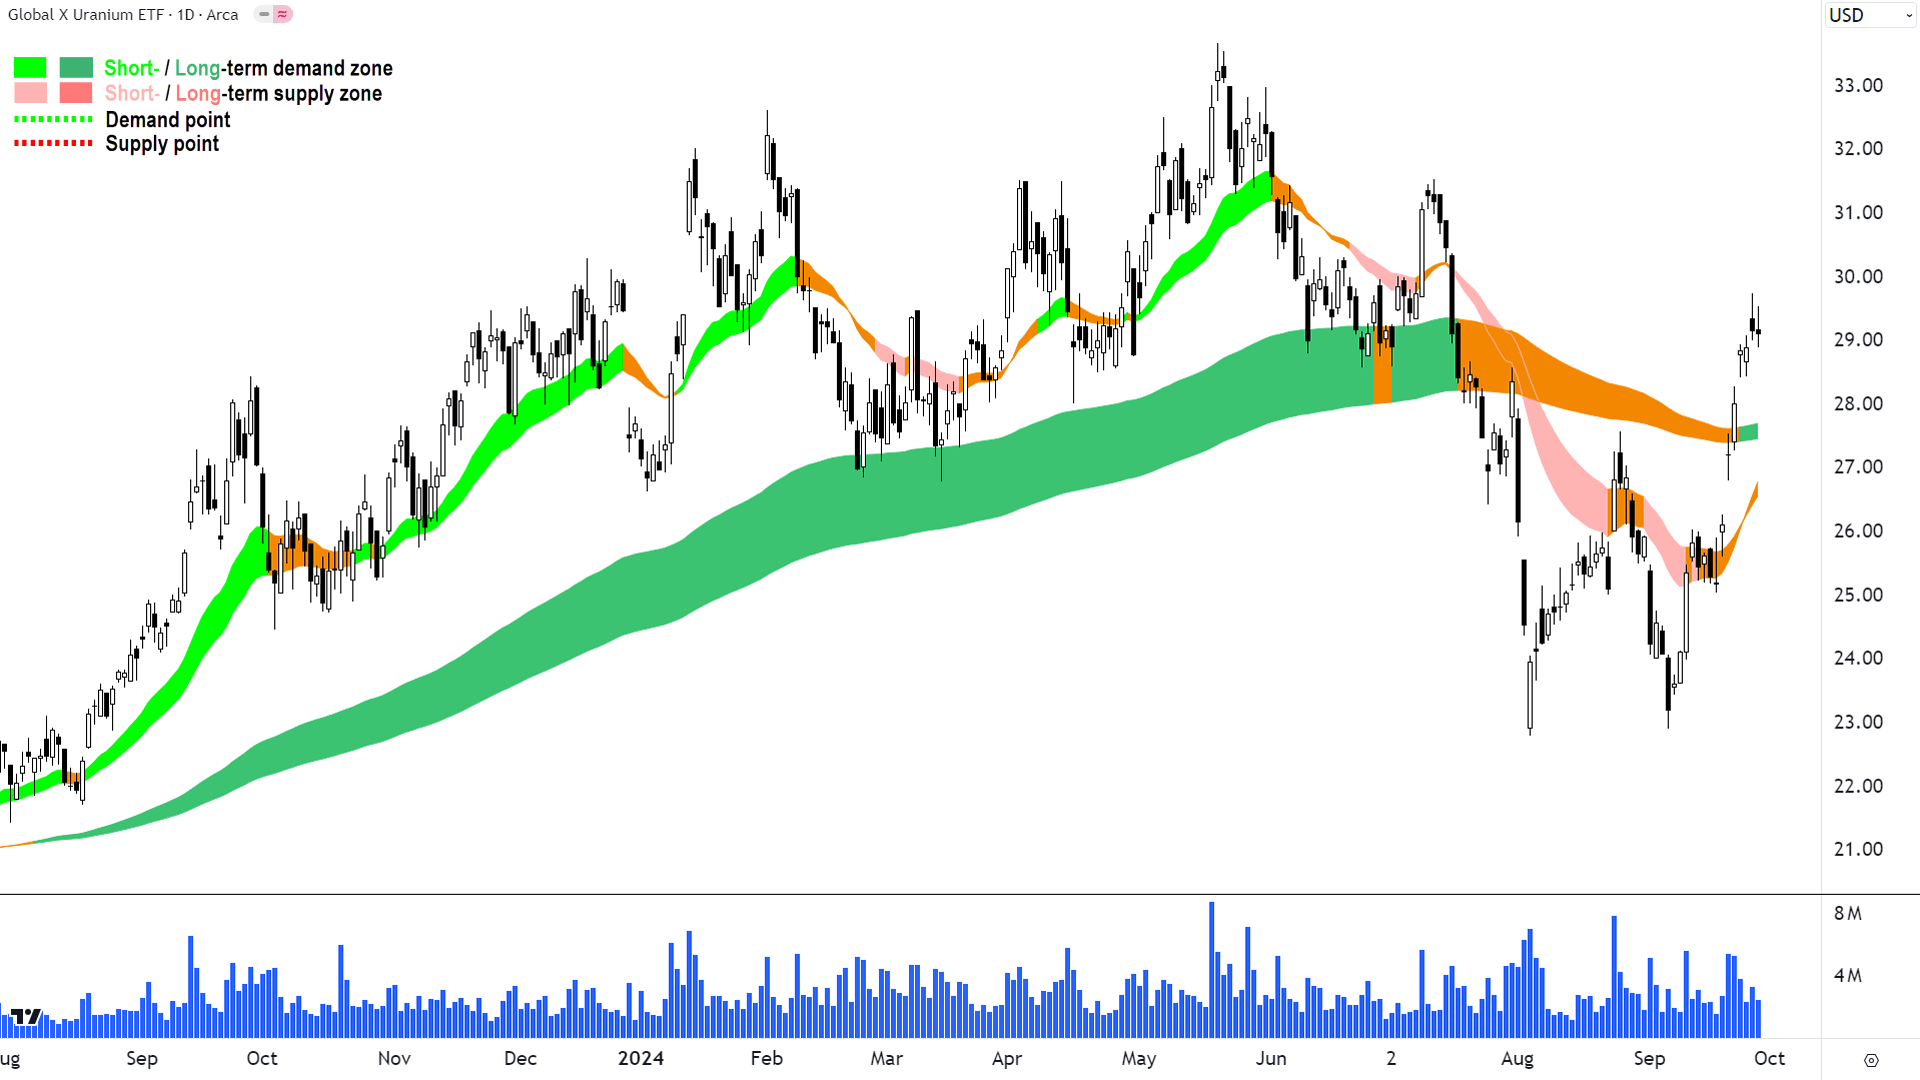
Global X Uranium ETF (NYSE: URA)
%20chart%2027%20September.png)
Global X Uranium ETF chart (click here for full size image)
Not surprisingly the ETF of the world’s biggest uranium stocks resembles strongly the charts of its constituents. There’s nothing extra I need to add here that hasn’t been discussed in prior charts. In summary, the next move is likely crucial, and again, even if it is up, there’s likely to be plenty of pesky points of supply to contend with. Short and long term uptrend ribbons are critical points of demand.
NexGen Energy Corporation (TSE: NXE, NYSE: NXE, ASX: NXG)
%20chart%2027%20September.png)
NexGen Energy Corporation chart (click here for full size image)
The great thing about doing such a sweeping comparison like this is that one gets to see clearly which stocks global fund managers have favoured over others. This is no accident. They have the best information and they vote with their capital. I put to you that NXE has not performed as well as the previous securities in attracting an excess of global capital compared to the active supply of its shares.
The long term uptrend ribbon has not been decisively breached here and the short term trend and price action not as convincing in terms of indicating strong demand-side control.
Setting a trough at / above the long term trend ribbon is critical to maintaining the recent upside momentum. If that does occur, there’s still likely to be substantial latent supply in the system all the way up to the May peak.
A close back below the long term trend ribbon accompanied by supply-side candles and a resumption of falling peaks and falling troughs would likely resign NXE to a retest of the 6 Sep low of 7.04.
Let’s now investigate the charts of the top seven ASX-listed uranium stocks by market capitalisation.
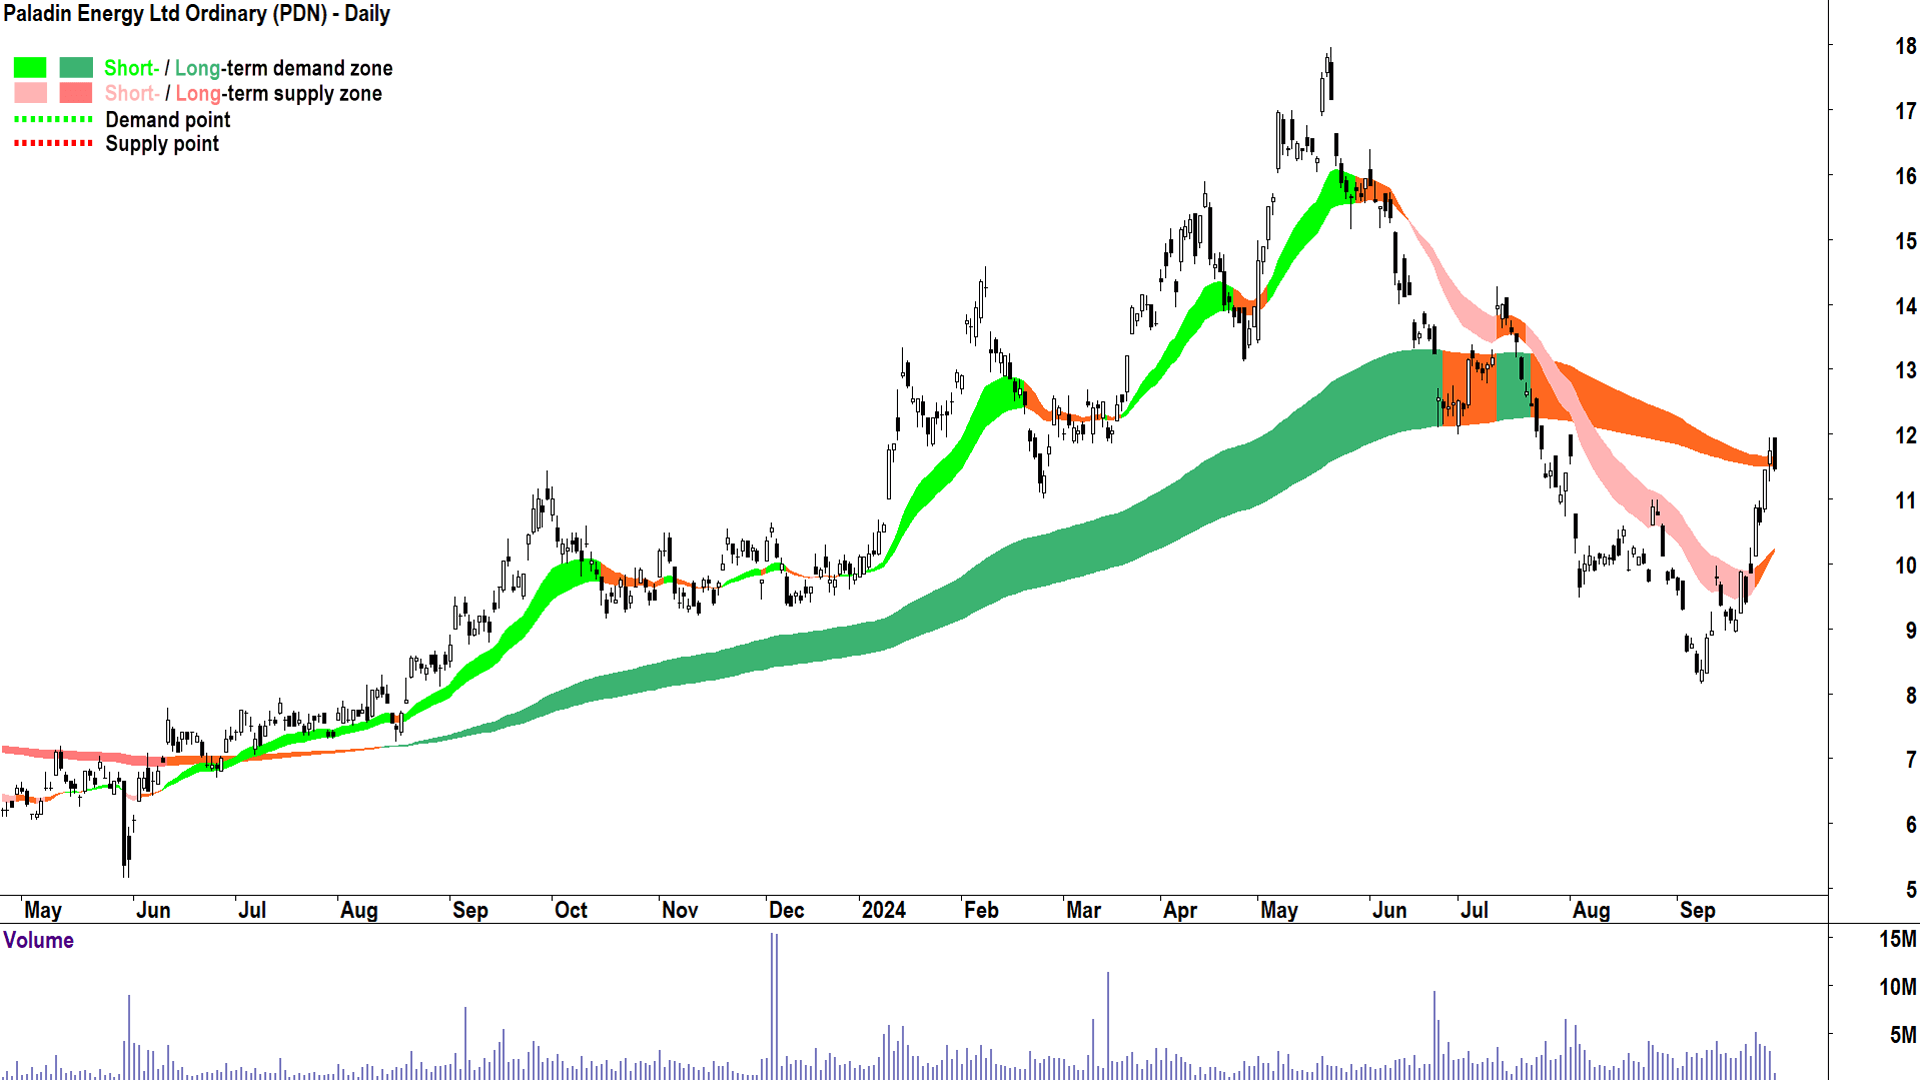
Paladin Energy (ASX: PDN)
%20chart%2030%20September%202024.png)
Paladin Energy chart (click here for full size image)
In my experience, V-shaped rallies are always the most sustainable. The stronger the rally from a major low, the greater the demand has been from short coverers, speculative, and long term positional buyers. Similarly, the lesser has been the supply from lucky buy-the-dippers, and long term investors who are capitulating into the “first decent rally”.
+10% or more with a week is usually a good yardstick for a V-shaped rally, and this is certainly the case here with PDN and several of its counterparts. The uranium rally is therefore credible, and it should not be dismissed as merely a bear market bounce.
However, as I have discussed, with this first phase of the bounce now largely done, the next phase is critical. PDN finds itself at the dynamic supply of the long term uptrend ribbon, and it must overcome it to confirm in the market’s mind the current rally has more to go.
Today’s still live supply-side candle, with its black body and low close is not a great start. Should it end that way, and should we see another few supply-side candle showings, it would likely put a halt to the rally. Subsequent lower peaks and lower troughs would then resume the long term downtrend.
Alternatively, another higher trough at / around the long term trend ribbon, accompanied by some emphatic demand-side candles, would confirm a broader recovery that would likely target the 11 Jul peak at 14.25. Beyond that, it’s likely a relatively fluid journey towards the May peak at 17.98.
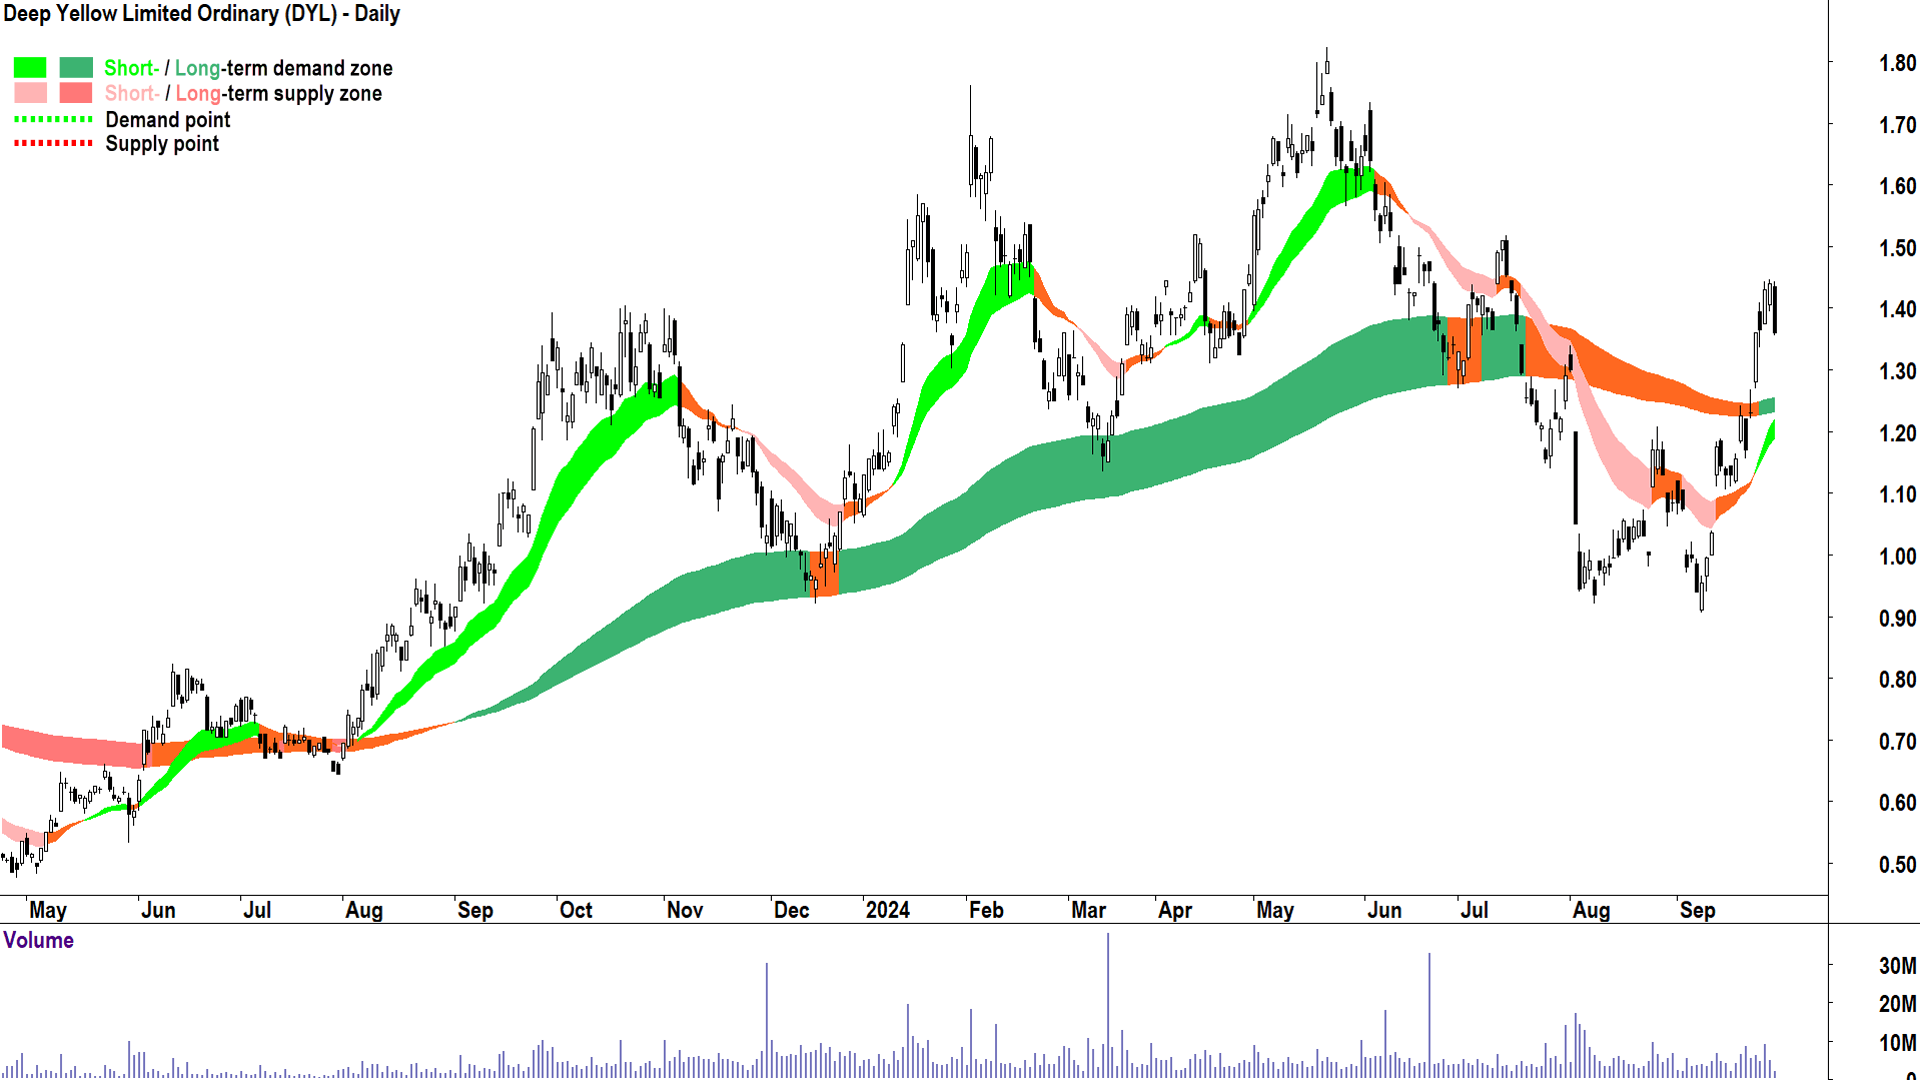
Deep Yellow (ASX: DYL)
%20chart%2030%20September%202024.png)
Deep Yellow chart (click here for full size image)
A significantly better showing than PDN. But there’s also unfortunate similarities in the still-live 30 Sep candle. The short and long term uptrend ribbons are now the critical points of demand – as long as the DYL price continues to close above them the rally is intact.
As is the case with most charts shown here, there’s plenty of latent supply awaiting any rally continuation. For DYL, I note the 15 Jul peak at 1.52, then the 4 Jun peak at 1.735, and finally the 22 May peak at 1.825.
Should the DYL price close back below the short and long term trends, a move back to the 9 Sep low of 0.905 becomes increasingly likely.
Again, ditto on watching closely candles and price action from here. I’ve already discussed the combos you do / don’t want to see.
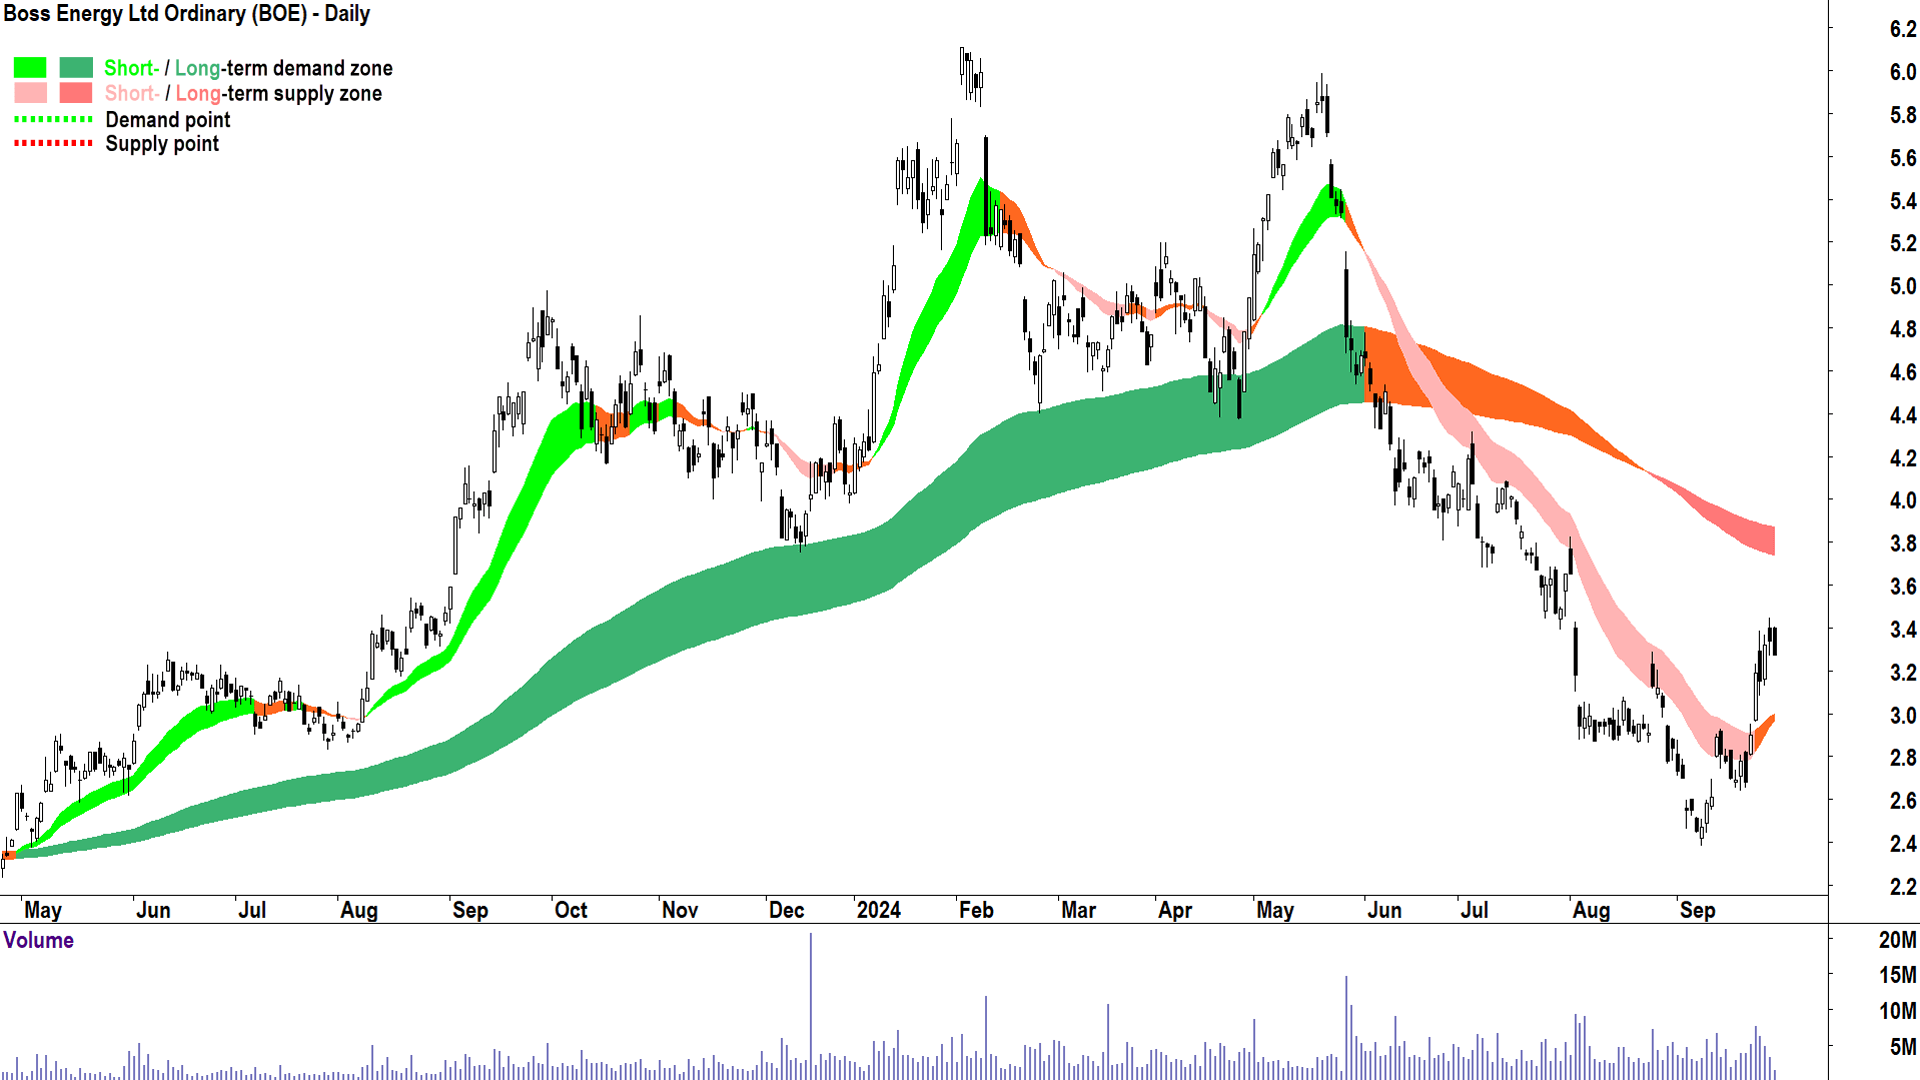
Boss Energy (ASX: BOE)
%20chart%2030%20September%202024.png)
Boss Energy chart (click here for full size image)
If BOE is your chosen uranium stock, I suggest you’re rather disappointed with its rally compared to most of the others in today’s study. Whatever you think about BOE, the market doesn’t rate it as highly as most of the key global uranium players – lesser demand, greater supply. The price action never lies!
This is the first of the charts we’ve seen so far that shows a clearly defined long term downtrend ribbon. The short term trend ribbon is neutral, but the price action has transitioned back to rising peaks and rising troughs. Candles are more mixed than the others so far – it’s hardly been an all white–all downward pointing shadow affair since the September low.
BOE might not even make it to the dynamic supply usually associated with the long term downtrend ribbon, and I suggest a return to supply-side candles and lower peaks and lower troughs would be damning here. Alternatively, a close above the long term trend ribbon is essential, and preferably this happens very quickly – otherwise I suggest the market will lose its patience with BOE.
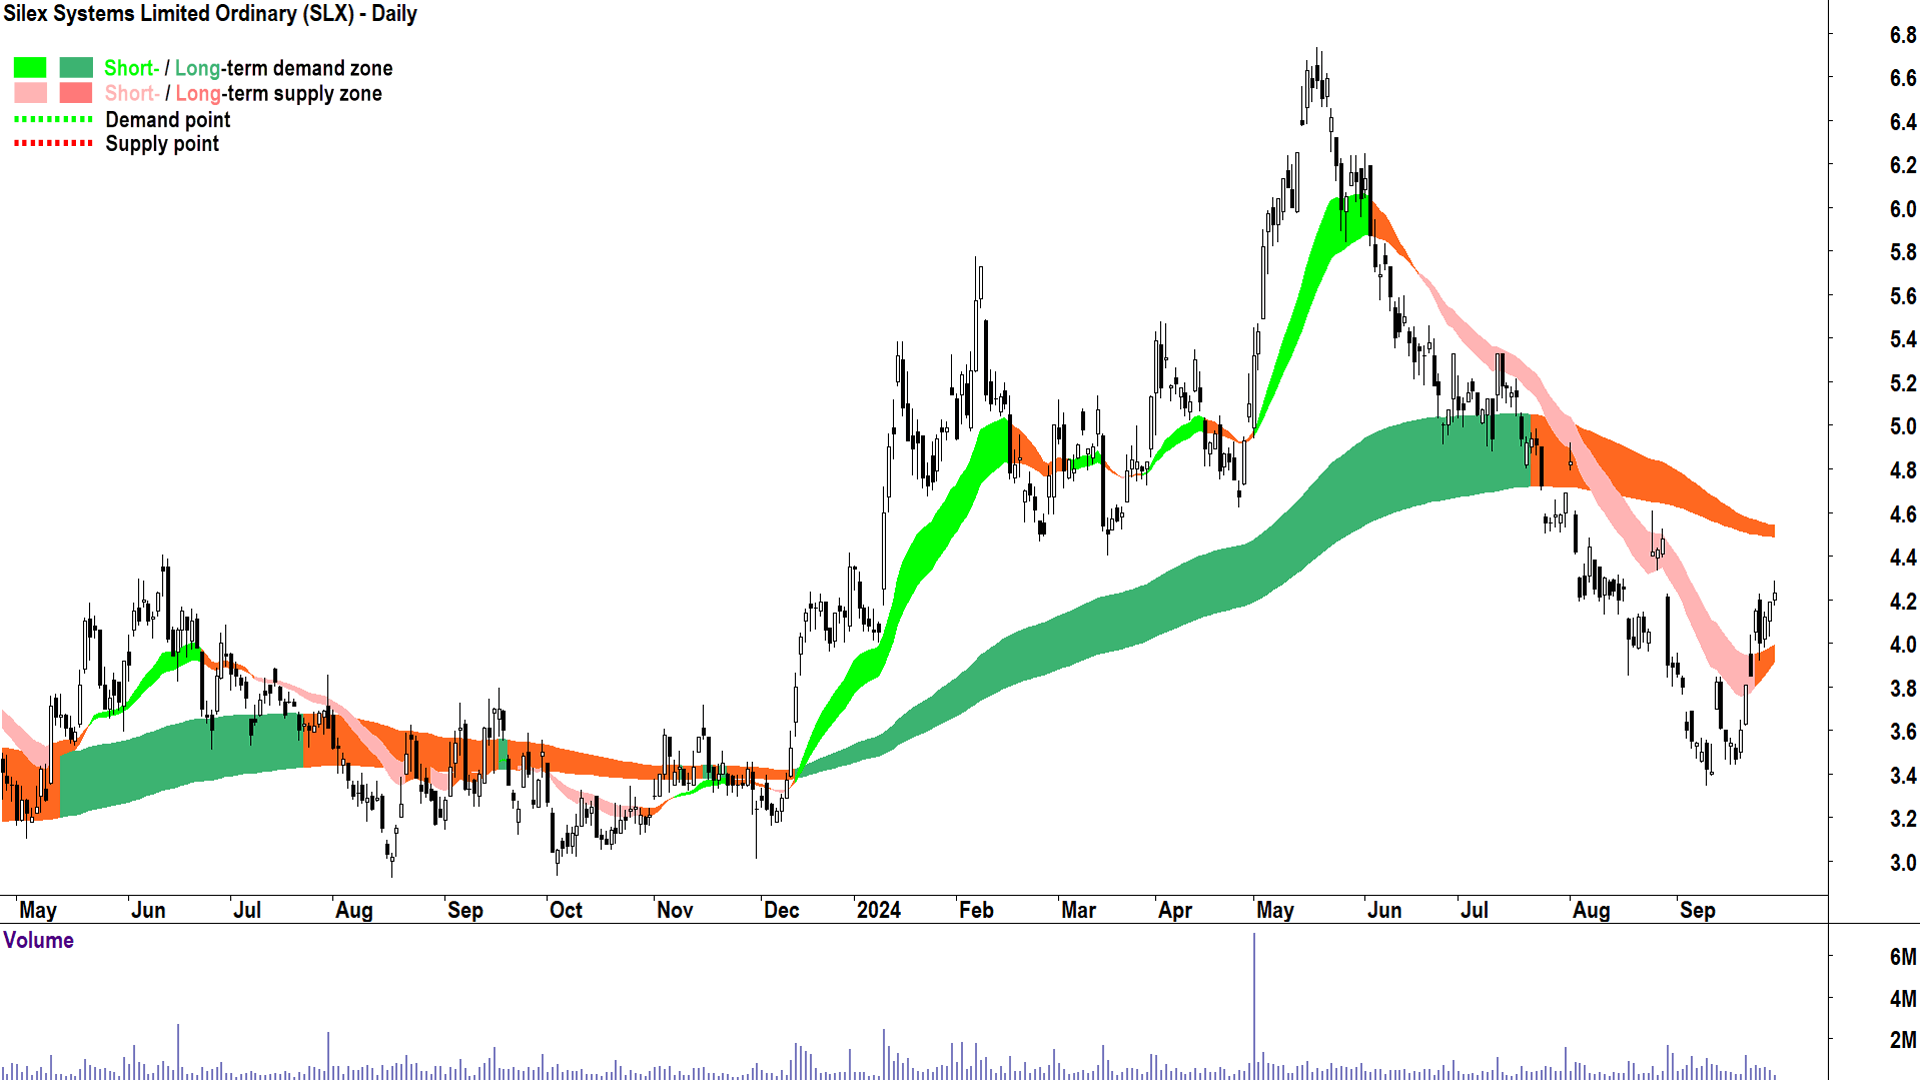
Silex Systems (ASX: SLX)
%20chart%2030%20September%202024.png)
Silex Systems chart (click here for full size image)
The SLX technicals are more like the BOE technicals than, say, the DYL, CCJ, and UEX technicals, that is, they are less convincing of strong demand-side control.
However, I’d say the candles are arguably better than BOE here, and the long term trend less-well-established to the downside. Still, I question why one would favour buying SLX over any of the other charts I have identified here as having superior indications of demand-side control.
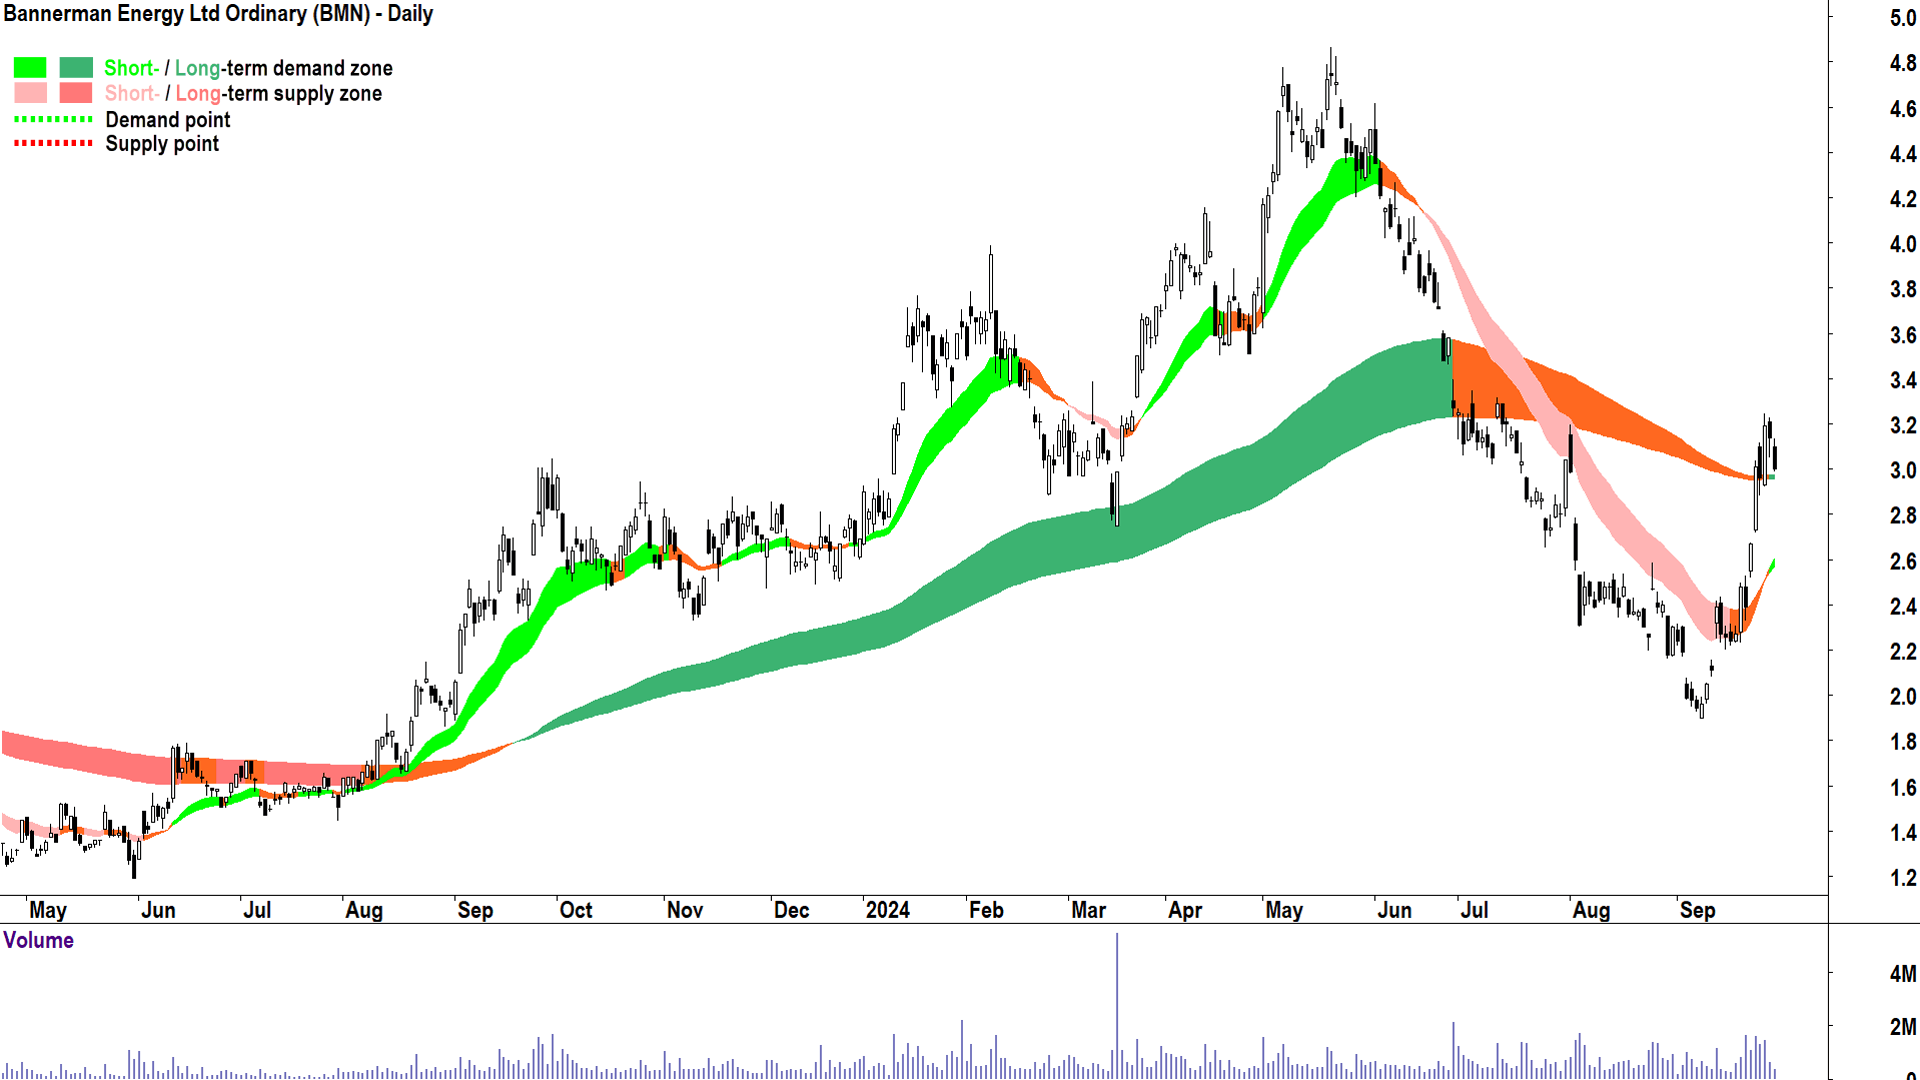
Bannerman Energy (ASX: BMN)
%20cha10.%20rt%2030%20September%202024.png)
Bannerman Energy chart (click here for full size image)
Not the best and not the worst of this bunch. Like the rest of those that have bested the long term trend ribbon, it will be interesting to see if BMN can now hold that level. If it can, this is one of the cleaner rallies so far in terms of price action and candles. It’s also perhaps the most fluid in terms of the decline into the September low. This means it could also have the easier of runs back up to the May high.
Friday’s and today’s (live) candle aren’t inspiring, but I wouldn’t write this one off just yet. As with so many here – candles and price action from now will be crucial!
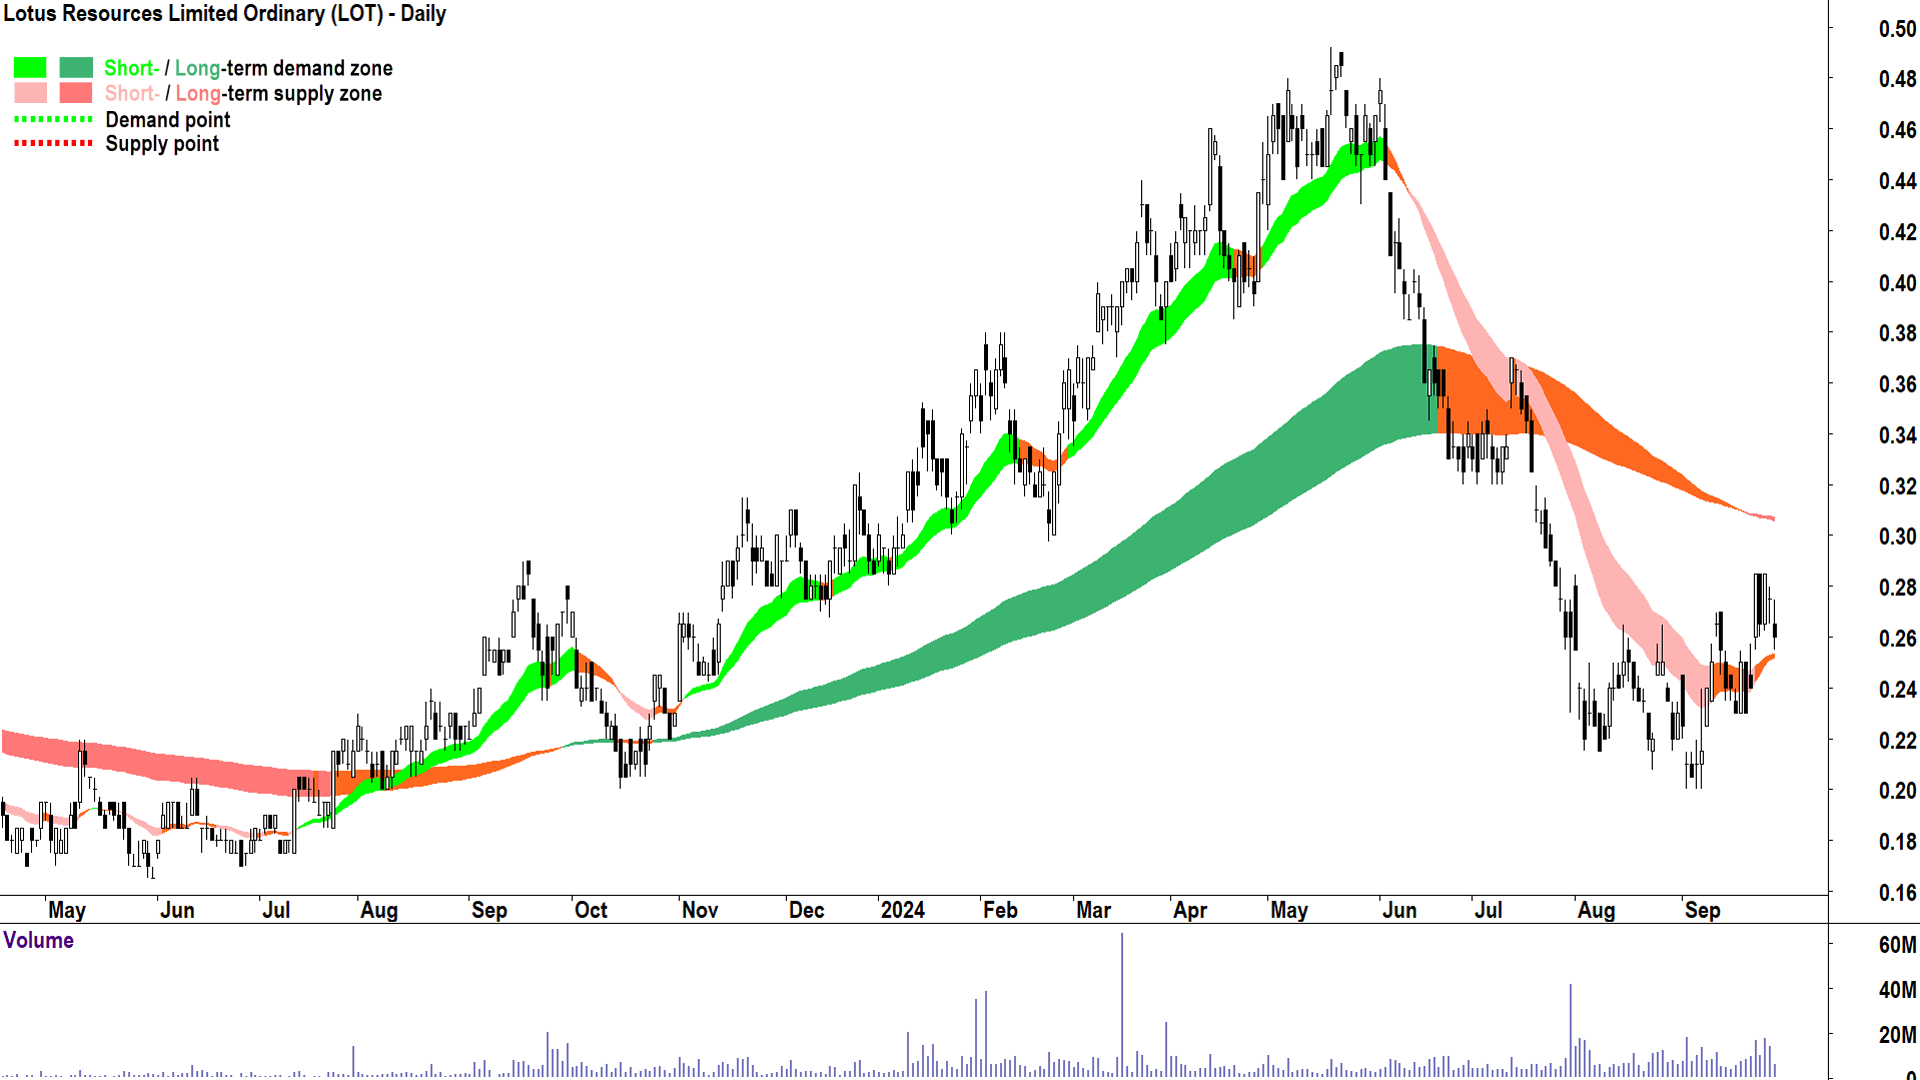
Lotus Resources (ASX: LOT)
%20chart%2030%20September%202024.png)
Lotus Resources chart (click here for full size image)
This is in my opinion the chart with the least convincing rally so far. The price action has been significantly overlapping (peaks and troughs overlapping each other instead of being situated apart as is the case with previous charts). Candles are also more mixed, and the long term trend ribbon has just confirmed a transition to down despite the recent rally.
I put it to you that global fund managers aren’t chasing LOT shares above other opportunities in uranium. If they haven’t up until now, what would make them all of a sudden change their minds? That’s not something I can find in the charts…so next!
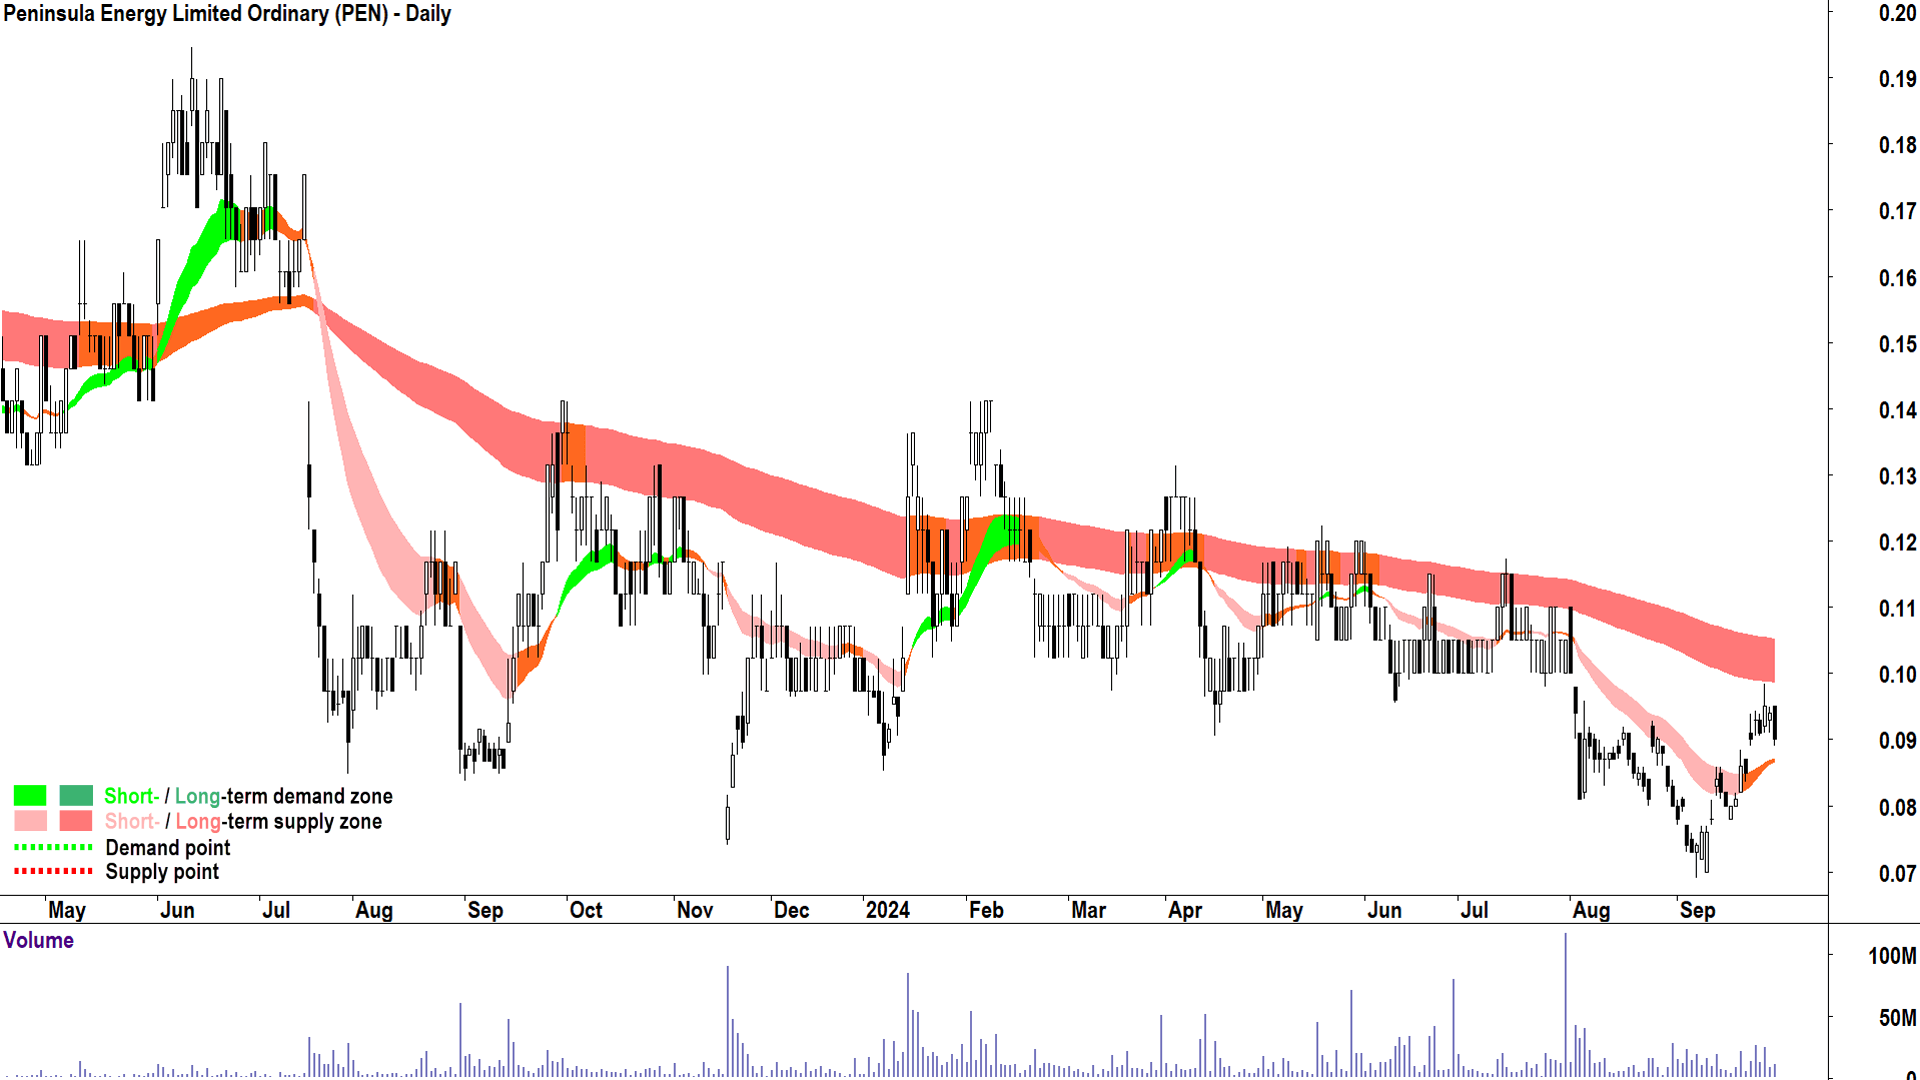
Peninsula Energy (ASX: PEN)
%20chart%2030%20September%202024.png)
Peninsula Energy chart (click here for full size image)
PEN is the clear odd one out given it didn’t experience the massive bull market rally that most of its counterparts did through 2023. This speaks volumes in itself. I am a big believer in buying the best stocks in the most sought after sectors. I suggest PEN would not qualify to earn a place in my portfolio in this regard.
A decent and credible rally from the September low, though, but not enough to move the dial on the very well established long term downtrend. Neutral at best here.
Conclusions: Is the low in uranium in?
I can’t tell the future. To try to do so is pointless. My brand of trend following technical analysis does not prognosticate, it can only react. With this in mind, it is clear from the above charts that the supply side has backed off significantly over the last couple of weeks and that the demand-side appears to be increasingly more active.
But in nearly all cases, more needs to be done before my model would say many of the charts shown here are in long term uptrends.
One positive is that in most cases, a credible rally has transpired. On a case by case basis, continued showings of strong demand-side candles and bullish price action – particularly that which holds the long term trend ribbon is vital to these rallies continuing.
One thing which is equally clear, is that none of the charts reviewed today is consistent with long term excess demand, that is, demonstrating strong short and long term uptrends, trend ribbons are acting as zones of dynamic demand, a predominance of demand-side candles, and rising peaks and rising troughs.
These are the charts I am looking to apply the bulk of my capital to. I do also like to add some capital on turnaround plays, of which many charts above would fall into the category of. For these setups, I note that the “when to buy” is far less important than the “how much to buy”.
I prefer to gradually move into a trade after I see at least preliminary signs the long term trend is changing. If the price action continues to reflect growing demand-side control, I am allowed to continue to increase my position. If the price action doesn’t warrant it, I pause or get out. In this way, by the time the trend change does occur, I already have some skin in the game.
In short: I don’t fear missing out on picking the bottom, so I don’t fret not getting my whole lot in at the bottom. This is the overwhelming desire of greedy gamblers! The only thing I fear is not following my model.
