
Is gold finally oil-proof? Top ASX gold stocks as the bull market reignites
An oil price spike crushed gold in March, but this time bullion and the miners are rallying alongside crude – and that changes things.

Source: Market Index, Shutterstock
Mentioned
KEY POINTS
- Gold’s bull market ran into a wall in March when Middle East conflict sent crude sharply higher, dragging bullion down and hitting ASX gold miners twice over – on a falling gold price and rising diesel costs.
- Crude is climbing again on simmering Middle East tensions as Iran seems reluctant to settle. Yet this time, gold has posted its strongest week in over six months, and ASX gold stocks have run harder still.
- We unpack what broke the oil–gold link, run through the latest demand and supply signals from institutional research and the World Gold Council, and set out where the brokers now stand on ASX gold names.
Gold’s massive bull run between October 2023 and February this year caught the attention of most Australian investors, who very likely owned a selection of ASX gold explorers, developers, or producers along the way. Gold rose from around US$1,800/oz to just shy of US$5,600/oz – a gain of over 210%.
ASX gold stocks responded in kind, with four- and five-fold gains common among the majors, and multiples of that for explorers and developers lucky enough to ride the wall of investor money that flooded the sector.
Then the Middle East conflict hit. The Strait of Hormuz closed. The price of crude oil went vertical. And what followed was an inverse relationship that perhaps demonstrates gold’s greatest weakness – its sensitivity to market interest rates.
Higher oil meant higher inflation expectations – which meant a repricing of benchmark bonds to compensate holders for the erosion of their capital – and higher interest rates followed. Even the most ardent gold bug must agree that gold is a financial asset, not an industrial commodity, and one without a yield. Worse, those who wish to own gold must pay handsomely to store it securely and to insure it.
Gold is expensive to own compared to, say, a high-yielding stock or a bond, or even just plain old cash in the bank. So, when investors can earn a higher yield on other financial assets that proxy gold’s “safe asset” status – the opportunity cost of owning gold increases. Historically, this typically means the price of gold must fall.
And fall it did – around 30% by 30 June. ASX gold miners copped it from both ends, because diesel is among the largest single line items in an open-pit mine’s cost base. The All Ordinaries Gold Sub-Index was down nearly 40% at its worst.
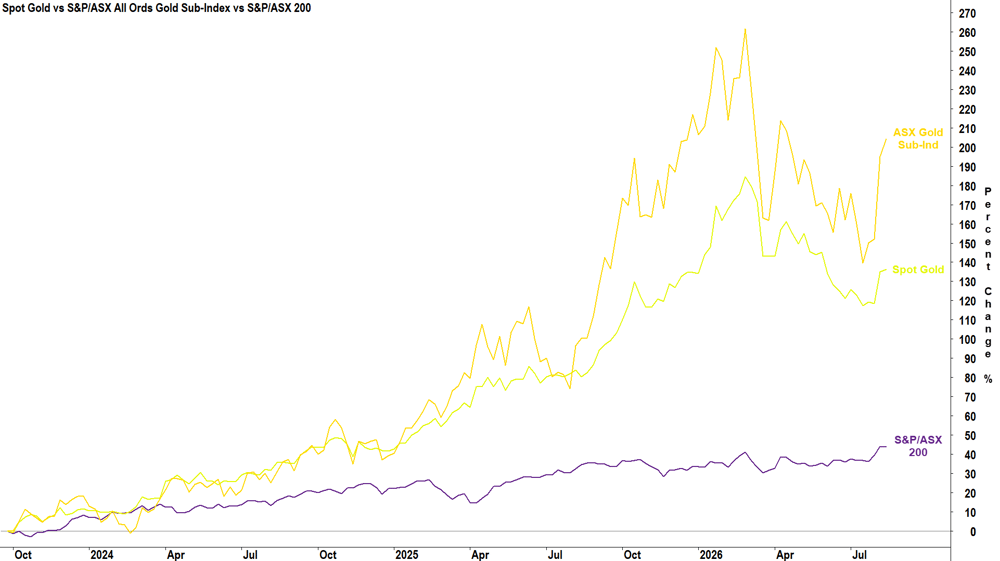
Spot Gold vs S&P/ASX All Ords Gold Sub-Index (XGD) vs S&P/ASX 200 (XJO) chart. Total return indices for XGD and XJO used, so analysis includes all dividends paid.
Crude is on the move again, with regional tension simmering and Tehran showing little appetite for a durable settlement – probably because they’ve realised that holding out costs the White House more than it costs Iran.
So, oil’s back up, which means gold’s down again, and ASX gold stocks have been hit even harder still. Right?
Nope, that’s not what’s happened this time. Gold closed yesterday at US$4,407/oz, up 11.8% from its 30 June low and after its strongest week in over six months. Local gold stocks? Multiples of that… +31.9% from their nadir on the back of nine straight days of gains.
Now, I know what you’re thinking, nine days do not a regime change make! But it does raise an important question for investors: Is gold now oil-proof? And if it is, surely then it makes ASX gold stocks a buy?
In this article, I’ll work through what broke the oil-up-gold-down correlation, including the latest demand and supply data, and where the big brokers land on the ASX’s biggest gold mining names (yes, there are plenty of buys!).
What changed in the oil–gold relationship?
The oil-up-gold-down relationship certainly became entrenched in traders’ minds after the Middle East conflict began in late February, according to Citi’s latest gold note. But the negative correlation began to break down around June as the oil price moderated, once the “degrossing” flows driving it had worked through. Degrossing is what happens when hedge funds are forced to shrink their books, selling their long-side winners and buying back their shorts at once. The gold sell-off wasn’t so much a verdict on the precious metal – it was a scramble for cash. And with such huge accumulated profits, it was the obvious thing to sell.
In its latest weekly gold update, Canaccord Genuity believes the snap-back over the last couple of weeks was driven by a push from two directions that oil has nothing to do with:
A major currency intervention that reminded the market what gold isn’t: Washington stepped in to support the yen after it fell to nearly 40-year lows against the US dollar. Japan is the largest foreign holder of US Treasuries, and with US yields already at multi-year highs, the US couldn’t risk Japan funding support of the yen by selling down its holdings. Gold isn’t a currency that’s controlled by any government, nor is it a government IOU – this intervention was a reminder of why investors love gold’s independence.
The US jobs engine has stalled: July payrolls fell 23,000 against expectations for a 57,000 gain, and the prior two months were revised down by a combined 103,000 – on top of 74,000 the month before. Participation dropped – another sign of a weak labour market (job seekers giving up on finding employment and withdrawing altogether) – and Fed funds futures have pushed the expected next 25 basis point hike from September out to December. Remember – gold loves lower interest rates, and US rates are set to remain on hold longer.
Neither of these gold-positives runs through the oil price. Crude still matters – it’s just not the only thing that matters any more. “Oil-proof”? Hmmm… Getting warmer…🤔
Demand: the upside drivers for gold
China is buying every dip: The People’s Bank of China (PBoC) bought 640,000 ounces in July, up from 480,000 in June and its largest monthly purchase since October 2023. That takes PBoC buying to 1.93 million ounces over seven months – already more than double the 860,000 ounces it bought in all of 2025.
Central banks are back as the marginal buyer: The latest data from the World Gold Council has central banks buying 289 tonnes in the June quarter, up 62% year-on-year and a sharp recovery from a weak March quarter that was itself revised down. That was enough to partly offset a collapse in retail bar and coin and ETF buying.
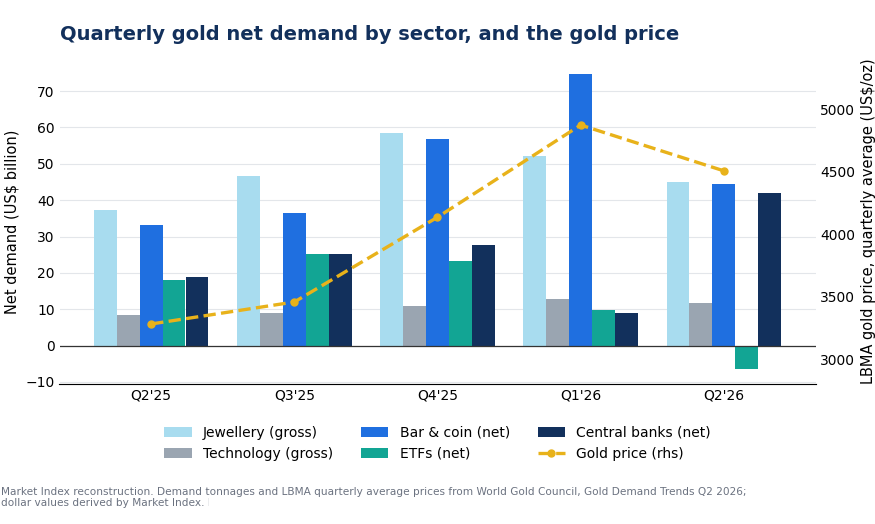
Quarterly gold net demand by sector, and the gold price. Market Index reconstruction from World Gold Council, Gold Demand Trends Q2 2026 – dollar values derived by Market Index from WGC demand tonnages and LBMA quarterly average prices.
India’s weakness is seasonal, not structural: Indian imports have been squeezed by a weaker rupee, higher duties and soft investment sentiment, with local prices at around a 1% discount. Citi reads the June-quarter decline as largely seasonal destocking and expects demand to recover from October with Dussehra, then Diwali and the wedding season.
Consumer demand is holding up in dollars, if not in tonnes: Jewellery consumption fell to 278 tonnes in the June quarter on World Gold Council data, the lowest quarterly volume since the pandemic, as gold became less affordable. But spending on gold jewellery rose 14% year-on-year to US$40 billion – suggesting that gold is holding its share of consumer wallets.
The physical market is far too small to absorb a wealth shift: Citi’s central argument is that a year of global mine supply is worth only about 0.1% of total household wealth (i.e., property, equities, bonds, cash), so a shift of just $1 in every $1,000 of household investment into gold would require miners to double output. They can’t – so the only gold available to new buyers is gold somebody already owns. Price is the sole mechanism for prising it loose, and it would need to keep climbing until enough current holders decide to sell to meet such a demand shift.
Importantly, none of these key demand drivers takes its cue from the oil price. Hmmm… Warmer still… 🤔
Supply: the downside risks for gold
Central bank accumulation cuts both ways: Gold now accounts for around 35% of global central bank reserves on Citi’s estimates – the highest in some 30 years, and enough to make it the second-largest reserve holding in the world. That’s part of the bull case, but it also begs the question: how much higher can they go? The World Gold Council expects another strong year – though likely below 2025.
Producer margins are fat, but they’re struggling to increase production: June-quarter mine production rose 2% year-on-year while recycling fell 6%, leaving total supply flat at 1,269 tonnes. Citi sees no sign of a meaningful supply response despite prices that have disconnected from the marginal cost of production – and history says that response takes 3 to 10 years.
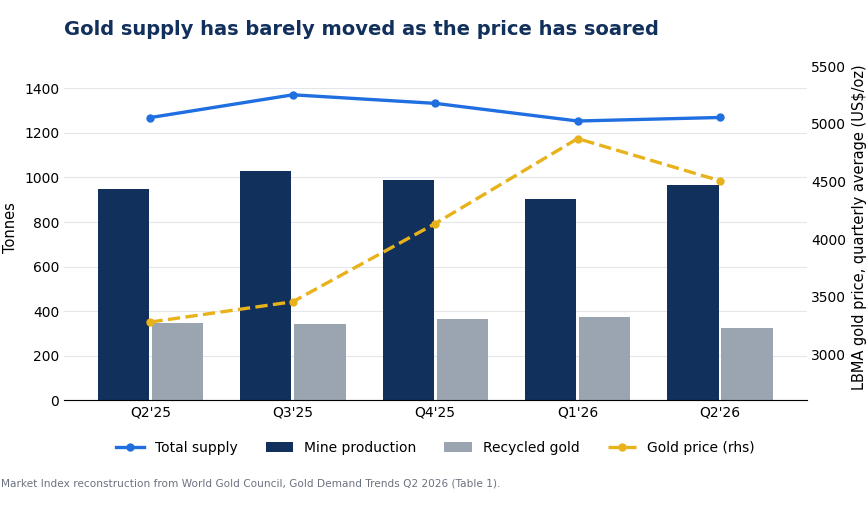
Gold supply has barely moved as the price has soared. Market Index reconstruction from World Gold Council, Gold Demand Trends Q2 2026 (Table 1).
A hawkish Fed surprise could swing the powerful investment dollar: The pre-2022 model for pricing gold – inflation-adjusted interest rates and the US dollar – broke down when central banks became the dominant buyers, but Citi says it has partially reasserted itself as investors regained control of trading flows. The June quarter shows why: despite central banks buying at their fastest rate in five quarters, the average gold price still fell 8% as ETFs turned net sellers for the first time in two years. Fed hikes beyond what the market is expecting would likely swing investors back to the sell side of the ledger, a scenario Citi cites as a major risk facing gold.
A major US–Iran re-escalation could replay: Citi’s view is that a full-blown escalation could trigger another wave of degrossing, particularly if equity prices were to unwind, and re-establish the old negative correlation between oil and gold. If the conflict were to drag, Citi sees gold falling as low as US$3,500–3,600/oz. There is a caveat here: were an escalation to hit energy infrastructure, market focus would eventually shift from inflation to stagflation – which historically favours gold.
Note that just the last of these risks runs directly back through the oil price – and possibly the Fed surprise does too, should a Middle East re-escalation reignite inflation fears. Hmmm… “Oil-proof” is looking a little tenuous… 🤔
Where the brokers stand: a golden opportunity
Whatever the gold price has done this year, the operating leverage underneath these businesses has rarely looked better. Canaccord Genuity estimates a record average all-in sustaining cost margin of US$2,460/oz for the sector in 2026 – up 40% on 2025, which was itself double the margin earned in 2024 – with balance sheets largely in net cash and record dividends and buybacks following. Citi has high-cost producer margins at their widest in half a century, and still historically elevated even after the gold price decline.
Fat profits across the sector make for a very positive view of ASX gold stocks across the broking community. Only two of the top 17 gold stocks by market capitalisation are rated as a consensus Hold – although Evolution Mining (EVN), at 0.45, sits on the cusp of a broker consensus Buy.
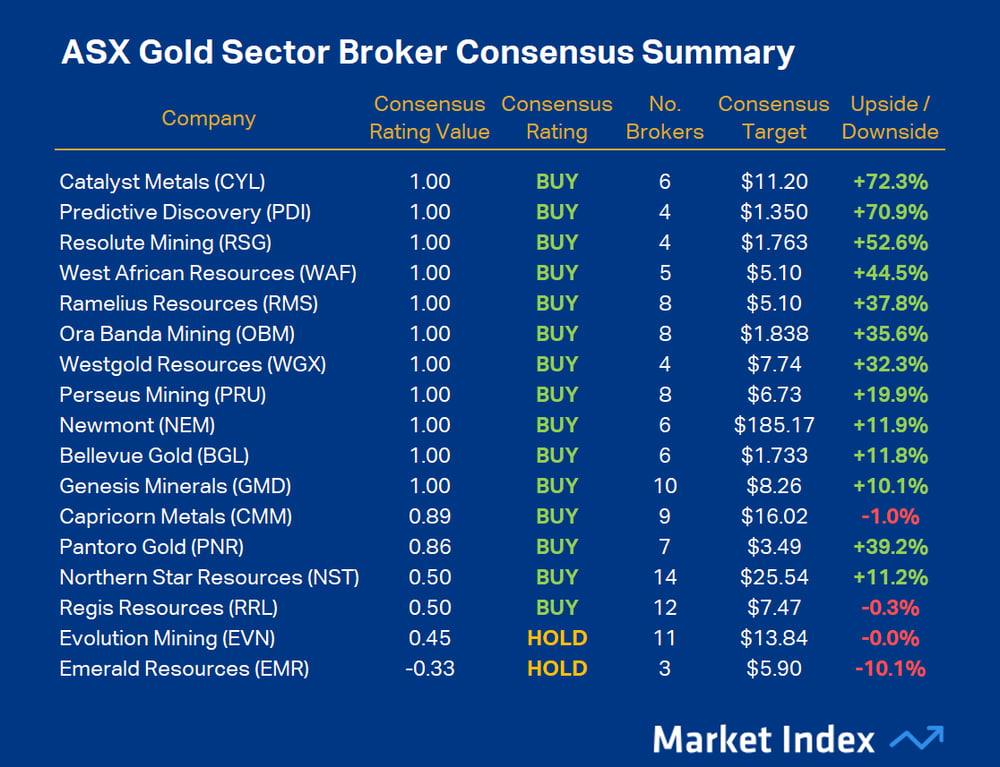
ASX Gold Sector Broker Consensus Summary 12 August 2026. Source: Market Index Broker Consensus. To obtain a stock’s Broker Consensus Rating, we assign a value of +1 to any rating better than HOLD / NEUTRAL / MARKETWEIGHT, a value of 0 for any rating equivalent to HOLD / NEUTRAL / MARKETWEIGHT, and a value of -1 to any rating worse than HOLD / NEUTRAL / MARKETWEIGHT. We then take the average of all assigned rating values and assign a Broker Consensus Rating of BUY to values of +0.5 or greater, a rating of HOLD for values from -0.5 to below +0.5, and a rating of SELL for values less than -0.5. The Broker Consensus Target is simply the average of the target prices we have on file for each broker. Typically, brokers define their target prices as a 12-month forecast. Each target price is based on fundamental valuation assumptions. Upside/Downside data based on closing prices 12 August 2026.
On price target upside, only EVN, Capricorn Metals (CMM), Emerald Resources (EMR), and Regis Resources (RRL) trade above their consensus targets, with the top picks based on consensus rating and target being Catalyst Metals (CYL) with 72.3% consensus upside, Predictive Discovery (PDI) with 70.9% consensus upside, and Resolute Mining (RSG) with 52.6% consensus upside. Consider that the more brokers cover a stock, the more accurate its consensus is likely to be.
On gold itself, Citi’s 60% probability base case has gold stagnating or drifting lower through August before rallying to US$4,500 in the December quarter and to US$5,000/oz by the first half of 2027. But this prediction was made just before the last price spike to US$4,400 – so Citi has largely nailed its first leg of the call early.
Gold could hit US$5,000 this year if there’s a quick resolution to the Middle East conflict and if the Fed turns more dovish than the market expects, says Citi, but it rates this as only a 20% chance of occurring. The bear case, also weighted at 20%, is pegged to another round of degrossing on a hawkish Fed surprise, a major conflict re-escalation, or an AI-driven stock market collapse.
Conclusion: the queues are gone, for now!
In March, oil up meant gold down and ASX gold stocks down even harder. Crude has shot higher again these past two weeks – only this time gold is up, and ASX gold names have bolted. Yet even after the appreciation, brokers remain bullish on ASX gold stocks.
The queues in Martin Place have gone, along with the speculative demand that punctuated gold’s last peak. In the last quarter, investment demand more than halved and ETF holders turned net sellers. But the research suggests several other robust demand-side factors are pressing against a supply side that can’t respond quickly.
So, is gold oil-proof? Not quite. A serious re-escalation in the Middle East conflict could send crude higher again – but oil was never really the enemy, just the fastest route to the higher interest rates that are gold’s only true rival. Which makes the Fed, not the Strait of Hormuz, the thing to watch.
This article draws on institutional research from Canaccord Genuity and Citi (August 2026), gold supply and demand data from the World Gold Council (July 2026), price and index data from Norgate Data (August 2026), and broker ratings and price target data from Market Index Broker Consensus (August 2026). Charts are Market Index reconstructions built from World Gold Council data.
