
How far can the prices of WBC, ANZ, CBA, and NAB shares stretch before valuations snap back?
Bank shares are under pressure today after Westpac's update, brokers are bears, and mums and dads are selling — so who's still buying?


Source: Market Index using ChatGPT
Mentioned
KEY POINTS
- Westpac’s third-quarter trading update has flagged a sharp slowdown in the sector’s core earnings driver — mortgage applications are down around 20% since May’s budget changes, with margin pressure flagged to build further into year-end.
- Bank shares are under pressure this morning as investors mark down earnings expectations, but if recent trends are any guide, super funds and offshore institutions will step in as buyers to steady the ship regardless of valuation.
- This article reveals exactly who’s setting bank valuations now, why passive money buying may stretch valuations much further — and why millions of Australians may end up wearing the loss when the elastic band eventually snaps back.
Bank shares are under pressure today following the release of Westpac Banking Corp’s (WBC) third quarter trading update. The headline: “Mortgage applications plunge 20% post budget”. So, is that it? Do we call time on one of the best periods of share price performance for the group in a generation?
For the better part of two years, I’ve tracked a peculiar split personality in the share prices of Australia’s Big Four banks. My research suggests that today’s headlines are unlikely to derail the momentum of our Big Four banks’ share prices — at least in the medium term.
Indeed, analysts at the major brokers and investment banks have argued that softer net interest margins, a housing market coming off the boil, impairment charges lifting from an unusually low base, and other reasons must inevitably cool the sector’s share price appreciation. Yet, share prices of the Big Four have kept climbing, and so have the multiples investors appear comfortable paying for a dollar of their earnings.
New data has just landed that helps explain this split — and it helps answer some of the questions I posed in a recent article I wrote on the sector: is passive, or ‘dumb’ money skewing valuations in the sector, confounding active, or ‘smart’ money, and setting the banks up for potentially years of strong performance — regardless of their fundamentals?
Today, I provide a fresh look at who actually owns ANZ Group (ANZ), Commonwealth Bank of Australia (CBA), National Australia Bank (NAB) and WBC, and why passive buying may have room to stretch their valuations much further yet. I’ll also show who is likely left wearing the loss — quite possibly millions of ordinary Australians — when the elastic band eventually snaps back.
Who’s selling the Big Four banks?
In my last article I examined whether the gap between institutional research and market pricing of the Big Four had become unbridgeable. That piece put a theory on the table: that passive superannuation and offshore ETF flows were quietly filling the gap left by cautious active fund managers responding to stretched sector valuations.
New data on Big Four bank ownership, presented by Morgan Stanley, has now backed that theory with hard numbers, but it also shows that retail investors — direct shareholders, self-managed super, the classic mum-and-dad register — have been shrinking as a share of the Big Four’s ownership for three straight years running. By the broker’s latest estimate, this group is down an average of 7.3 percentage points across the four banks between June 2023 and June 2026.
S&P/ASX 200 Banks Industry Group Total Return Index chart (total return equals dividends and capital change)
According to Morgan Stanley’s data, retail participation in bank shares has waxed and waned for much of the last decade when share prices were largely range-bound. Mums and dads learned to sell at the top of the range and buy back at the bottom.
But in late 2023, the top of that range finally broke. The S&P/ASX 200 Banks index — which had compounded at just 3.2% a year, dividends included, through eight-plus years of trading range — has returned close to 25% a year since, more than doubling in total.
Here’s the part that’s hard to write off as coincidence: Morgan Stanley’s 7.3-percentage-point retail exit from bank shares sits across exactly the same window — 2023 to 2026. The retail investor’s mantra of ‘buy low and sell high’ broke — and their collective ownership in the Big Four has been shrinking since.
But it wasn’t only retail that was left perplexed. The broking community and the active fund manager community have run an almost unanimous underweight stance on the Big Four for the bulk of their three-year share price re-rating, with one fund manager interviewed by Livewire Markets colourfully remarking he’d “rather stick pins in his eyes” than buy CBA shares.
That view isn’t isolated among domestic active managers. According to Morgan Stanley’s positioning data, CBA is currently the largest underweight held by the investor group, at an estimated -3.3 percentage points of active weight. Further, according to the latest ASIC short sale data, CBA is the single most shorted stock on the ASX by dollar value — more than RIO, more than BHP, more than anything else in the market. Indeed, each of the Big Four sits inside the 13 most-shorted stocks on the ASX by dollar value — CBA #1, WBC #4, NAB #7, ANZ #13.
Broker Consensus across the Big Four last 24 months. Source: Market Index Broker Consensus. Broker Consensus Ratings are calculated by assigning +1 to any rating better than Hold, 0 to Hold, and -1 to any rating worse than Hold, then averaging across all covering brokers — a Buy consensus requires an average above +0.5, Sell below -0.5, with Hold in between. The Consensus Target is the simple average of each broker’s 12-month price target.
Broker sentiment on the Big Four has run negative for almost the entire rally, with Market Index Broker Consensus data showing the average Consensus Rating Value (CRV) falling from near-neutral (-0.06) in December 2023 to its most bearish point (-0.49) in December 2025 as their collective share prices soared. It’s eased since then, to the current -0.24 — the least bearish reading since June 2024 (consensus for the banks is likely to change this week following their trading updates — I’ll bring you the latest changes soon!).
The valuation gap has been even more persistent: in every one of the seven broker consensus snapshots since December 2023, the average price target has sat below the actual share price. That gap briefly narrowed to just -5.6% by mid-2026 as targets caught up with the rally, only to blow back out to the current -13.9% as the Big Four’s latest share price run-up has outpaced the brokers again.
The split between banks is just as telling. CBA has carried an outright Sell consensus in every one of the seven periods, and it remains the brokers’ most disliked stock. Compare this to ANZ, which has been the best-rated bank in six of the seven snapshots and has just reclaimed a consensus Buy. The brokers have been wrong on this call too — CBA's share price has climbed roughly 78% since mid-2023 against ANZ's 57%. The bank the brokers liked least has comfortably outperformed the one they liked most.
So then, who’s buying the Big Four banks?
The answer to this question also sits in Morgan Stanley’s share register data. Domestic institutional ownership of the majors has risen by an average of 4.2 percentage points since June 2023, and offshore institutional ownership is up a further 3.1 points — together accounting for the entire 7.3-percentage-point retail exodus, share for share.
The domestic institutional half of that flow has a name, and it’s one every working Australian contributes to without a second thought: superannuation. Total superannuation ownership of the listed banks has climbed from around 25% in 2019 to roughly 31% as at March 2026, and APRA’s own analysis puts super funds’ total claim on the banks — once indirect holdings through investment funds are counted — closer to 40%. Super funds now own about two-fifths of Australia’s bank share pool. How and why did this happen?
Financial stocks make up roughly a third of the ASX 200’s market capitalisation, and the Big Four do most of the heavy lifting inside that weighting. A default balanced or growth super option that tracks or benchmarks against the index doesn’t get to decide whether CBA or any of the other Big Four looks expensive — it buys regardless. It’s got to place that 12% compulsory contribution across Australia’s nearly 9 million workers — each payday.
Here’s the important bit: passive super funds are buyers without a brake. They don’t have a price target to sell at, because they don’t apply a valuation process to begin with. Morgan Stanley makes the flows-versus-valuation disconnect explicit: bank price-to-earnings multiples re-rated by an average of roughly 5.4 percentage points between June 2023 and June 2026 — the same window in which institutional ownership rose by a similar magnitude.
This implies that at least some of the ‘re-rating’ in the Big Four’s share prices is due to who’s increasingly on the register — and not the traditional fundamental valuation metrics like earnings growth or a lift in return on equity.
There’s a second mechanical effect working in the same direction, and it’s one the register data doesn’t spell out. Assuming super funds aren’t forced to sell any time soon, every Big Four bank share they buy shrinks the pool available to trade. A fixed dollar of passive inflow chasing a shrinking float moves the price further today than it did three years ago. The buying pressure hasn’t just continued — its effect on price has been amplified.
How far can Big Four valuations stretch?
So, how far can the valuation elastic band actually stretch? The honest answer is further than many broking analysts and active fund managers expect. This is because the marginal buyer — ‘dumb’ money — isn’t buying based on valuation. It’s just meeting its obligation to funnel cash into the market as per mandate.
But ‘dumb’ money isn’t infinite, either. The superannuation guarantee rate is now fixed at 12%, with no further legislated increase — so the dollar flow from here grows only with wages and employment, not with further rate rises. That’s a genuine ceiling on how fast the passive bid can keep accelerating, even if the bid itself doesn’t disappear.
The real structural limit of the superannuation ledger sits with demographics. As Australia’s population ages, decumulation — retirees drawing down balanced and pension accounts — starts competing directly with accumulation, the wage-linked contributions that have been the buyer of last resort for bank shares. Given Australia’s ageing population and low birth rate, migration remains the key to pushing out this critical inflection point; otherwise, the ratio only moves in one direction from here.
Short of that shift, the things that could force passive money to become a net seller rather than just a shrinking buyer are the kind that don’t arrive on a predictable schedule: a credit event serious enough to trigger genuine multiple compression in the sector (i.e., negative smart money flows become so overwhelming that they swamp positive passive flows), an index rebalance that trims the banks’ weighting, or regulatory intervention from APRA limiting how much super funds can own. Until one of those shows up, the elastic band has room to keep stretching.
Today’s update from Westpac is a taste of what that deterioration can look like in real time — slowing mortgage volumes and margin pressure flagged to build into year-end. It’s exactly the kind of incremental bad news the passive bid is built to shrug off — but every one of these updates narrows the gap between what the fundamentals say and what the register is prepared to pay.
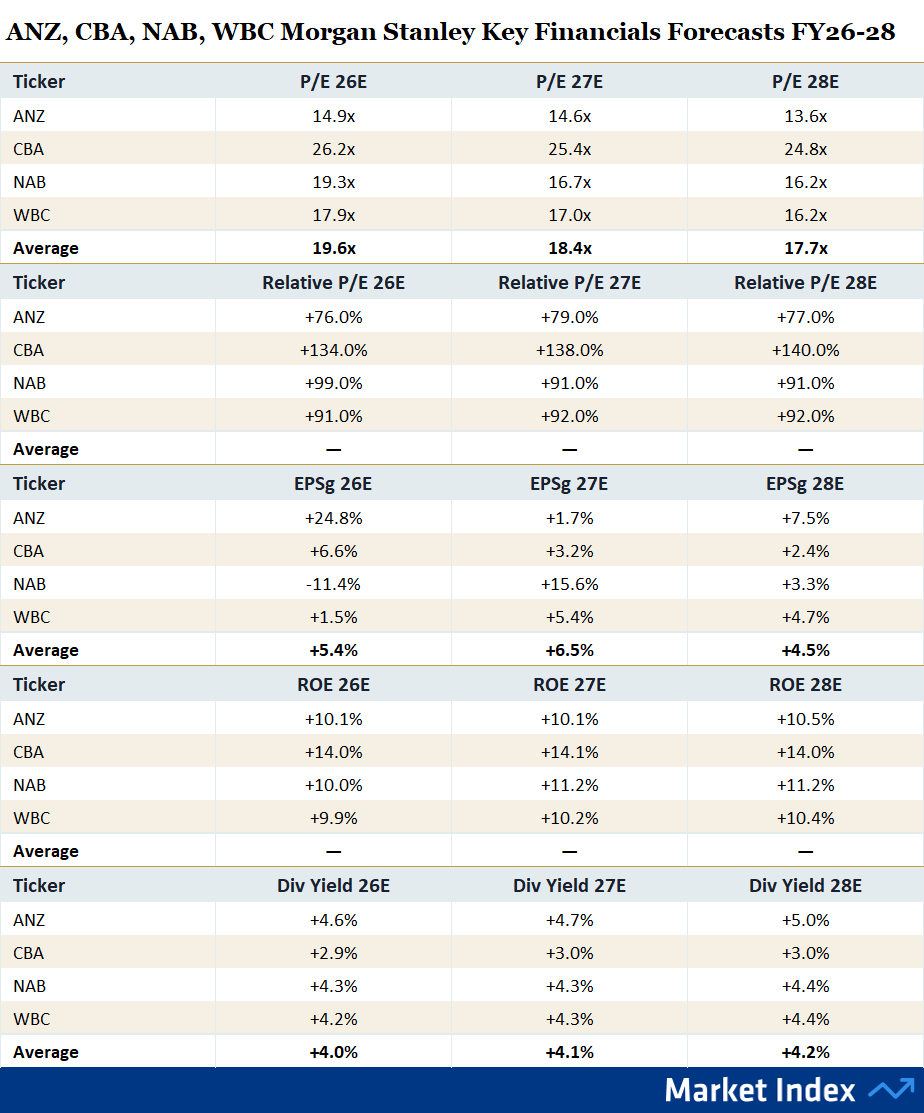
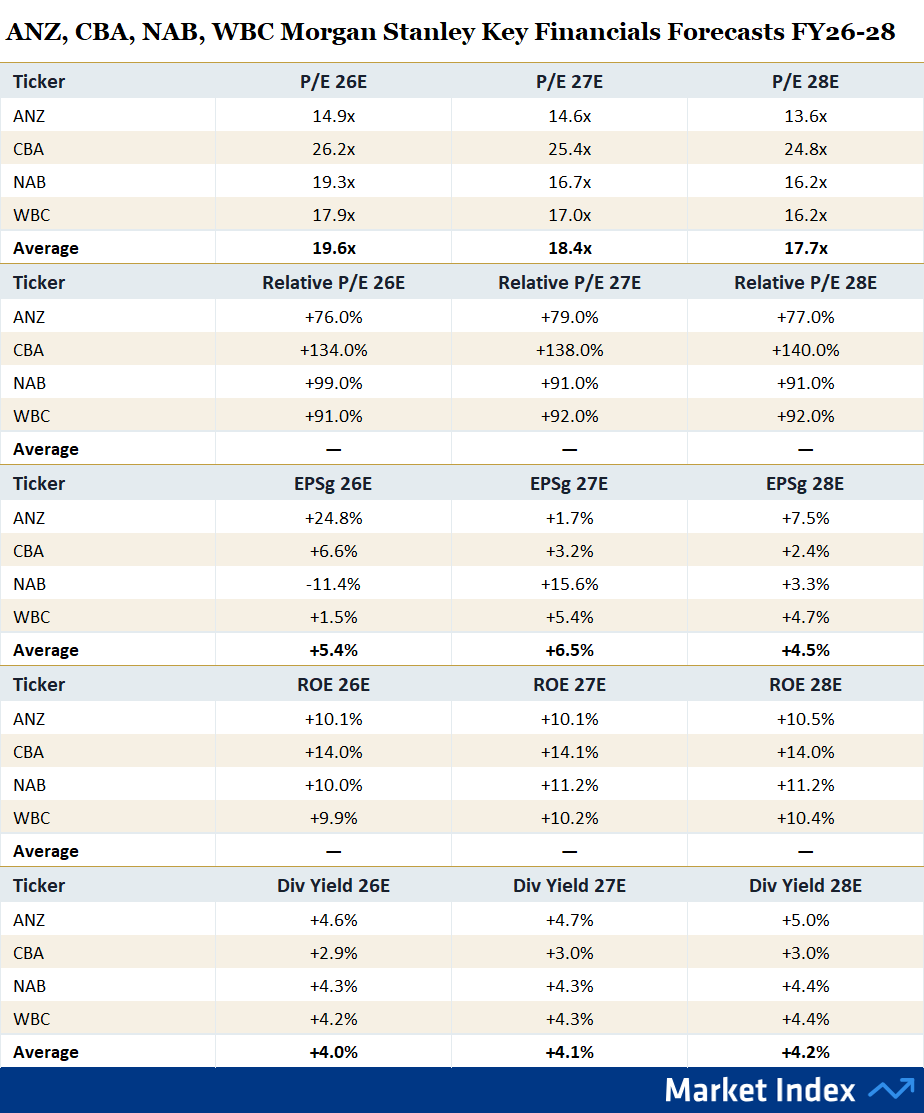
Big Four Valuation Metrics. Source: Morgan Stanley
What about valuations? Just how stretched are they? The table above has been constructed from Morgan Stanley bank sector data. Together, the P/E, earnings growth and dividend figures that it contains offer a cleaner read on value than the share price alone ever could.
On a growth-adjusted basis, arguably only ANZ genuinely qualifies as growth at a reasonable price — its 14.9x FY26E multiple against a forecast 24.8% earnings rebound (off a depressed FY25 base) stands apart from CBA, NAB and Westpac, each trading on double-digit multiples against modest-to-negative earnings growth. Westpac’s own third-quarter update, released today, adds weight to that gap: average mortgage application volumes have fallen around 20% since May’s federal budget changes — owner-occupier down 18%, investor down 26% — and management flagged margin compression as likely to become “more pronounced” at the full-year result.
What the whole group does offer is a solid, mostly fully franked dividend yield of around 4% — grossed up towards 5.7% with franking credits — which is exactly the kind of steady, tax-effective income that keeps mum-and-dad shareholders holding on regardless of what the brokers say.
Conclusion: follow the (dumb) money!
When it comes to what they’re prepared to buy, an active manager has a brake built in — a price target, a P/E ratio that screams expensive — a natural point where all their professional training says “sell.” A default super allocation, on the other hand, doesn’t have the same impediments. They’ll keep hoovering up shares in the Big Four until demographics eventually shift sufficiently to neutralise flows or reverse them. Probably, even after WBC’s wobble today.
The irony sitting underneath all of this: the mum-and-dad investors who think they’ve de-risked by selling their direct CBA or ANZ holdings over the last few years haven’t actually escaped the trade. Most remain invested in passive fund vehicles — either directly via ETFs or through superannuation.
If for some reason, valuations in the sector become so attractive to global short sellers that some real clout is put behind the ‘short arguably the world’s most expensive banks’ trade, prices among the four could correct quickly. For now, though, the demographic maths still favours accumulation over decumulation, and nothing in Morgan Stanley’s data points to that changing any time soon.
WBC kicks off the current round of earnings updates for the Big Four, with CBA (12 August), ANZ (13 August) and NAB (17 August) still to report. You can keep tabs on the reporting dates and key earnings numbers for over 250 ASX stocks in our Reporting Season Calendar.
References: This article draws on institutional research from Morgan Stanley (July 2026), ASIC short sale data (28 July 2026), Market Index Broker Consensus, superannuation ownership data from APRA’s System Risk Outlook (May 2026), and Westpac’s third-quarter FY26 trading update (10 August 2026). This article first appeared on Livewire on Monday 10 August.
