
ANZ, CBA, NAB, WBC: Where the big banks stand as Australia's property boom fades
Tax reform has triggered a “must-have” housing slowdown. Here's what it means for the Big 4 ASX banks and their fat fully franked dividends.


Source: Shutterstock and Market Index
Mentioned
KEY POINTS
- Australian banks have anchored investor portfolios for generations, riding a property market that only ever seemed to climb, paying out lucrative fully franked dividends along the way.
- New capital gains and negative gearing rules, layered on three RBA rate rises and a fresh cost-of-living shock from the Middle East conflict, have put the nation’s property engine into reverse.
- We weigh the bear case against the bull case for the Big 4 banks, canvass whether the experts are calling them a buy, hold, or sell, and ask whether these bank shares still deserve a place in your portfolio.
For most Australians, owning a bank stock is barely a decision at all. Many investors do so directly by holding shares in one of the Big 4: ANZ Group (ANZ), Commonwealth Bank of Australia (CBA), National Australia Bank (NAB), and Westpac Banking Corp (WBC), while many may not even realise they have an exposure baked into an industry super fund. The Big 4 have been the default building block of shareholder wealth for as long as most investors can remember.
What's sat behind the balance sheets for just as long is Australia's love affair with property. Rising house prices meant rising mortgage books, rising mortgage books meant rising bank profits, and rising bank profits funded some of the fattest, fully franked dividend cheques in the developed world. It’s been one of the safest bets on the ASX.
It may not work quite the same way from here, though. Even before the Federal Government's May Budget rewrote the tax treatment of investment property and capital gains, the housing market was already losing momentum, with three RBA rate rises this year and Middle East-driven inflation eroding buyer urgency. The tax changes added a second, more structural headwind – one aimed squarely at the investor demand that has underpinned roughly a third of the Big 4's residential mortgage book.
Value-focused fund managers have been warning for some time that Australia's banks are among the most expensive in the world, kept aloft less by fundamentals than by passive index buying and mum-and-dad investors' attachment to a reliable, tax-effective income.
So, are the tax changes the final straw that forces a major re-rating of the Big 4’s share prices – or are loyal shareholders once again right to hold on? To find out, I've collated the latest institutional research to weigh the bear case against the bull case – and ask whether bank shares still deserve a place in your portfolio.
The bear case: what the tax changes mean for bank earnings
Let's start with the bad news.
Cotality's national Home Value Index fell 0.4% in June – its largest monthly drop since December 2022 – with capital city values down 1.3% over the quarter, led by Sydney (-3.2%) and Melbourne (-2.6%). Auction clearance rates, the market's real-time pulse, held well below 50% in May and June, while capital city home sales in the June quarter were down 16.2% compared to a year earlier.
Cotality research director Tim Lawless puts the cause down to a genuine collapse in demand rather than a supply glut: "higher listings aren't due to a pick-up in the flow of new listings – it's a symptom of less demand in the market."
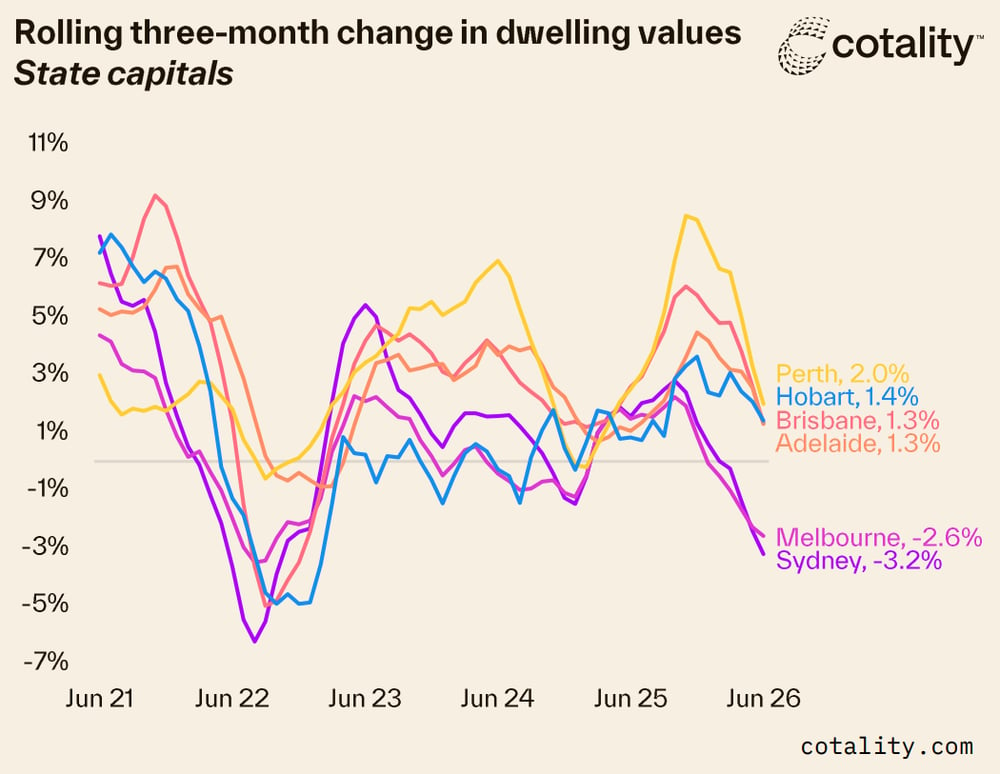
Rolling three - month change in dwelling values AU State Capitals, Source: Cotality. Available from: cotality.com
That demand vacuum is now flowing directly into the banks' lending books. In a recent research note, Macquarie estimated that new lending flows are already tracking down 20–30% year-on-year, with owner-occupier flows off by 10–20% and new investor lending down by as much as 50%. Westpac has separately flagged a fall of around 20% in mortgage application volumes and NAB a roughly 15% quarter-on-quarter drop in application values.
Macquarie expects overall housing credit growth – currently around 7–8% annualised – to slow to about 3.5% over 2027 and has cut FY27 earnings-per-share forecasts across the Big 4 by 1–2%, with FY28 cuts of 2–4%. CBA and WBC were singled out for the biggest downgrades given their heavier mortgage-book weighting.
Morgan Stanley frames the shift in even starker terms, describing the changes as a potential end to Australia's 30-year housing super-cycle. It notes that investors currently account for roughly a third of the $2.6 trillion residential mortgage market – and system mortgage growth could slow to around 3% in FY27. The investment bank believes this shift could ultimately have "a more significant impact on the economy than the RBA's rate hikes."
Beyond the property tax overhaul, several other pressures are stacking up for Aussie banks:
Margins and competition: CBA and NAB have already cut mortgage rates by 0.10–0.15 percentage points to win new customers, and Morgan Stanley expects banks to offer even bigger discounts to new borrowers in the months ahead to maintain market share.
Credit quality: Loss rates are still low, but Morgan Stanley expects them to rise by year-end, and Judo Bank's (JDO) flagging of new problem loans to small-to-medium businesses rattled sentiment sector-wide – even though JDO itself doesn't see it as systemic. UBS notes ANZ's provisioning buffer is the thinnest of the majors under a severe-downside scenario, a roughly $5 billion gap.
Macro backdrop: Unemployment rose to 4.5% in April, its highest since 2021, and further Federal Government cuts to NDIS spending are a live risk to the labour market.
Valuation: Morgan Stanley notes the average major bank price to earnings ratio (P/E) sits at roughly 18.5 times, well above the 12.6 times pre-Covid five-year average, even as consensus estimates (i.e., average analyst forecasts) have yet to catch up with the deteriorating outlook.
💡Key takeaway: Taken together, the risks facing the big banks are substantial and real. A three-decade tailwind from property is fading just as margins, credit quality, and valuation are all moving the wrong way at once.
The bull case: why the slowdown might not be as bad as feared
Now for the good news.
Auctions are stabilising: Cotality's latest combined capital city clearance rate (week to 12 July) bounced to 54.8% – a seven-week high. It could be an early sign the market may be finding a floor rather than capitulating.
Existing borrowers have a buffer: roughly 80% of borrowers kept repayments steady through 2025's rate cuts, building a repayment cushion against recent rate rises and rising fuel price impacts.
Grandfathering softens the blow: Existing negatively geared investors keep their benefits – but these only apply while a property runs at a loss, a gap that would normally close as rents rise and loans are paid down. Macquarie expects many investors to resist that decay by switching to interest-only loans, projecting the interest-only share of investor lending to climb. The practical impact: there won’t be a sudden rush of supply from existing investors. A genuinely disorderly outcome would still require a separate shock, like a spike in unemployment, to force distressed sales.
Business credit is holding up: Less rate-sensitive than housing, business credit growth is expected to ease only gradually, from around 10% now to about 6% by 2027.
Credit quality hasn't cracked yet: Feedback from the majors is that underlying trends haven't really changed so far, and UBS notes banks enter this slowdown with stronger starting provisions than in prior cycles, raising the prospect that provision releases support earnings.
Investor demand hasn't switched off yet: APRA data to May still show investor mortgage growth (9.0% year-on-year) outpacing owner-occupier growth (6.0% year-on-year). (Though these numbers may look a touch optimistic once June's data lands at the end of this month.)
The Big 4 aren't just sitting on their hands: NAB is out-growing peers on deposits and lending (~9% annualised), ANZ's productivity agenda has clawed mortgage growth back to system levels, ANZ and Westpac both beat cost forecasts last reporting season, and CBA still managed to grow its investor mortgage market share over the past year. Well-run, profit-motivated operators tend to manage a downturn, not just absorb it.
💡Key takeaway: Taken together, the risks facing the big banks are substantial and real. A three-decade tailwind from property is fading just as margins, credit quality, and valuation are all moving the wrong way at once.
What the experts are saying – and what they're actually doing
If the data leaves room for debate, the tone from institutional analysts does not. Macquarie holds an Underweight rating on the banking sector, with ANZ as its only Neutral-rated preference among the majors. Morgan Stanley carries a “Cautious” industry view, ranking ANZ as its sole Overweight, with CBA, NAB and WBC all Underweight.
With limited RBA flexibility, Australia is entering a must-have slowdown with housing and consumer activity facing rising pressure. We add to our Banks UNDERWEIGHT.
– Morgan Stanley, 8 July 2026
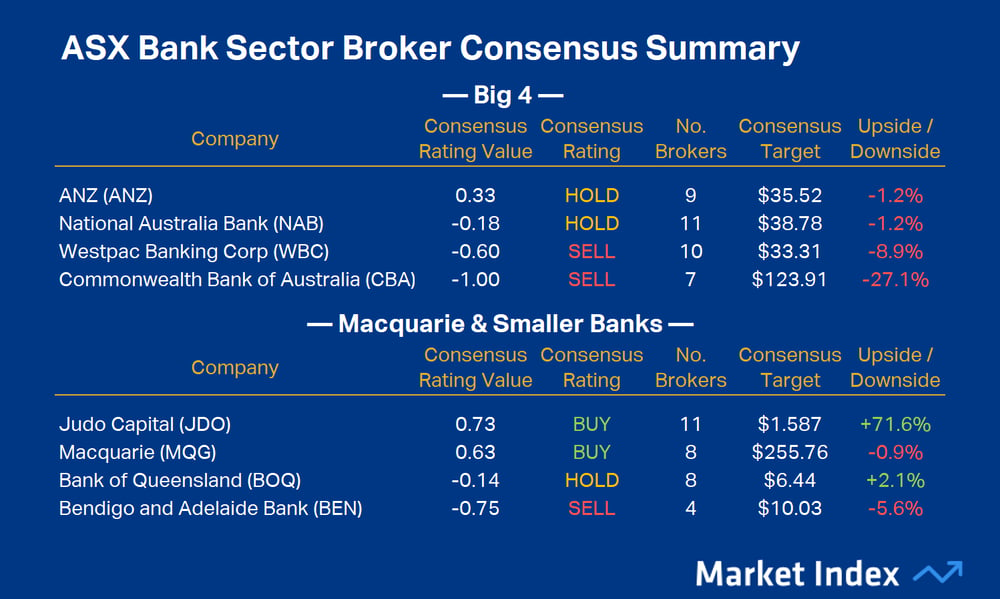
ASX Bank Sector Broker Consensus Summary 15 July 2026. Source: Market Index Broker Consensus. To obtain a stock’s Broker Consensus Rating, we assign a value of +1 to any rating better than HOLD/NEUTRAL/MARKETWEIGHT, a value of 0 for any rating equivalent to HOLD/NEUTRAL/MARKETWEIGHT, and a value of -1 to any rating worse than HOLD/NEUTRAL/MARKETWEIGHT. We then take the average of all assigned rating values and assign a Broker Consensus Rating of BUY to values greater than +0.5, a rating of HOLD for values between -0.5 and +0.5, and a rating of SELL for values less than -0.5. The Broker Consensus Target is simply the average of the target prices we have on file for each broker. Typically, brokers define their target prices as a 12-month forecast. Each target price is based on fundamental valuation assumptions. Upside/Downside data based on closing prices 15 July 2026.
That view is already showing up in how money is positioned. Morgan Stanley's proprietary tracking of roughly 60 domestic active fund managers shows the ASX Financials sector is carrying the single largest sector underweight in the market – an average active weight of -8.0 percentage points, with 87% of funds underweight the sector. CBA alone accounts for an underweight four times larger than the next-biggest position, while ANZ is the only major bank most funds are actually overweight.
How do the big fund managers ‘underweight’ a stock? Fund managers’ performance is generally weighed against the benchmark S&P/ASX 200 (XJO) index. The Big 4 banks account for around one-quarter of the XJO, and because it is a market capitalisation-based index, therefore also one-quarter of its performance. So, underweight could mean anything from not owning one of the Big 4 banks to simply not owning them in line with their XJO weightings.
Some fund managers have chosen to take their underweight positions in the Big 4 to the next level by short selling. ASIC short-position data show short interest in the ANZ, CBA, NAB, and WBC is at 5.5% of combined outstanding shares, down from a record 6.5% in May – the highest figure recorded against the sector since ASIC began publishing this data in 2010 – but still roughly double the level of a year ago. CBA and WBC are the most heavily shorted, with 1.92% and 1.68% of their float sold short respectively.
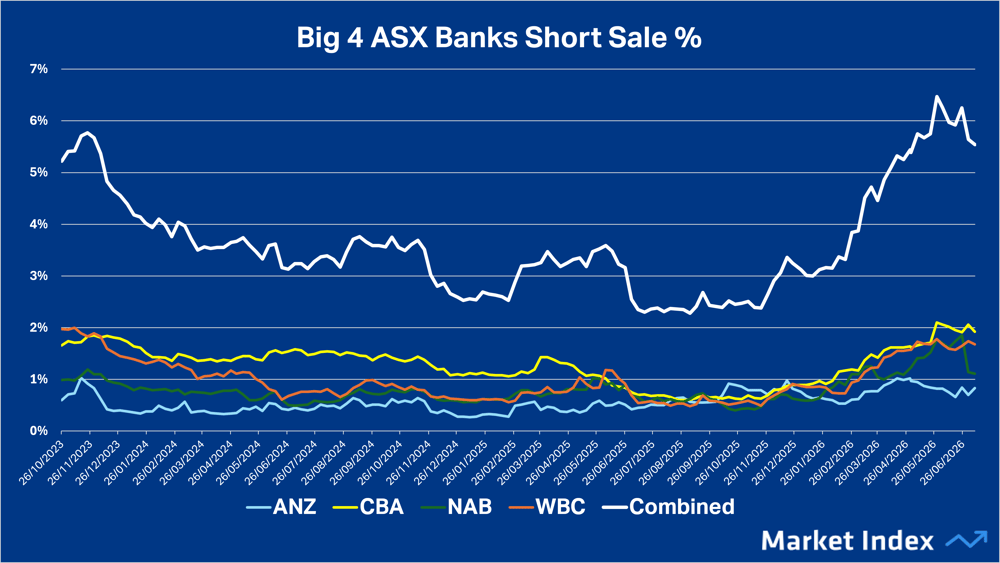
ANZ, CBA, NAB, WBC short sale percentages. Source: Market Index using ASIC data
Yet none of this bearishness has translated into a rout in bank share prices – which raises the question: who's still buying? Two forces look to be doing the work. Under the Your Future, Your Super performance-test regime, super funds have grown reluctant to stray far from the index. Because most Australians sit in default, passively managed super options, every dollar of new compulsory contributions is largely allocated in line with ASX 200 weightings – resulting in a meaningful slice of the multi-billion super pie funnelling into the banks.
There's also a possible read-through from offshore. US, European, and several Asian bank shares have had a strong run since the start of 2024, and some of that global re-rating may be lifting sentiment locally even as the fundamentals for Australian banks soften. But this powerful move in global banking stocks might be having an even more direct influence on the Big 4, again via passive flows.
Globally, ETF assets hit a record US$23.1 trillion in June, with 2026 net inflows already topping US$1 trillion – the fastest start to a year on record. Locally, Betashares has the Australian ETF industry closing in on the $400 billion mark. In the US – still the world's largest ETF market – research by Li and Winn of the SEC's Division of Economic and Risk Analysis found over 90% of ETF assets sit in funds with a passive mandate.
The Big 4 are large enough to earn automatic inclusion in ETFs tracking global financial stocks. The iShares Global Financials ETF (NYSE: IXG), arguably the benchmark fund in its category, is a useful illustration. It tracks a global financials sector index, giving investors diversified exposure to banks, insurers and asset managers worldwide.
%20vs%20ASX%20Big%204%20Banks%20Performance.%20Source%20TradingView.png)
iShares Global Financial ETF (NYSE IXG) vs ASX Big 4 Banks Performance. Source: TradingView
IXG's largest holding is JPMorgan (5.88% of the fund as at 14 July), but it also has substantial exposure to the Big 4 Australian banks. Indeed, at 1.27%, CBA is the 15th largest holding of the fund. WBC (0.56%), NAB (0.54%), and ANZ (0.49%) also carry modest fund weights. This means for every dollar that flows into IXG, roughly 1.3 cents is mechanically directed into CBA. Extend that to all four majors, and it's about 2.3 cents in every IXG dollar.
IXG is just one fund in a fast-growing universe of thematic and sector ETFs. The mechanism is entirely automatic – buy global banks, and you buy our Big 4 by default – and multiplied across dozens of similar products, it adds up to billions of dollars in flows each year, with no reference to whether Australian banks are cheap, expensive, or anywhere in between.
Arguably, that fact makes passive money 'dumb money' by design – it doesn't ask whether the price is right. If a dollar comes in, it must be invested as per the fund's passive mandate. So while the active (smart?) money is either substantially underweight or shorting the Big 4, there's evidently a passive index fund willing to buy from them on autopilot.
💡Key Takeaway: Ultimately, the IXG chart could be the critical indicator of the sustainability of the Big 4's advance. Investors may want to stay wary of any trend change in this chart.
Conclusion: Who's correct?
Active fund managers are running one of their largest sector underweights in years against Australian banks – and yet the money keeps flowing in regardless, via super funds, passive index funds and mum and dad dividend investors who have never sold a single bank share in their lives. Who’s right? Only time – and share prices – will tell.
One thing is for sure: the tax changes are real, the earnings downgrades from analysts are already landing, and the housing super-cycle that built the banks' balance sheets over three decades genuinely does appear to be cooling.
Set against that, none of the Big 4 have yet flagged any loss of profitability that’s likely to result from the events of the last few months. Possibly because provisioning buffers are healthier than in past cycles, business lending is proving a useful offset, and for the reasons discussed here, the transition looks more gradual than sudden.
If the analysts at the investment banks surveyed here are right, owning ASX bank shares may prove a difficult trade over the 12 months. No doubt, plenty of long-term holders will keep collecting their dividends regardless of what the experts say.
This article draws on institutional research from Macquarie, Morgan Stanley and UBS (May–July 2026), housing market data from Cotality (July 2026), short-position data from ASIC (July 2026), and research from Li, R. and Winn, N., "The Fast-Growing Market of Active ETFs," US Securities and Exchange Commission, Division of Economic and Risk Analysis (February 2026).
