
ChartWatch Markets: Can the bull market in stocks last? Plus copper sets record high as funds flood into base metals
Technical analysis of the most important global stock indices, commodities, bonds, FX, and crypto impacting your ASX portfolio each day.

Source: Shutterstock
Mentioned
KEY POINTS
- Despite every other article you read telling you how expensive stocks are… they seem to keep going up! Well, perhaps you’re not reading the right articles… because this one has been calling stocks up for a long time!
- The US stock market is leading the way, and leading the US stock market is the technology-laden Nasdaq Composite – the coalface of high growth stocks. Can the Nasdaq bull market last, we investigate!
- Base metals are also on the rise, generally, because while the copper price has made a new all-time high, and aluminium, tin and zinc are probing 3-year highs, nickel and lead remain in the doldrums.
- We bring you the best charts and technical analysis from the world’s major stock and commodity markets – but even better – you’ll learn how to read the charts yourself!
In today's edition of ChartWatch Markets, we'll be covering the technicals for:
Nasdaq Composite
Copper - LME Official Cash
Aluminium - LME Official Cash
Lead - LME Official Cash
Nickel - LME Official Cash
Tin - LME Official Cash
Zinc - LME Official Cash
Nasdaq Composite Index

Nasdaq Composite Long Term (30-years) Chart – "I'm not a buyer at these levels because..." (click here for full size image)
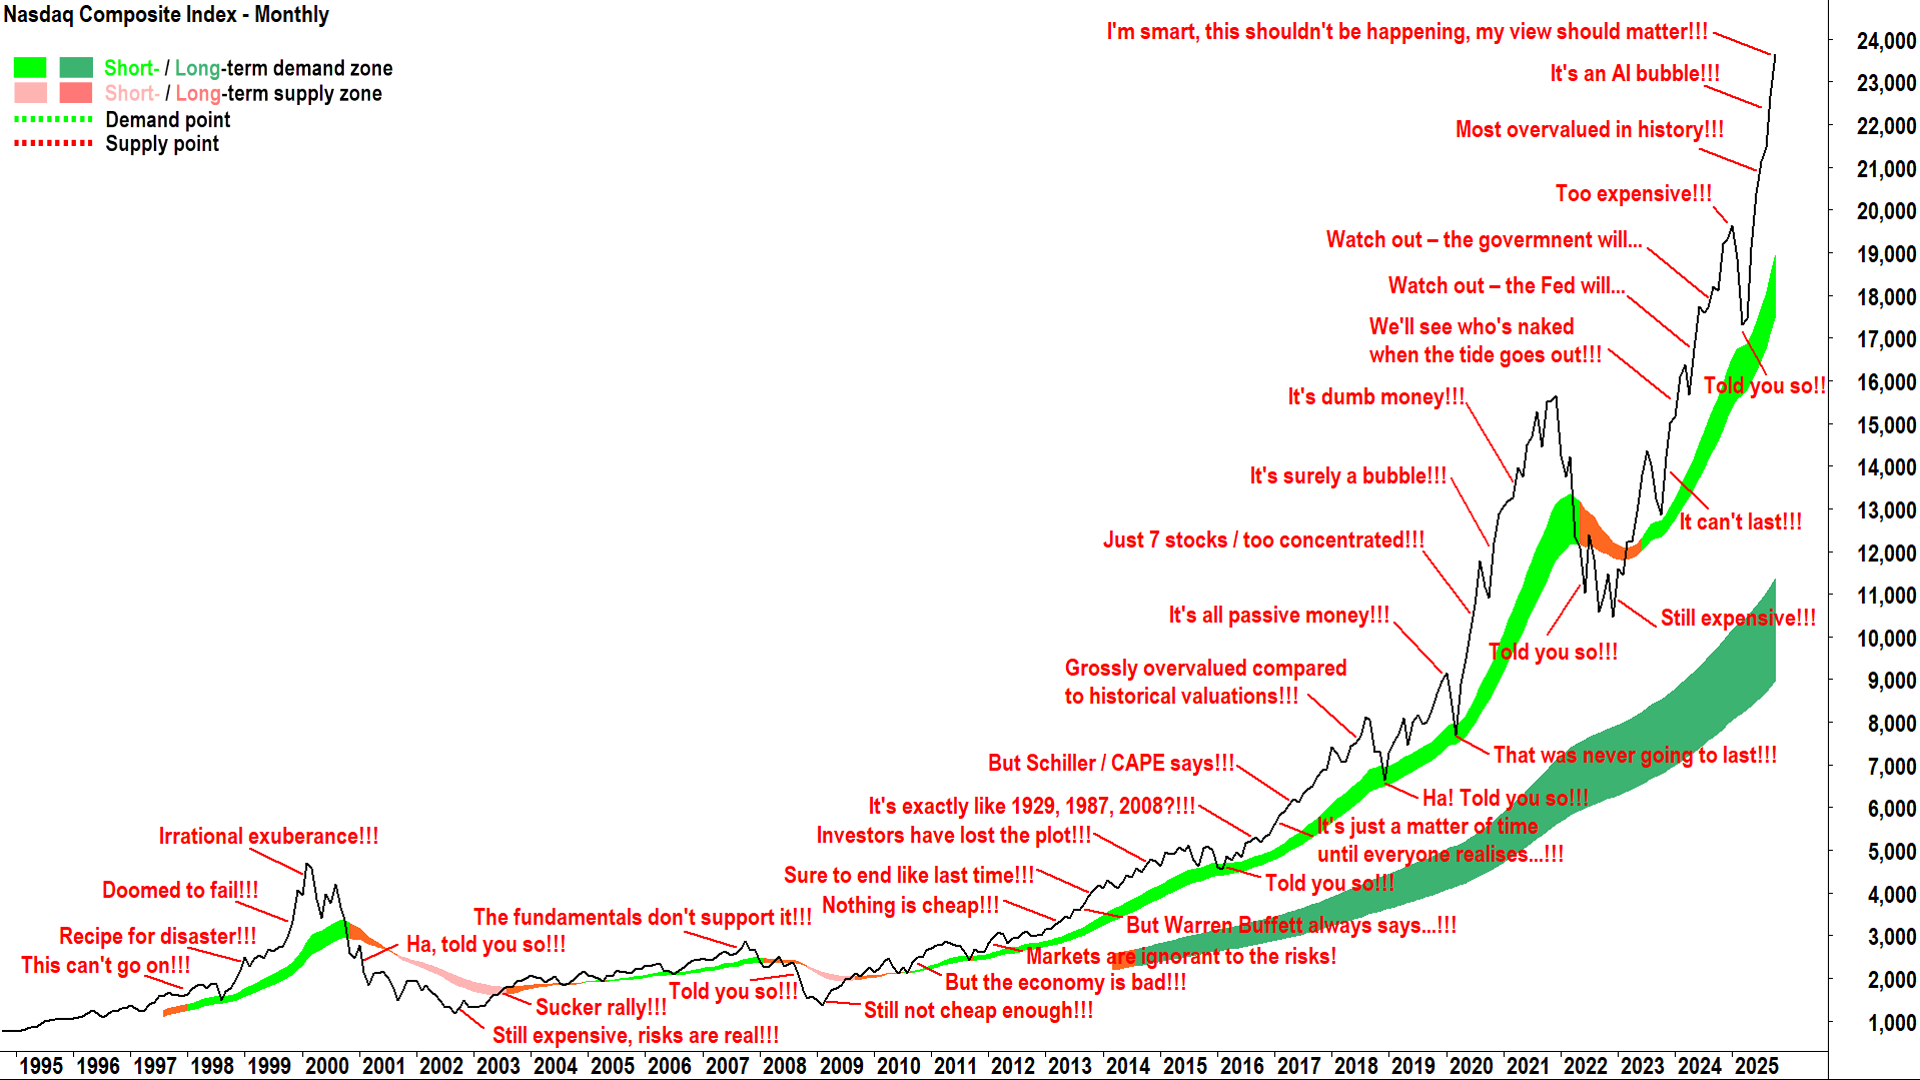
In honour of yet another stampeding record high on Wall St on Monday, I give to you what I call the "I'm not a buyer at these levels because..." chart! 🐂
It demonstrates the power of MOTN (More Often Than Not). MOTN stocks go up: That's a fact that even the most ardent, died in the wool value investor cannot deny!
Maybe their favourite stocks don't always go up (value is always in the eye of the beholder... but often not in the eye of the value investor!). But plenty do – particularly in a bull market when D > S = P ⬆️.
You can either fight it by sitting it out stubbornly, complaining all the while that you're a smart person, these things are blatantly clear to you – so why can't everyone else see why you're right??? 🤯
Or, you can just knuckle down, make hey while the sun is shining without a care for why it's shining... and just follow ... the... bloody... trend. 🌞
It's your choice. It's always your choice – that's what's so great about the market (because quite often in life we either don't have a choice, or just the illusion of it!).
Nope, here you only answer to yourself! Hey, you need a license to drive a car, but not your portfolio. There are no rules... It's your money, go knock yourself out!
But, with choice, comes great responsibility: The responsibility to make that cash grow to meet your goals, whatever they may be. Embrace that responsibility – and make good decisions about your investing!

Nasdaq Composite Index chart (click here for full size image)
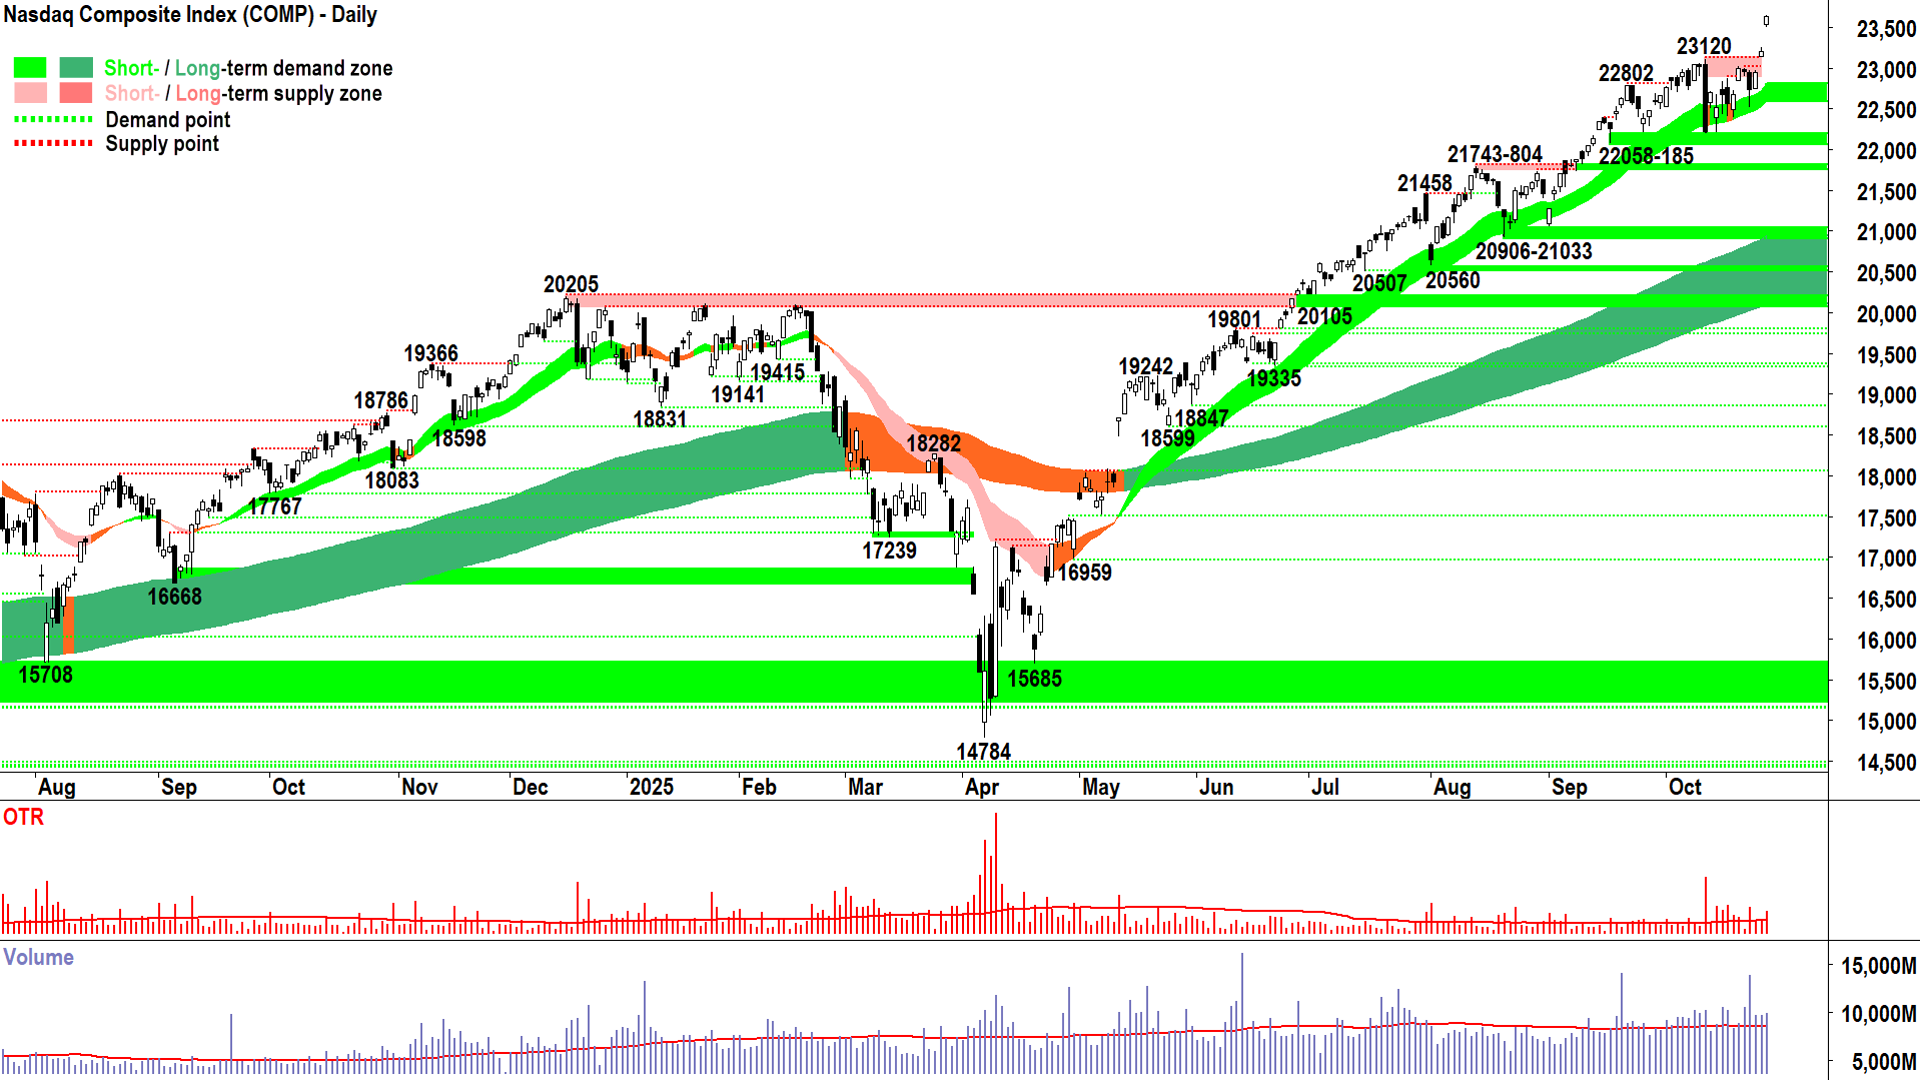
I trust you'll agree that my view here has been unwaveringly FRP since May – but please don't confuse my unerring accuracy with respect to US stocks with intelligence, or the even less useful concept of "being right".
I simply tuned out everything else and followed those lines and squiggles on the chart above. I'm not smarter than the next person for simply following the trend – after all – it's s bull market... I was going to be right MOTN remember!? 😉
Back to the the usual technical analysis, and there's nothing in the above chart that's inconsistent with D > S = P ⬆️. By this, I mean that as far as the 3 tent pegs of my technical model go, i.e., trends, price action and candles:
Consistent with demand-side control = ✅
Consistent with supply-side control = ⚠️
Short and long term trend ribbons: ⬆️ / ⬆️, widening (getting stronger), acting as a zone of dynamic excess demand = ✅
Price action: Rising peaks and rising troughs (i.e., supply removal and demand reinforcement) = ✅
Candles: Demand-side candles (i.e., white-bodied candles and or downward pointing shadows) = ✅
View: ✅✅✅ = I prefer to stay the course here at FRP (Full Risk Position corresponds to a 100% allowable capital allocation limit for US stocks based on my personal risk management model).
Apologies if my analysis is mundane and monotonous! There are far more exciting modes of analysis out there... just check on TikTok and YouTube and you'll find heaps of incredible insights. All I have for you is trends, price action, and candles... i.e., D + S = P.
Key levels: 22058 is the closest point of demand, the price should not close below here if the demand-side is in control of the Comp's price; a close below the short term uptrend ribbon (presently 22590-22805) will nullify the short term uptrend = ⚠️
Copper - London Metals Exchange (LME) Official Cash

Copper - London Metals Exchange (LME) daily chart (click here for full size image)
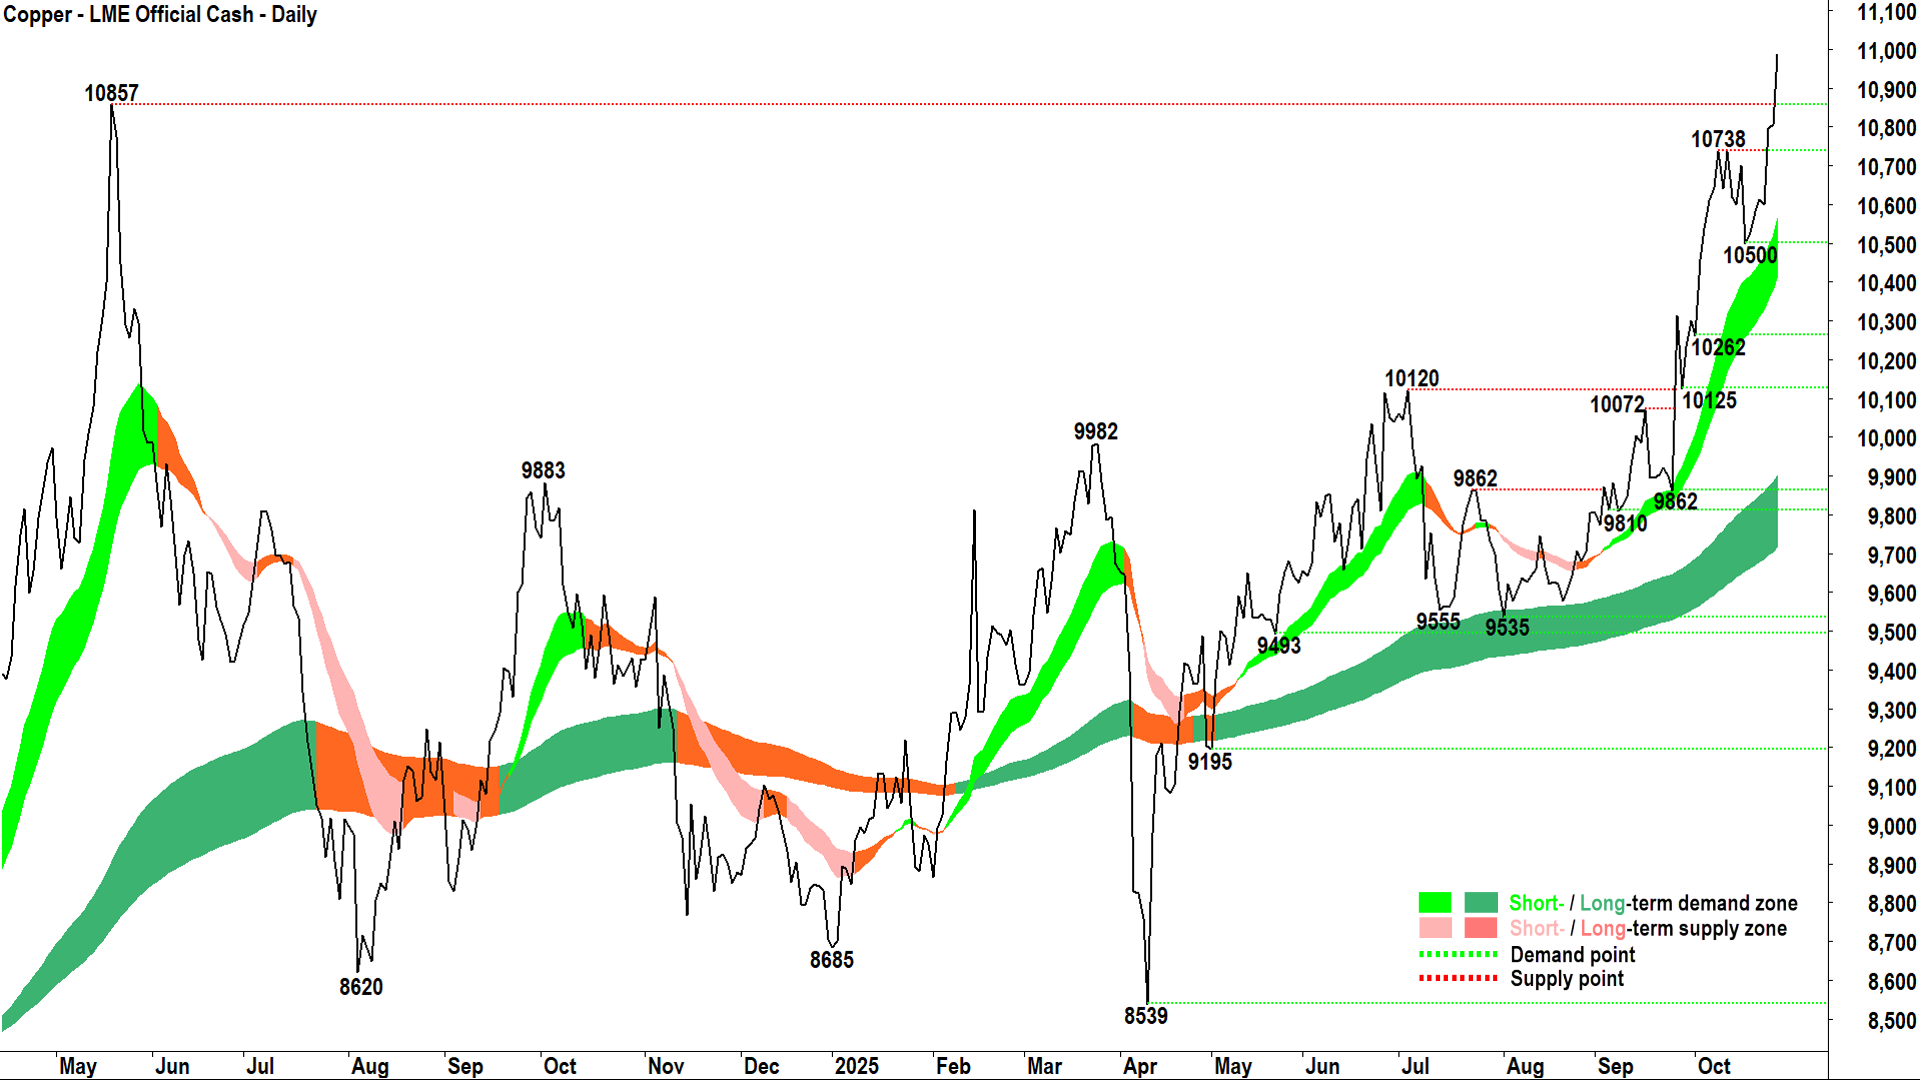
A new all time high for copper on the LME. The red metal has never been more valuable.
Is it because of the energy transition? Supply constraints? US trade policy?
No idea. I don't really care either. 🤷
Can I offer, it's because: D > S = P ⬆️

Copper - London Metals Exchange (LME) weekly chart (click here for full size image)
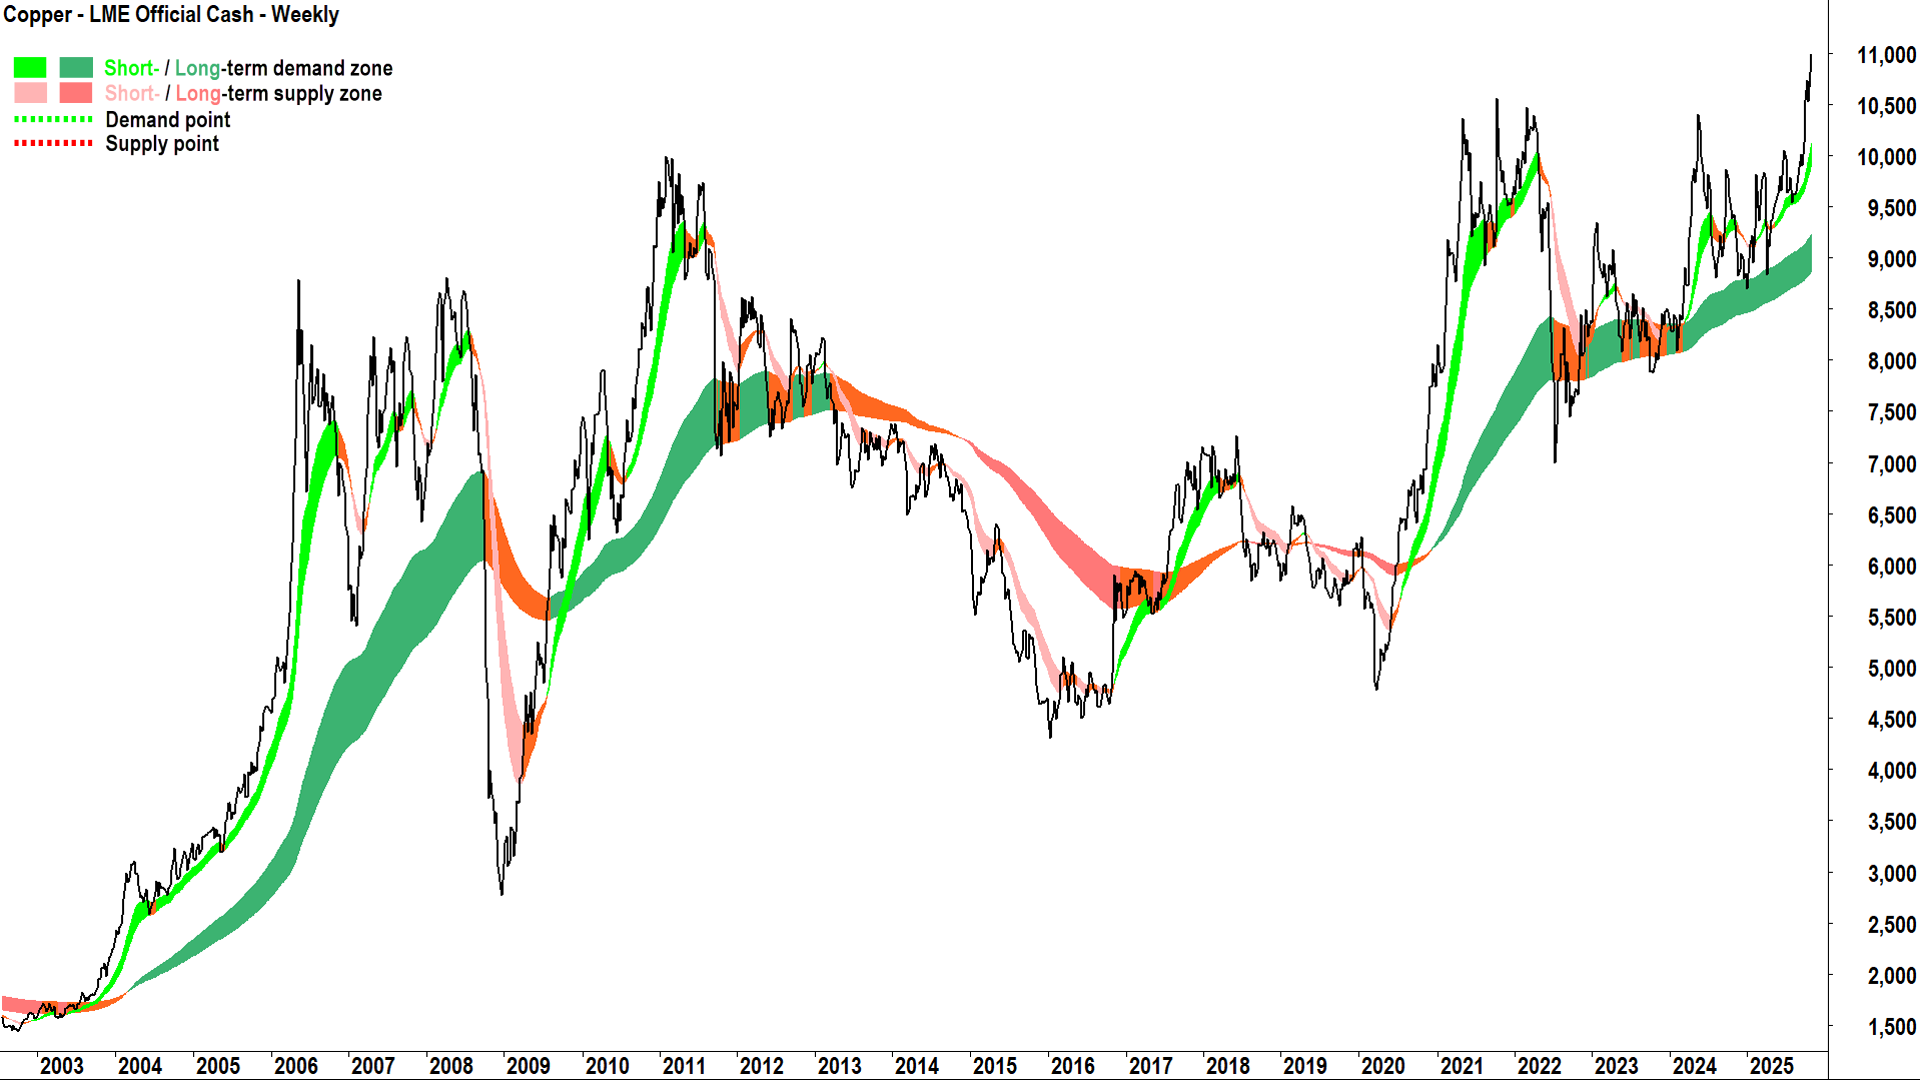
The weekly chart provides even more context to this move. A clean break from a multi-year base pattern with strong short and long term uptrends and price action. (Note: "short" and "long" with respect to a weekly chart... so naturally, this is 5 times longer term than shown on a daily chart!).
Regardless of periodicity, it is clear that the demand-side is gripped by FOMO and the supply side is holding on for more...
Here's the important bit about new all time highs: Without the constraints of a historical price anchor in their minds... market participants now consider that any price is possible... it's all blue sky from here!
View: Happy to stay the course on LME copper. My technical model allows me to either add or maintain risk here (i.e., +R / =R).
Key levels: 10738 is the closest point of demand, ideally, the price should not close below here if the demand-side is in control of the Comp's price – but I expect 10500 will be a more critical balance point between demand-and-supply-side control; alternatively, a close below the short term uptrend ribbon (presently 10450-10770) will nullify the short term uptrend = ⚠️
Other LME Base Metals
Aluminium - LME Official Cash

Aluminium - LME chart (click here for full size image)
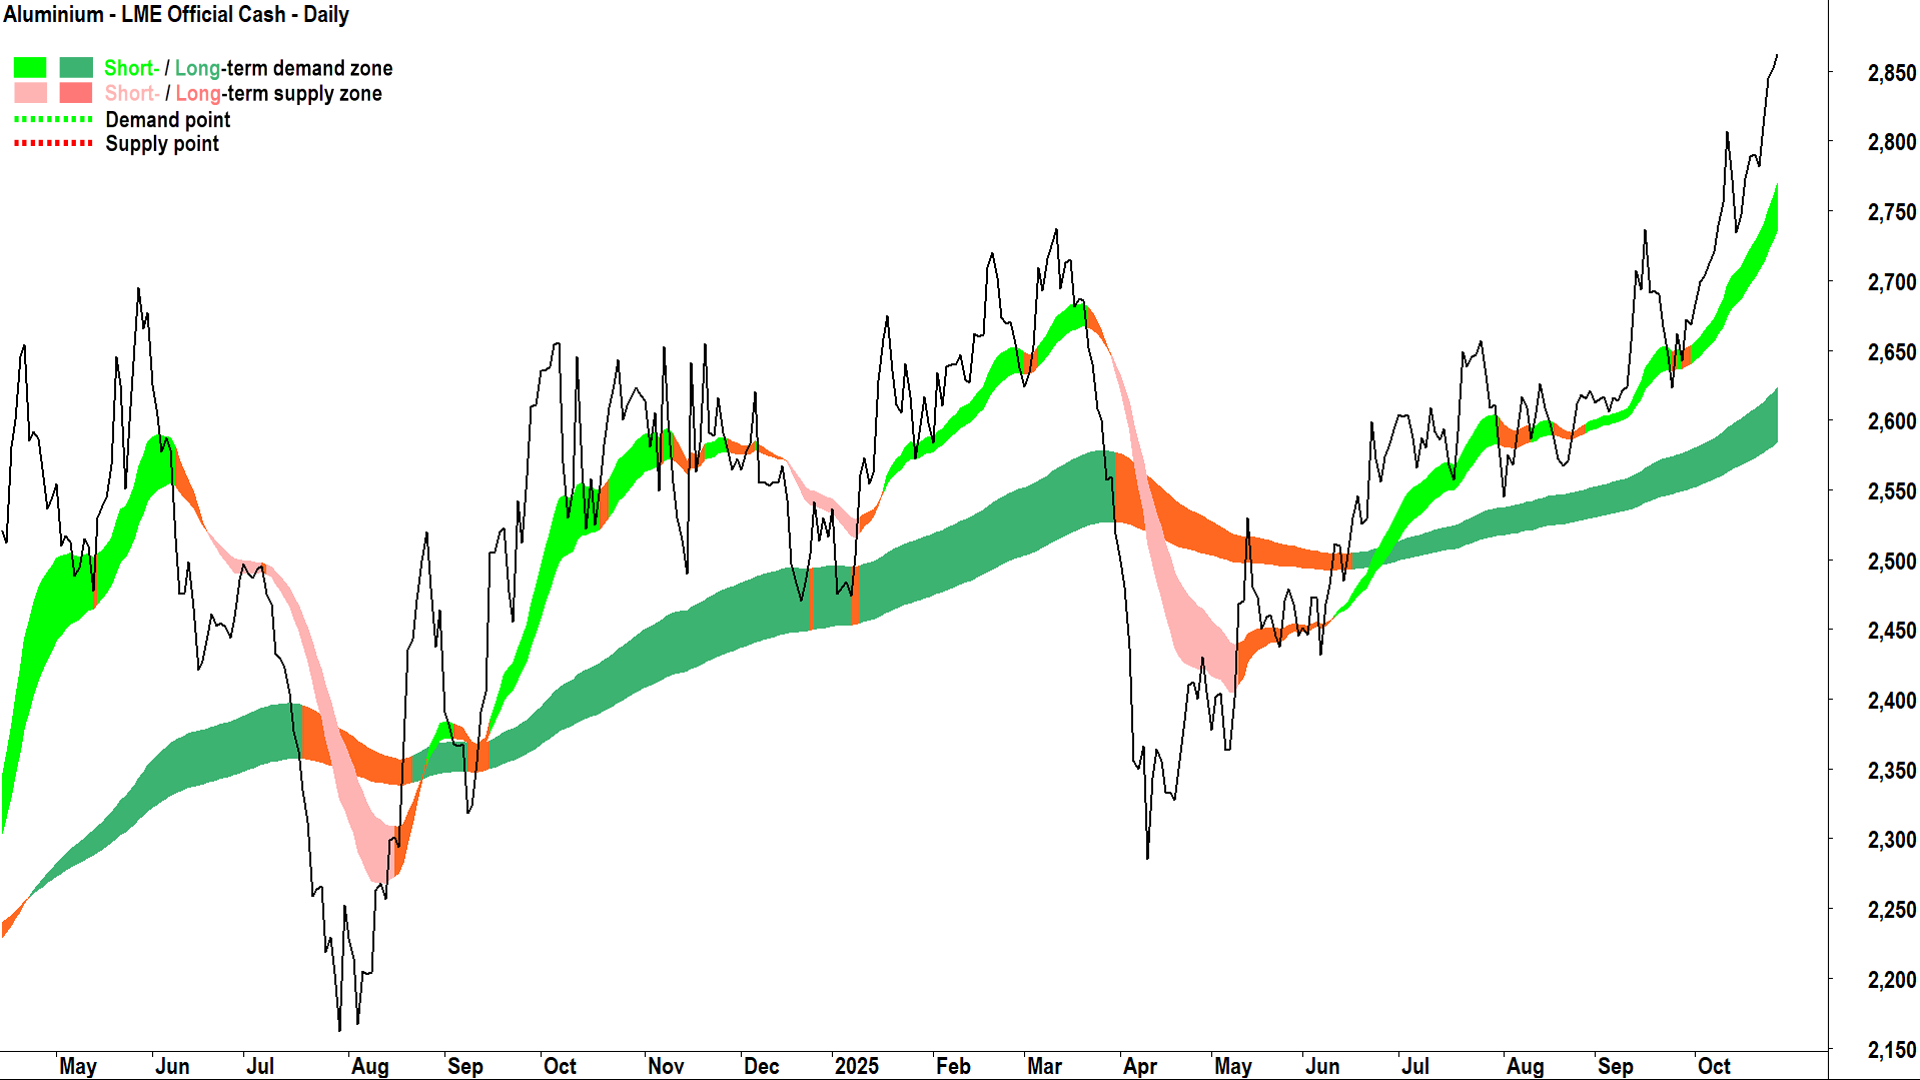
Let's take a quick tour through the rest of the major LME base metals charts. In Thursday's ChartWatch Markets, I'll review the charts of the major ASX base metals stocks including BHP, RIO, S32, AAI, SFR, NIC, and a few others – so stay tuned!
Aluminium's chart is a picture of demand-side control:
Short and long term trend ribbons: ⬆️ / ⬆️, widening (getting stronger), acting as a zone of dynamic excess demand = ✅
Price action: Rising peaks and rising troughs (i.e., supply removal and demand reinforcement) = ✅
Unlike copper, though, there's no new all time high here – it's well back off the left of the chart above, at 3975 set on 31-Mar 2022 in the wake of Russia's invasion of Ukraine.
The good news is that there are absolutely no major points of supply between here and that price.
View: Happy to stay the course on LME aluminium. My technical model allows me to either add or maintain risk here (i.e., +R / =R).
Key levels: 2807 is the closest point of demand, ideally, the price should not close below here if the demand-side is in control of the Comp's price – but I expect 2734 will be a more critical balance point between demand-and-supply-side control; alternatively, a close below the short term uptrend ribbon (presently 2740-2770) will nullify the short term uptrend = ⚠️
Lead - LME Official Cash

Lead - LME chart (click here for full size image)
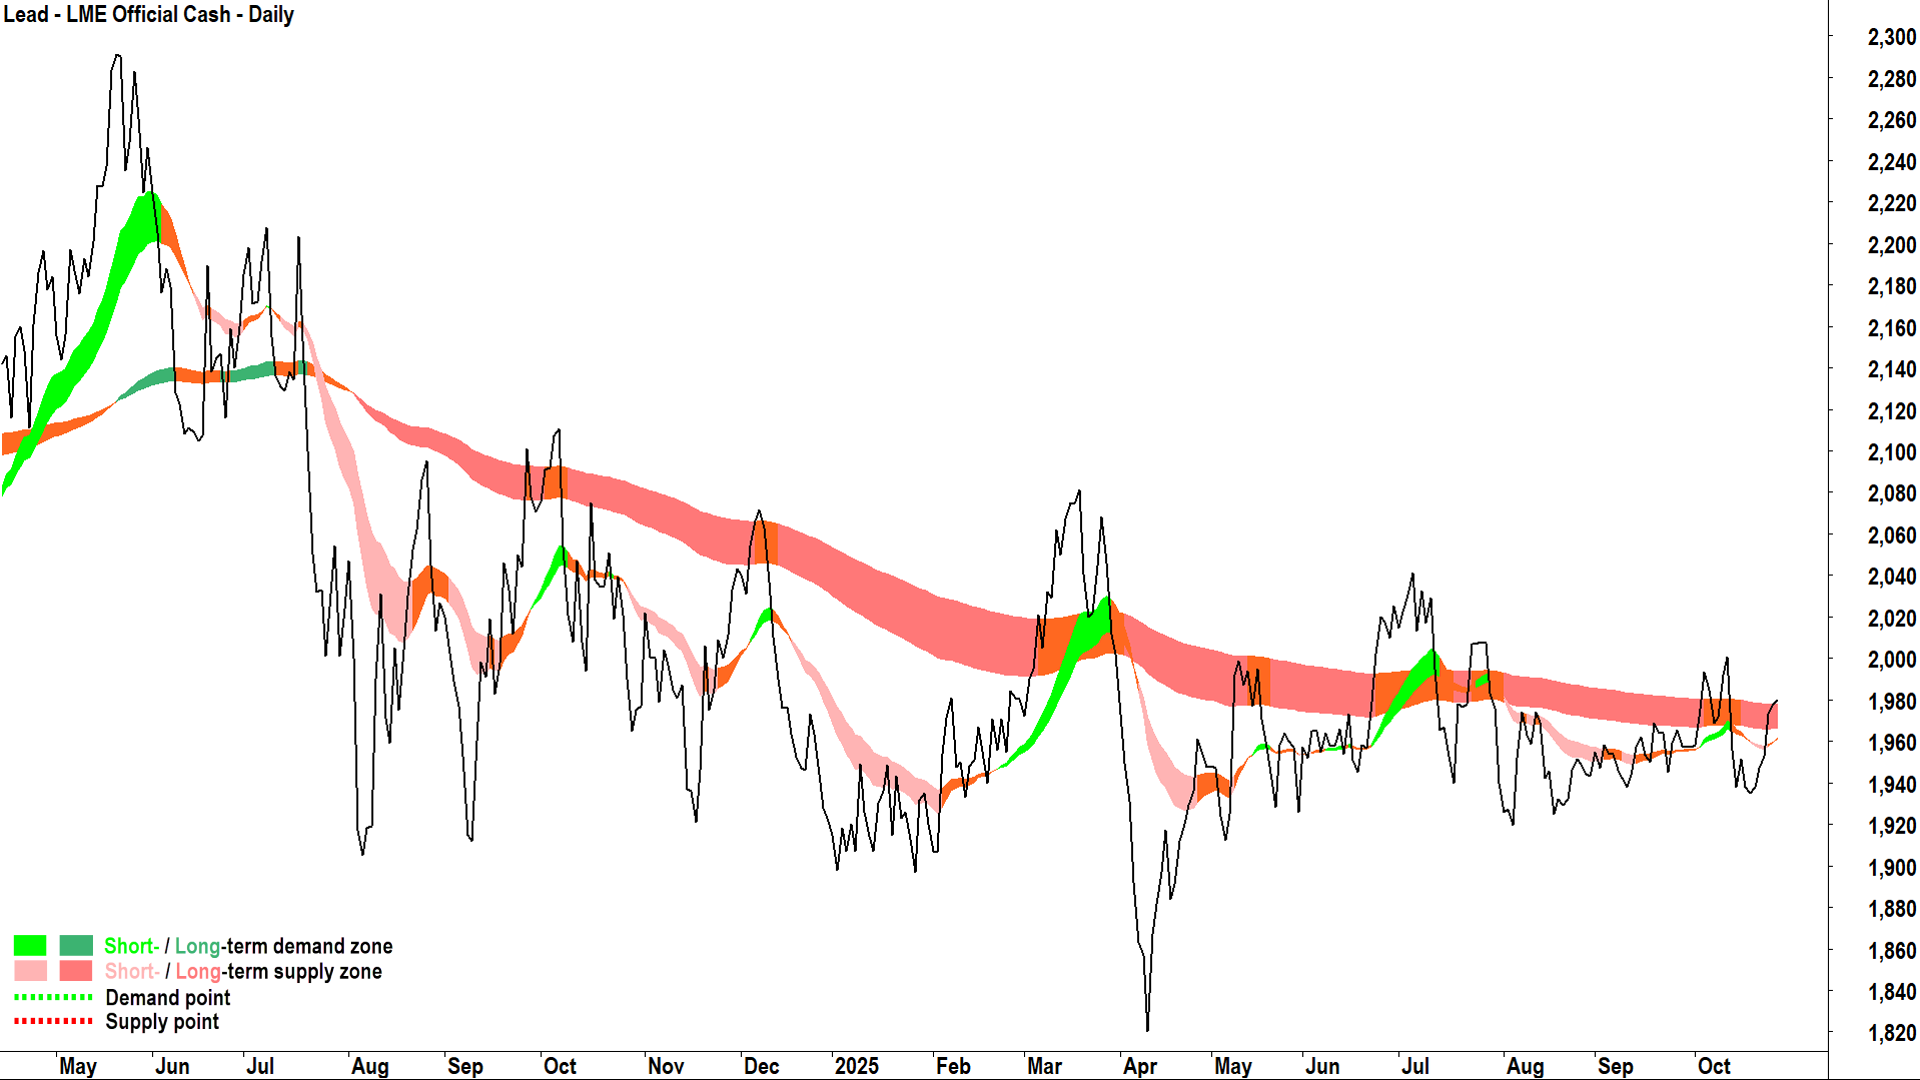
A very different chart to the first two (three if you count the Comp!).
Gosh I love technical analysis! 😍 I hope that after suffering through my rants here, you're beginning to love it too!
A picture tells a thousand words, and the chart above is far from a picture of strong excess demand. It's close to the opposite, or at best, it's bordering on equilibrium... even indifference.
Market participants don't appear to have strong opinions on LME lead... neither the demand nor supply sides wish to own it with any great desperation. If there's a consensus here – it's that there's no pressing reason to own lead at higher or lower prices.
View: My technical model requires me to have a zero risk position on lead (i.e., ZRP).
Nickel - LME Official Cash

Nickel - LME chart (click here for full size image)
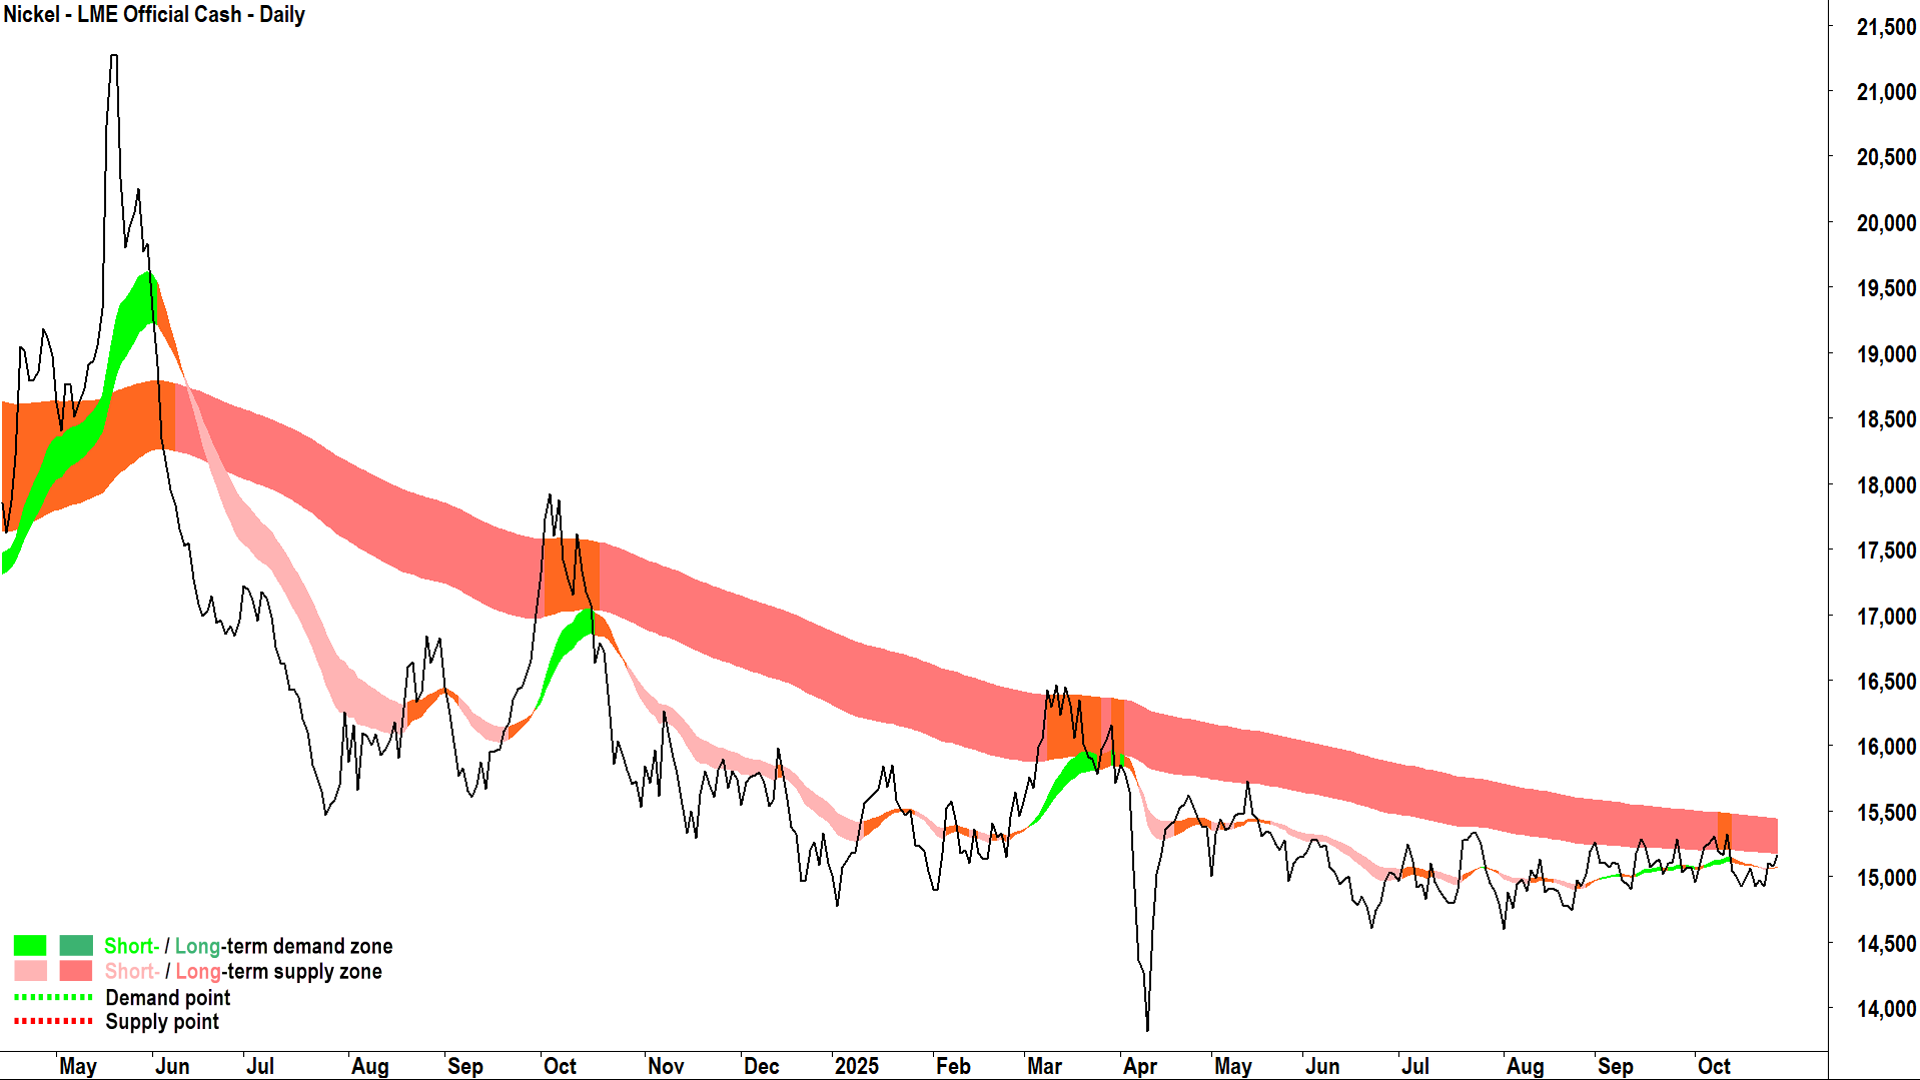
Ditto lead. Here, I'll direct your attention to just how powerful my trend ribbons are as tools for identifying the long term trend in price.
Don't mess with the long term trend ribbon!
Will lead and nickel ever go up!? 🤷
I don't know – I can't tell the future! But given that anything's possible, I believe that at some point it's inevitable the demand-supply environment for these metals will shift to create both scarcity and an increased desire to own them.
The good news is... when this occurs, the price action MUST improve. The short term trend MUST turn up. And the price MUST once again trade above the long term uptrend ribbon and that ribbon will again behave as a zone of dynamic demand.
Trying to pick when these things will occur is futile... so just focus your efforts on where these things are occurring and keep doing the work with respect to checking the technicals across your universe of opportunity.
View: My technical model requires me to have a zero risk position on nickel (i.e., ZRP).
Tin - LME Official Cash

Tin - LME chart (click here for full size image)
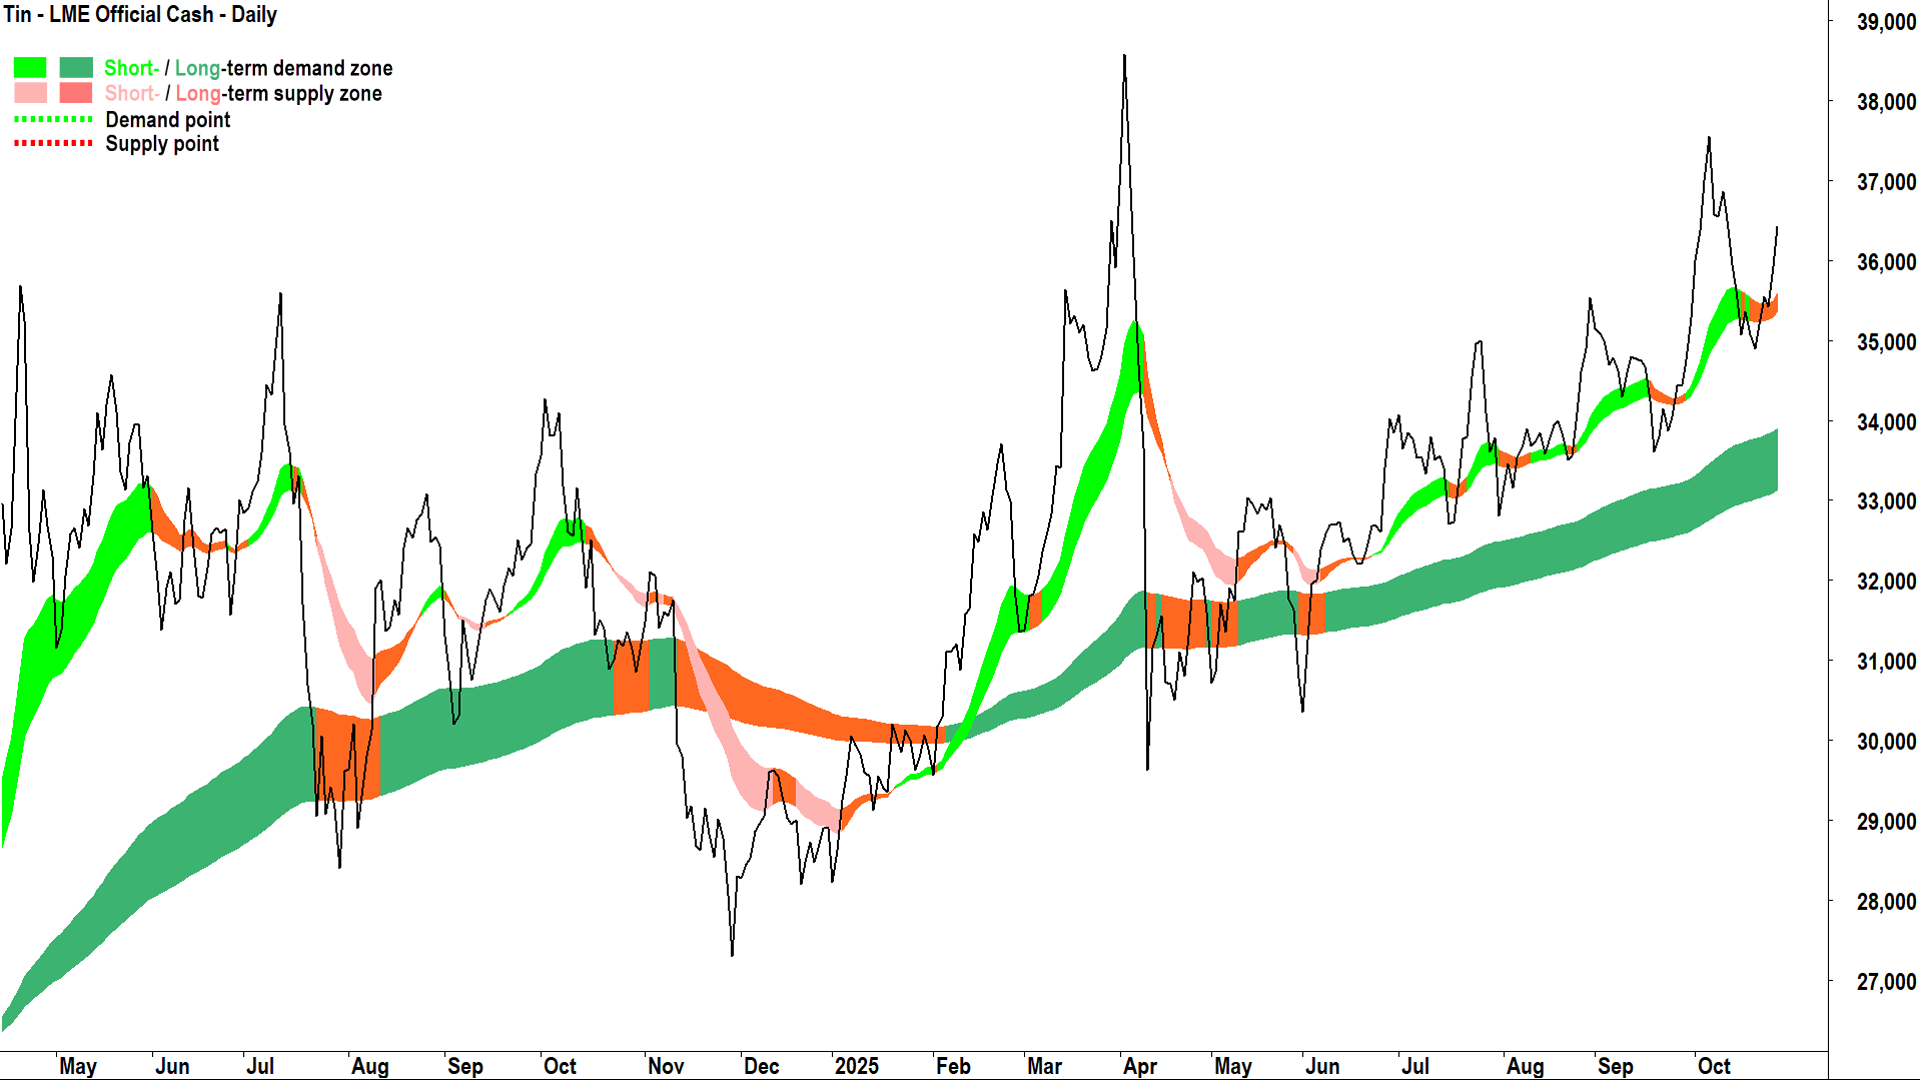
Back to the land of the living!!!
Again, I don't know anything about what's happening in the tin market... who are the major players... what's the market worried about when it comes to production or consumption... 🤔
But I do know that there's quite a few clever people out there that do. And they're directing capital flows towards owning it... while at the same time those with tin inventories seem keen to hang onto them unless compensated by higher prices.
The price action has reverted to rising peaks and rising troughs, and the short term trend appears to be resuming. The long term trend is solid.
View: Happy to stay the course on LME tin. My technical model allows me to either add or maintain risk on tin (i.e., +R / =R).
Key levels: 34895 is the closest point of demand, ideally, the price should not close below here if the demand-side is in control of the Comp's price – and this will nullify the short term uptrend = ⚠️ Before that, ideally the price does not close below the short term uptrend ribbon (presently 35380-35600)
Zinc - LME Official Cash

Zinc - LME chart (click here for full size image)
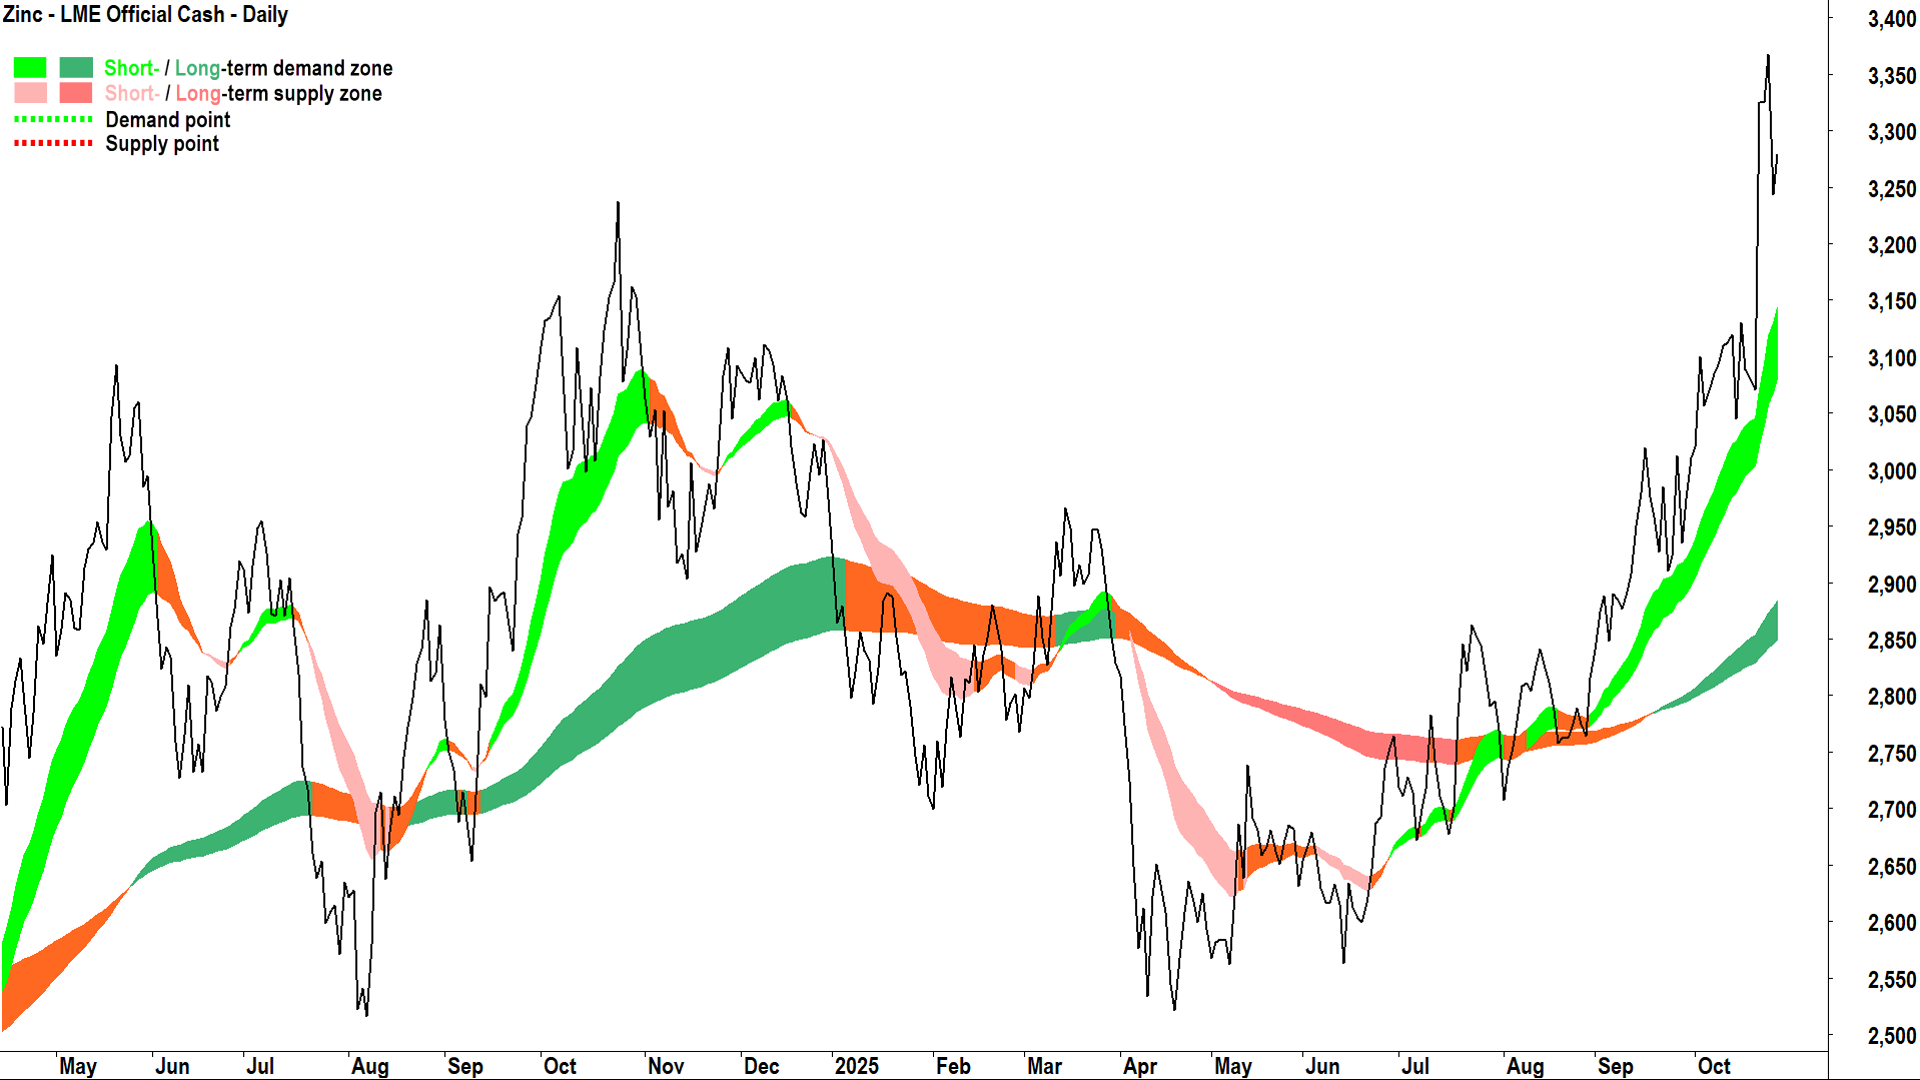
What's great about today's sojourn through the base metals charts is it should become very clear which metals are in the greatest demand and the least supply.
Zinc's chart is perhaps the strongest picture of demand-side control yet – particularly with respect to the short term uptrend (yes, I did check the logarithmic scaled charts before making this statement!).
Like Aluminium, the post-Ukraine invasion high remains the most relevant overhead point of supply – 4530 set on 22-Apr 2022. But Zinc's all time high is even loftier, set at 4620 all the way back on 30-Nov 2006 (China boom, pre-GFC!).
Unlike Aluminium, though, there are a couple of pressure points of supply between the all time high and the current price to watch out for – 3509 and 3877.
View: Happy to stay the course on LME zinc. My technical model allows me to either add or maintain risk on zinc (i.e., +R / =R).
Key levels: 3130 is the closest point of demand, ideally, the price should not close below here if the demand-side is in control of the Comp's price – but I expect 3405 will be a more critical balance point between demand-and-supply-side control; alternatively, a close below the short term uptrend ribbon (presently 3085-3145) will nullify the short term uptrend = ⚠️
ChartWatch *LIVE* Webinar
ChartWatch *LIVE* Webinars – WEEKLY Wednesday's @ 12pm AEDT
Learn more about technical analysis and trend following through real case studies on ASX stocks. Australia's premier technical analyst, Carl Capolingua, shares his unique insights on stocks as requested by viewers. Ask about a company in your portfolio or anything related to trading and investing and get Carl's expert opinion.
Places are limited so >REGISTER NOW!<
