ChartWatch Markets: Aluminium, Copper, Nickel, Tin, and Zinc, the latest trends in base metals markets
Technical analysis of the most important global stock indices, commodities, bonds, FX, and crypto impacting your ASX portfolio each day.


Source: Shutterstock
Mentioned
KEY POINTS
- The Nasdaq Composite bull market keeps ticking on, and we don't need any fancy technical indicators to tell us that!
- Last week we did a deep dive on copper, this week, we investigate its base metals stablemates aluminium, lead, nickel, tin, and zinc.
- Do they signal that investors are growing more confident about global economic growth?
In today's edition of ChartWatch Markets, we'll be covering the technicals for:
Nasdaq Composite
Aluminium LME Official Cash
Lead LME Official Cash
Nickel LME Official Cash
Tin LME Official Cash
Zinc LME Official Cash
Nasdaq Composite Index

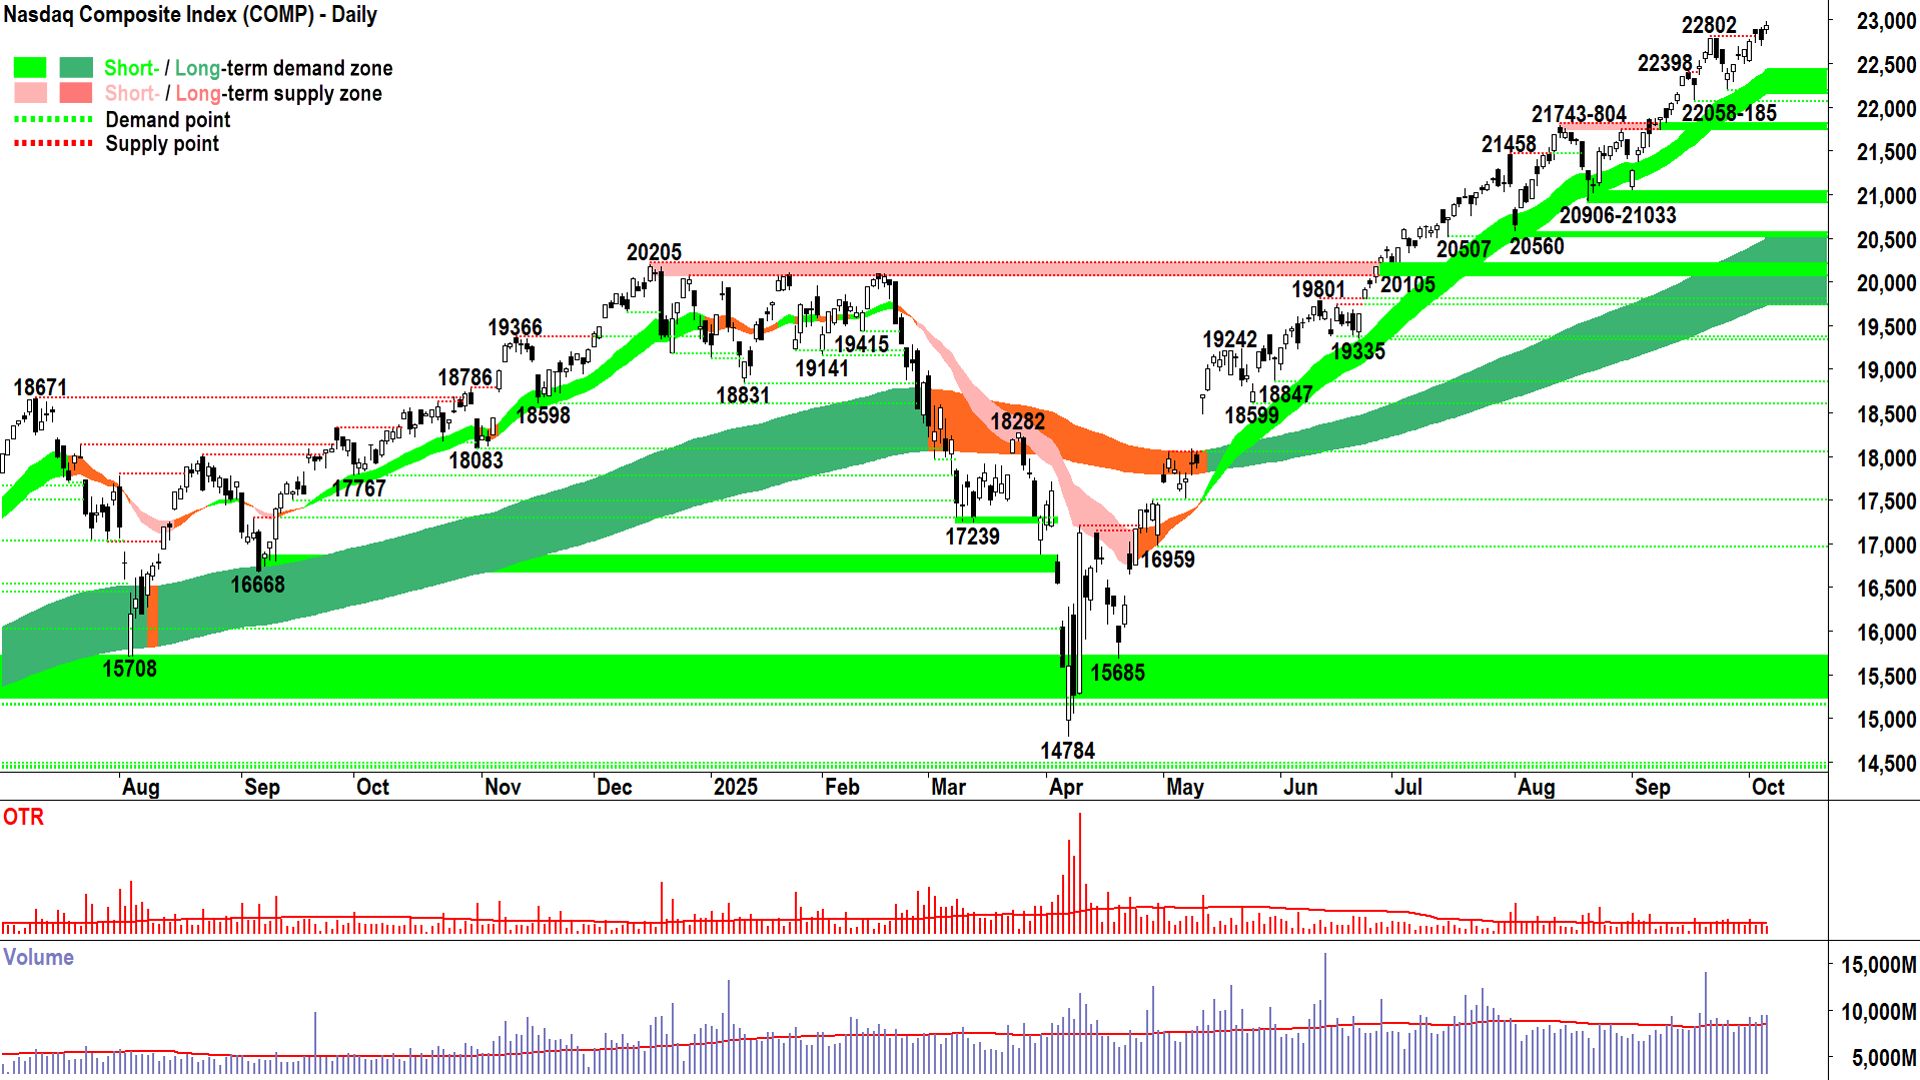
Nasdaq Composite Index chart (click here for full size image)
In yesterday’s update, we noted those two “not ideal-but nothing to worry about” candles on Thursday and Friday. Monday’s candle suggests that narrative is about right. Another closing all-time high, just off a new all-time high of 22991.7.
The Comp isn’t here by accident. It’s here because there has been a pervasive imbalance between demand and supply since the April low – pervasive excess demand, that is.
There has been zero change with the advent of Monday’s modest demand-side candle… a touch of indecision perhaps, with a small upward pointing shadow… but I'm splitting hairs here.
The Comp’s chart remains a picture of demand-side control:
Trends:
ST trend = Up, well-established, steepening, acting as zone of dynamic demand = traders buy the dip = demand-side control ✅
LT trend = Up, well-established, steepening, acting as zone of dynamic demand = funds’ accumulating = demand-side control ✅
Price action: Rising peaks & rising troughs = buy the dip = demand-side control ✅
Candles: Predominance of demand-side candles (i.e. white bodied and or downward pointing shadows) = buy the dip, pervasive programmed buy orders = demand-side control ✅
= FRP. (Full Risk Position = My personal allowable capital allocation limit for my investments in US stocks is 100%).
Key levels: 22058 is the closest point of demand, the price should not close below here if the demand-side is in control of the Comp's price; a close below the short term uptrend ribbon (presently 22160-22435) will nullify the short term uptrend = ⚠️
You might be wondering why my technical analysis is so boring – day in day out – it's the same thing over and again... demand... blah... supply... blah... who's in control... blah blah blah!!! 🤦
Shouldn’t I be checking the RSI or MACD to see if the Comp is “overbought”, or the Bollinger Bands, or performing a Gann or Elliott Wave analysis? Surely there’s a critical piece of information relating to the sustainability of the Comp’s trends in one of those indicators? 🤔
A: Nope, there isn't! D vs S = P is ALL you need to know! 💯😉
Aluminium LME Official Cash

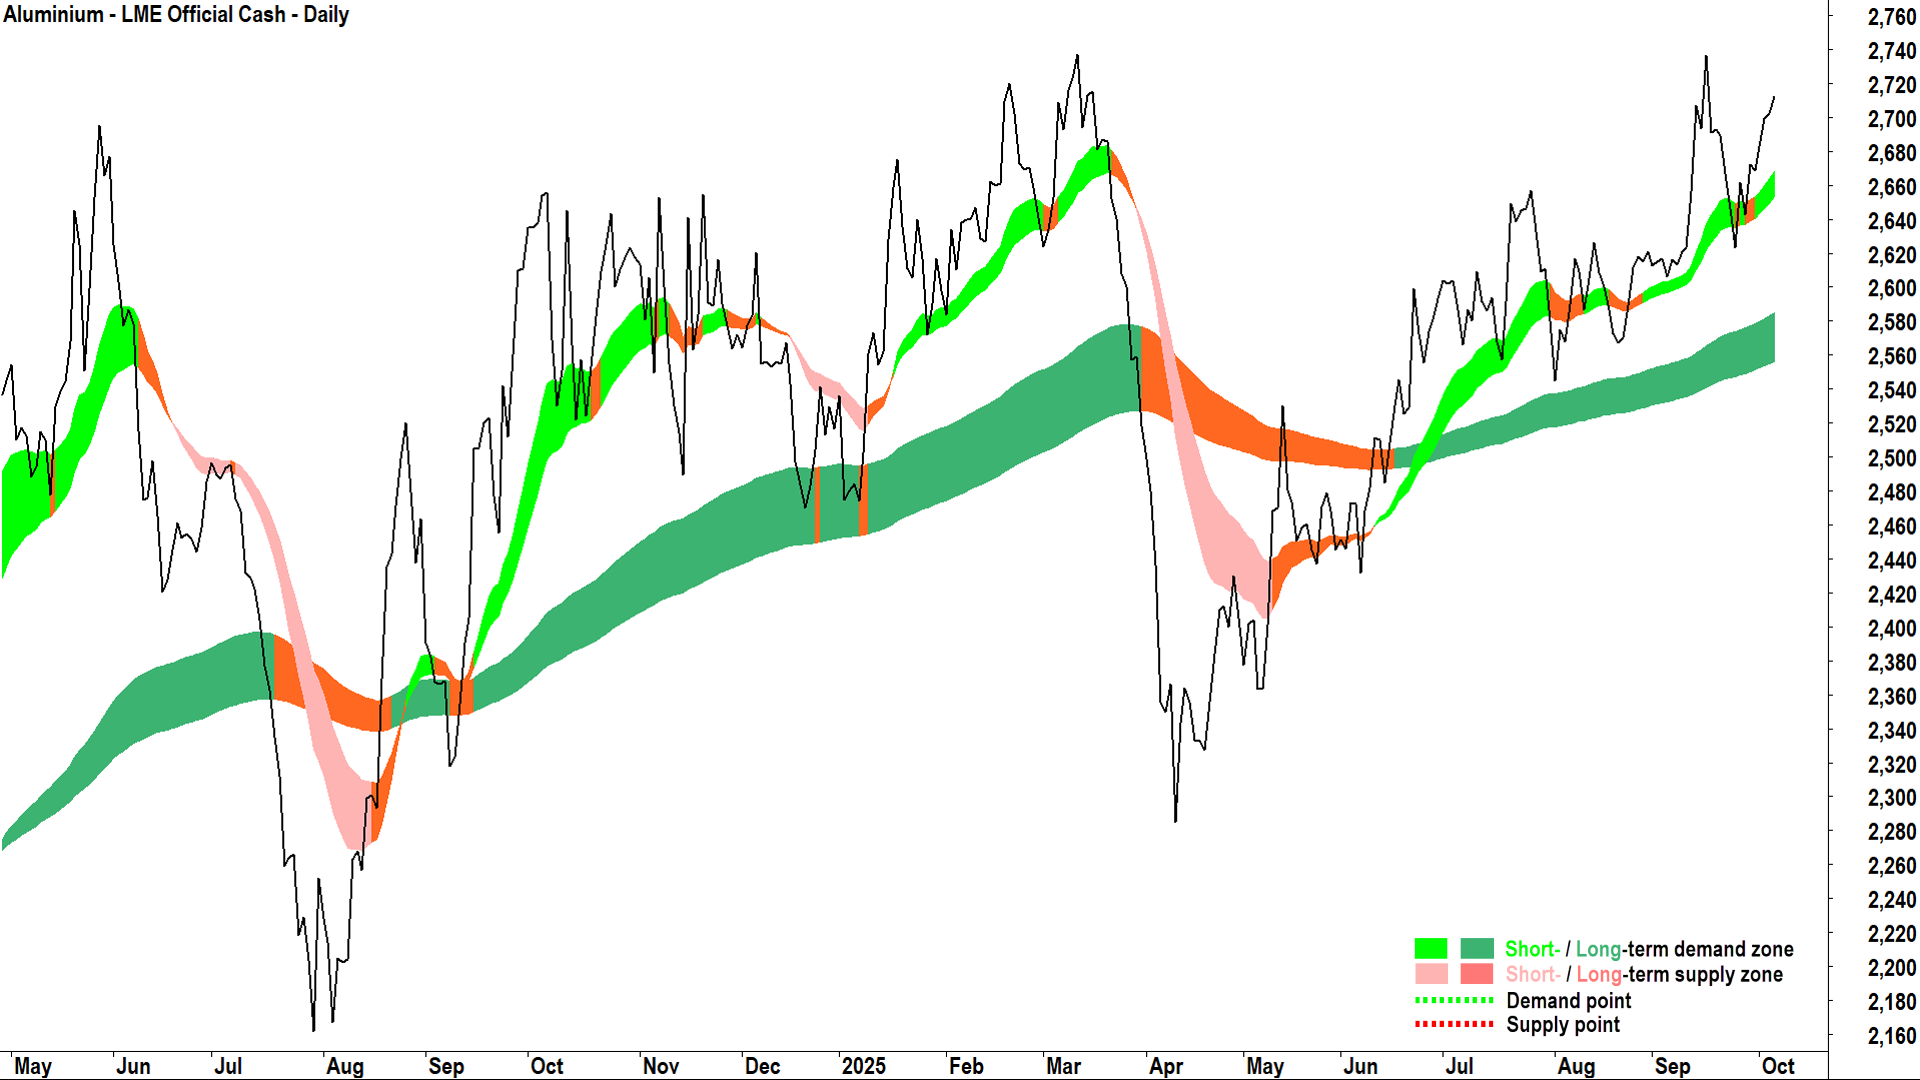
Aluminium LME Official Cash chart (click here for full size image)
Last week we covered the improving short and long term uptrends in LME and COMEX copper.
Today, I’d like to check up on the trends in copper’s base metals cousins, Aluminium, Lead, Nickel, Tin, and Zinc.
Aluminium’s short and long term uptrends are arguably better established than copper’s, but where copper exceeds its stablemate, is in the fact that copper has broken through the top of its 12-month trading range. Aluminium isn’t far behind, nudging ever closer to the 12-Mar major point of supply at 2737.

Aluminium LME Official Cash weekly chart
Zoom out to the weekly chart, and we can see just how important that level of supply is – with little else in the way until the 4-Mar 2022 spike-peak of 3851. Dare aluminium bulls dream?
Dreaming isn't my gig, but I can see some very strong indications of demand-side control here – and growing demand-side control at that…
Lead LME Official Cash

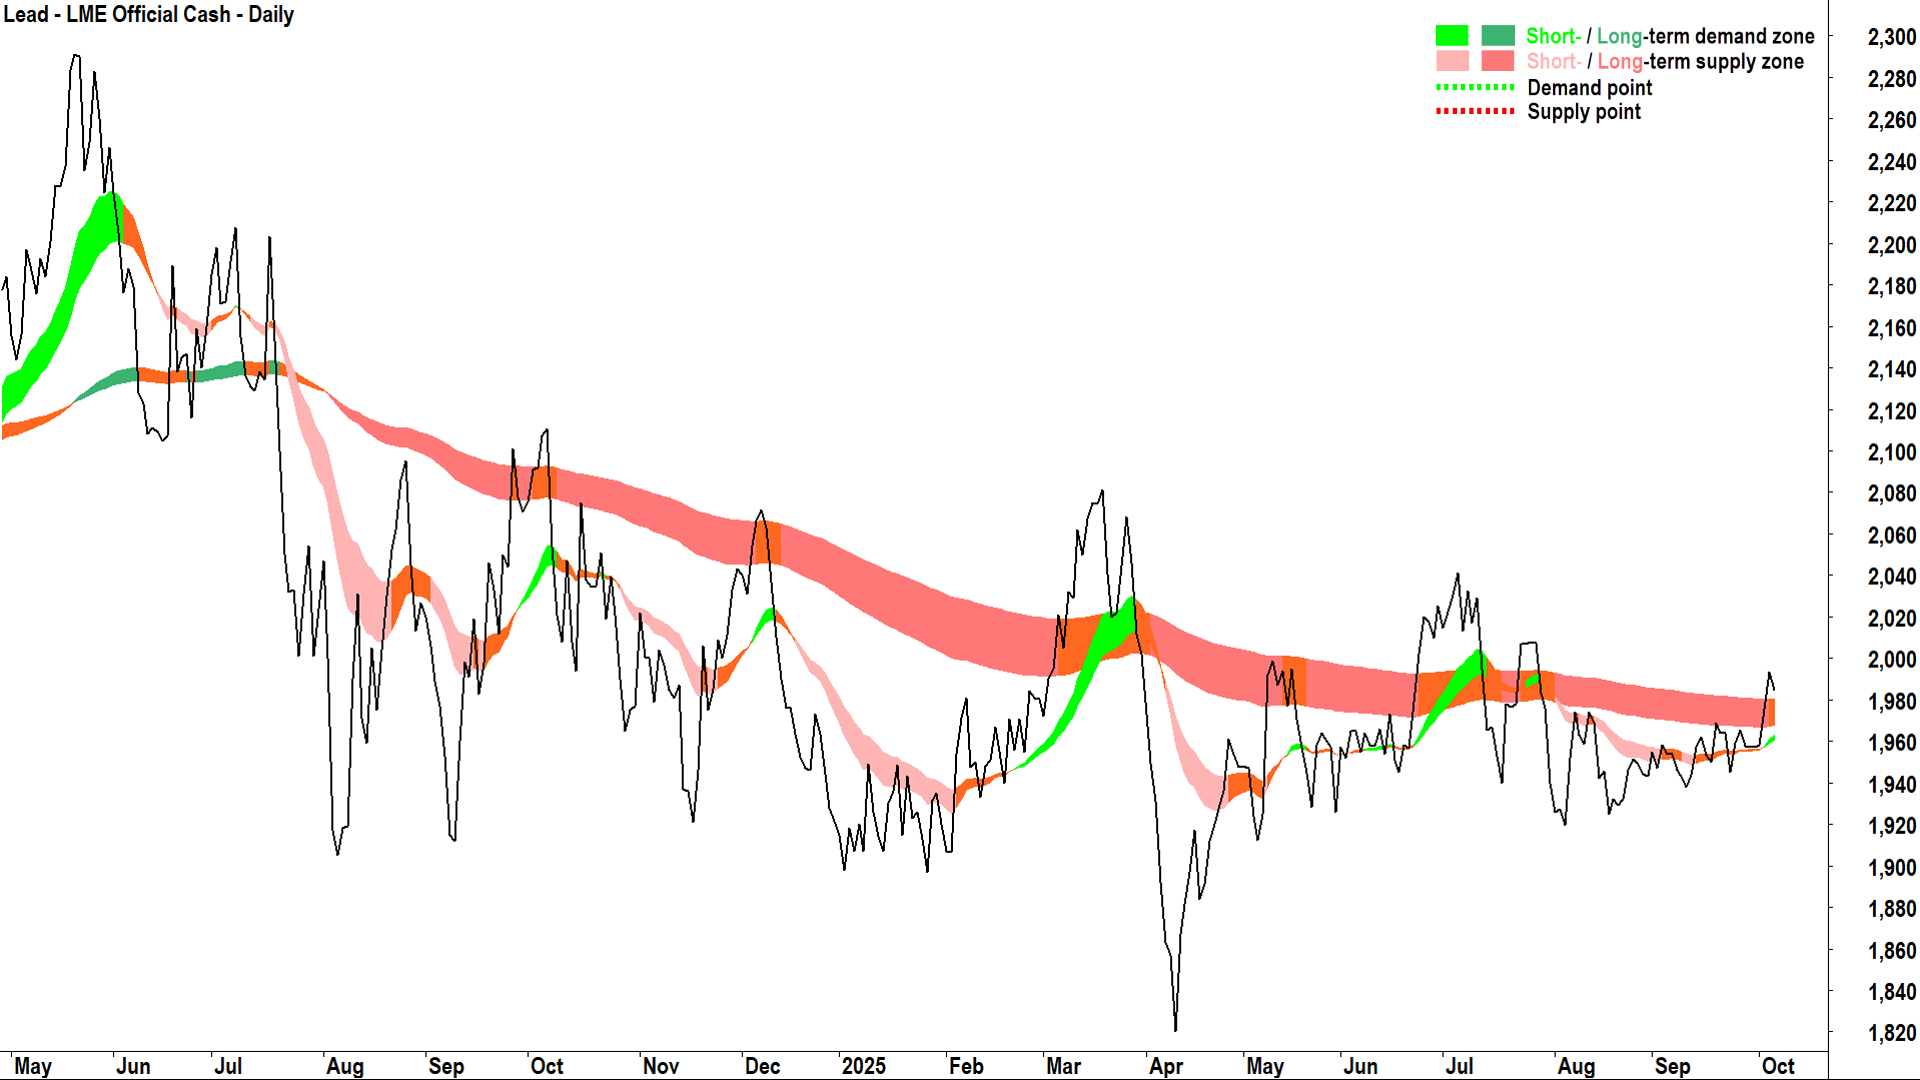
Lead LME Official Cash (click here for full size image)
It’s clear from this chart that base metals ain’t base metals. Certainly, there’s the overarching theme of global economic growth (or lack-thereof) assisting (or hindering) their collective demand, but each has its own unique set of additional specific demand and supply factors.
With the lead chart, it's clear that the demand-supply environment is presently skewed towards excess-supply with the long term trend blipping into neutral for the first time since July (versus a previous downtrend).
The short term trend is improving and has just flipped to up, however, and the price action since mid-August is generally rising peaks and rising troughs. So, there appears to be some excess demand creeping into the system in the short term.
Putting long and short term factors together, we’re roughly neutral here… i.e., equilibrium at best with plenty of work to do to establish confident short and long term uptrends.
Nickel LME Official Cash

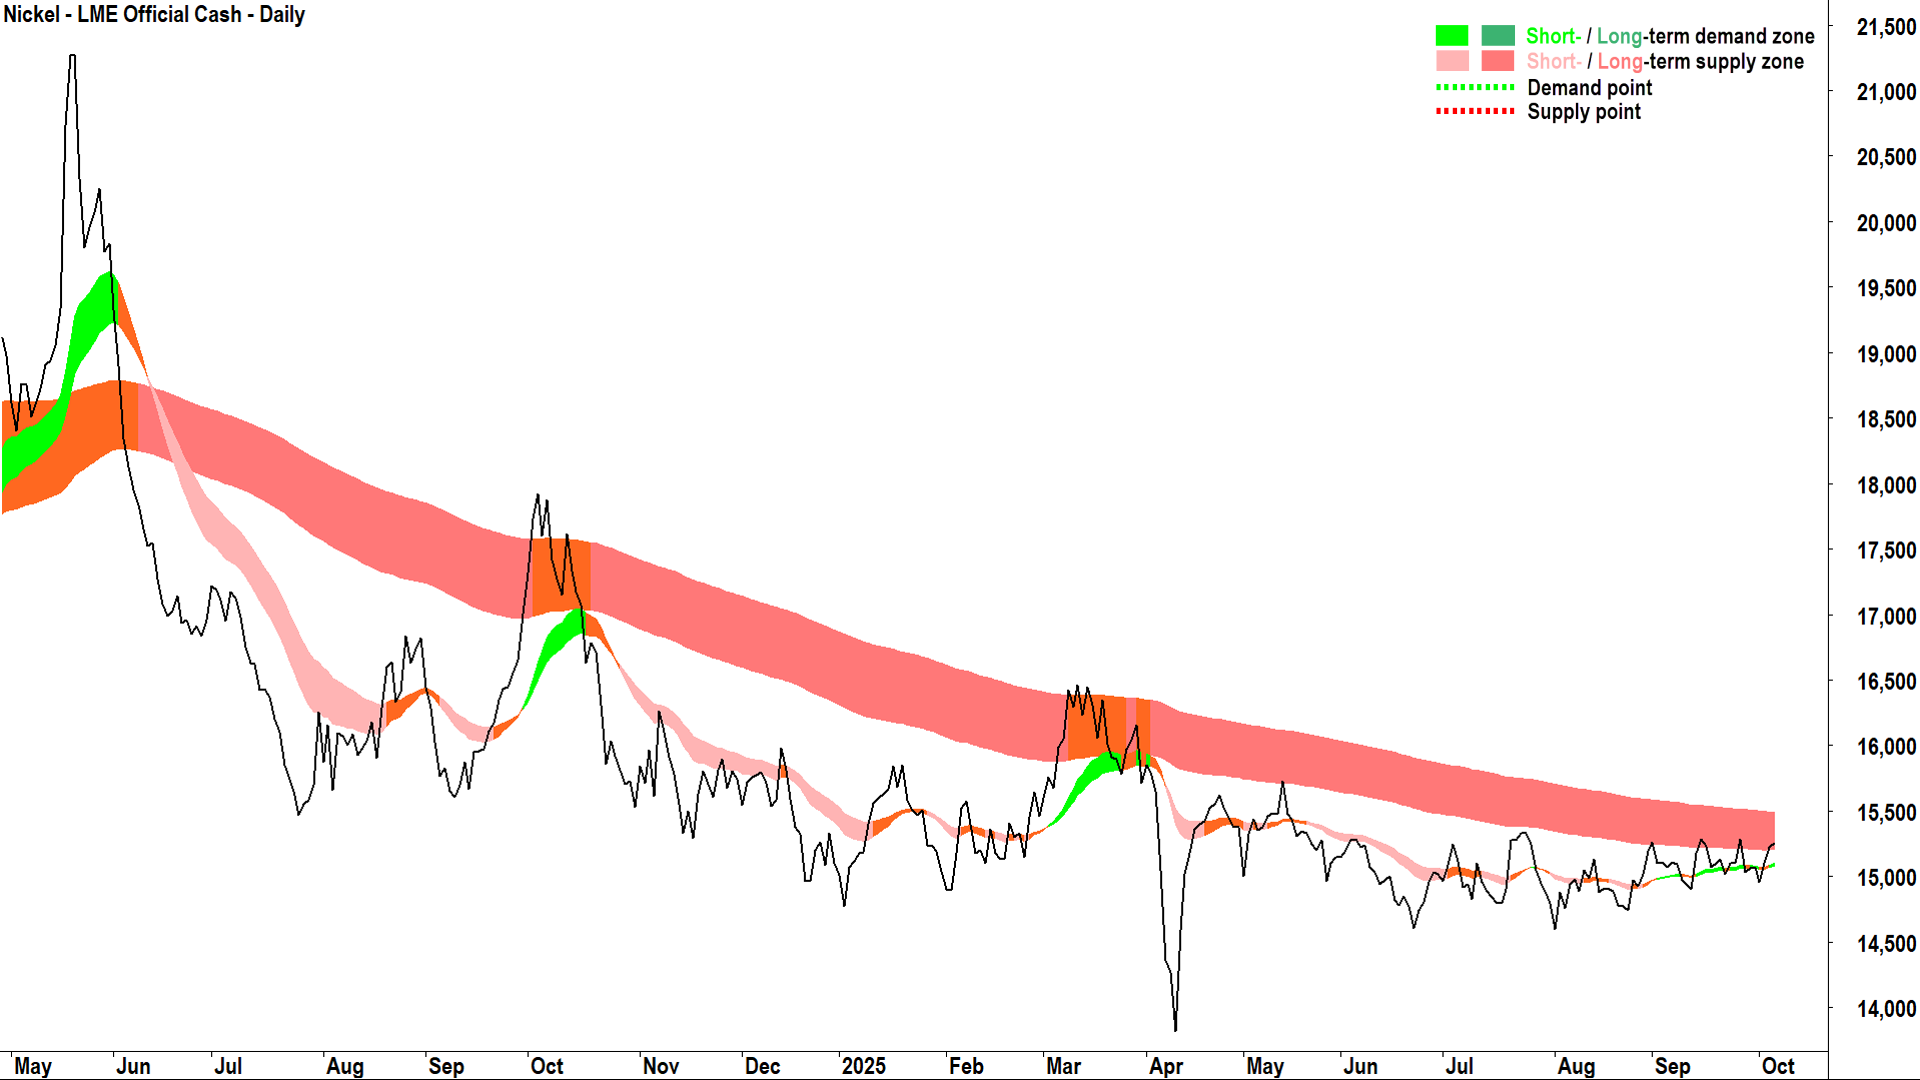
Nickel LME Official Cash (click here for full size image)
Nickel has been in a well-established long term downtrend for the better part of 2-years now. But, squint and zoom the page to roughly 200%, and you’ll see the tiniest of short term uptrends developing.
But, to call this anything more than “moving gradually towards equilibrium” would be generous. Nickel is lacking a spark, it requires a sharp and large move up to instigate short covering, speculative buying, and long term position building. Between you and me… I’m not sure nickel has a move like that in it!
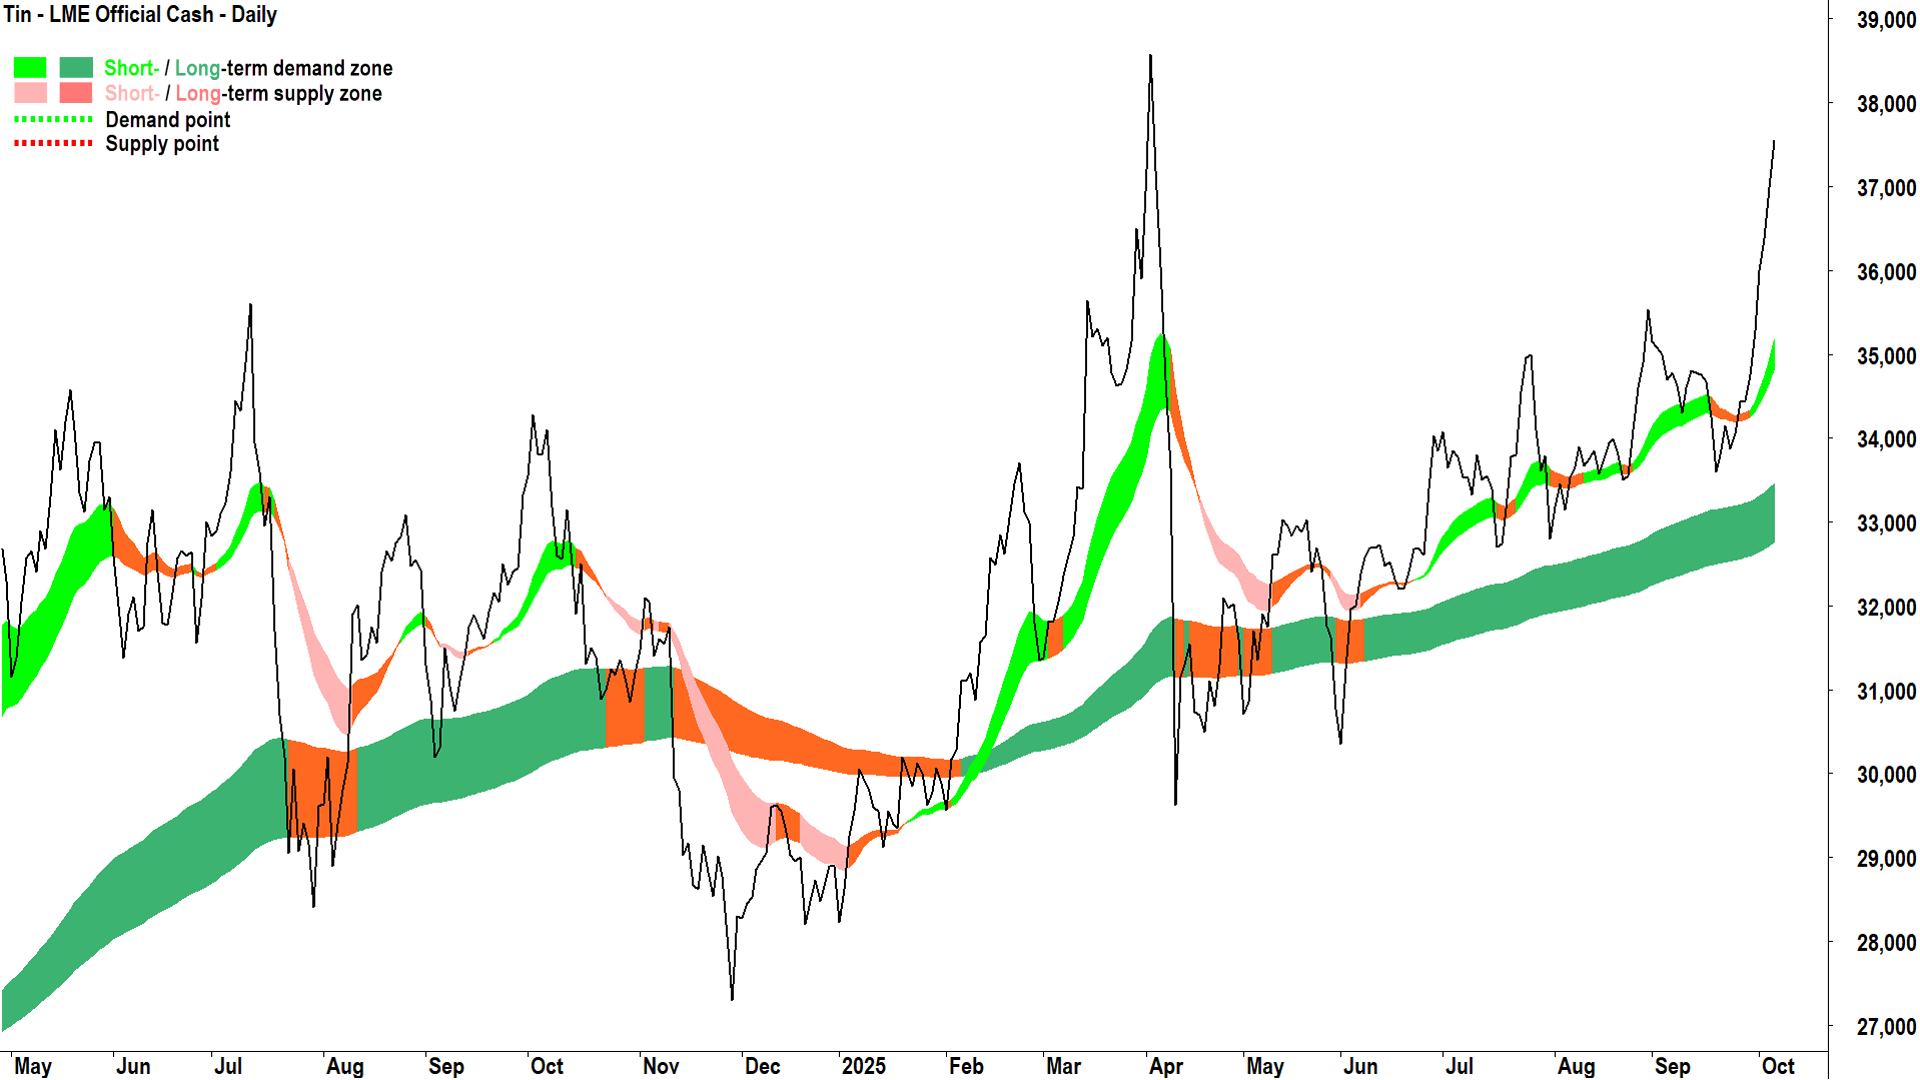
Tin LME Official Cash

Tin LME Official Cash chart (click here for full size image)
That’s more like it. Short and long term uptrends, and the “sharp and large move up” that nickel is lacking. Nothing makes an asset’s price rise faster than an asset’s price rising… and tin is closing in fast on the 2-Apr major point of supply at 38575.
Its upside past that cap is similarly substantial as aluminium’s, with the 4-Mar 2022 major point of supply at 47325 the next obvious clear upside barrier (check weekly chart, not shown).
Tin’s trends and price action smack of strong and improving demand-side control, but the big test of 38575 awaits. Watch the price action there closely – a shallow pullback and a quick break indicates little supply-side resistance – versus a sharp pullback indicates more work to be done to probe into the 40k’s.
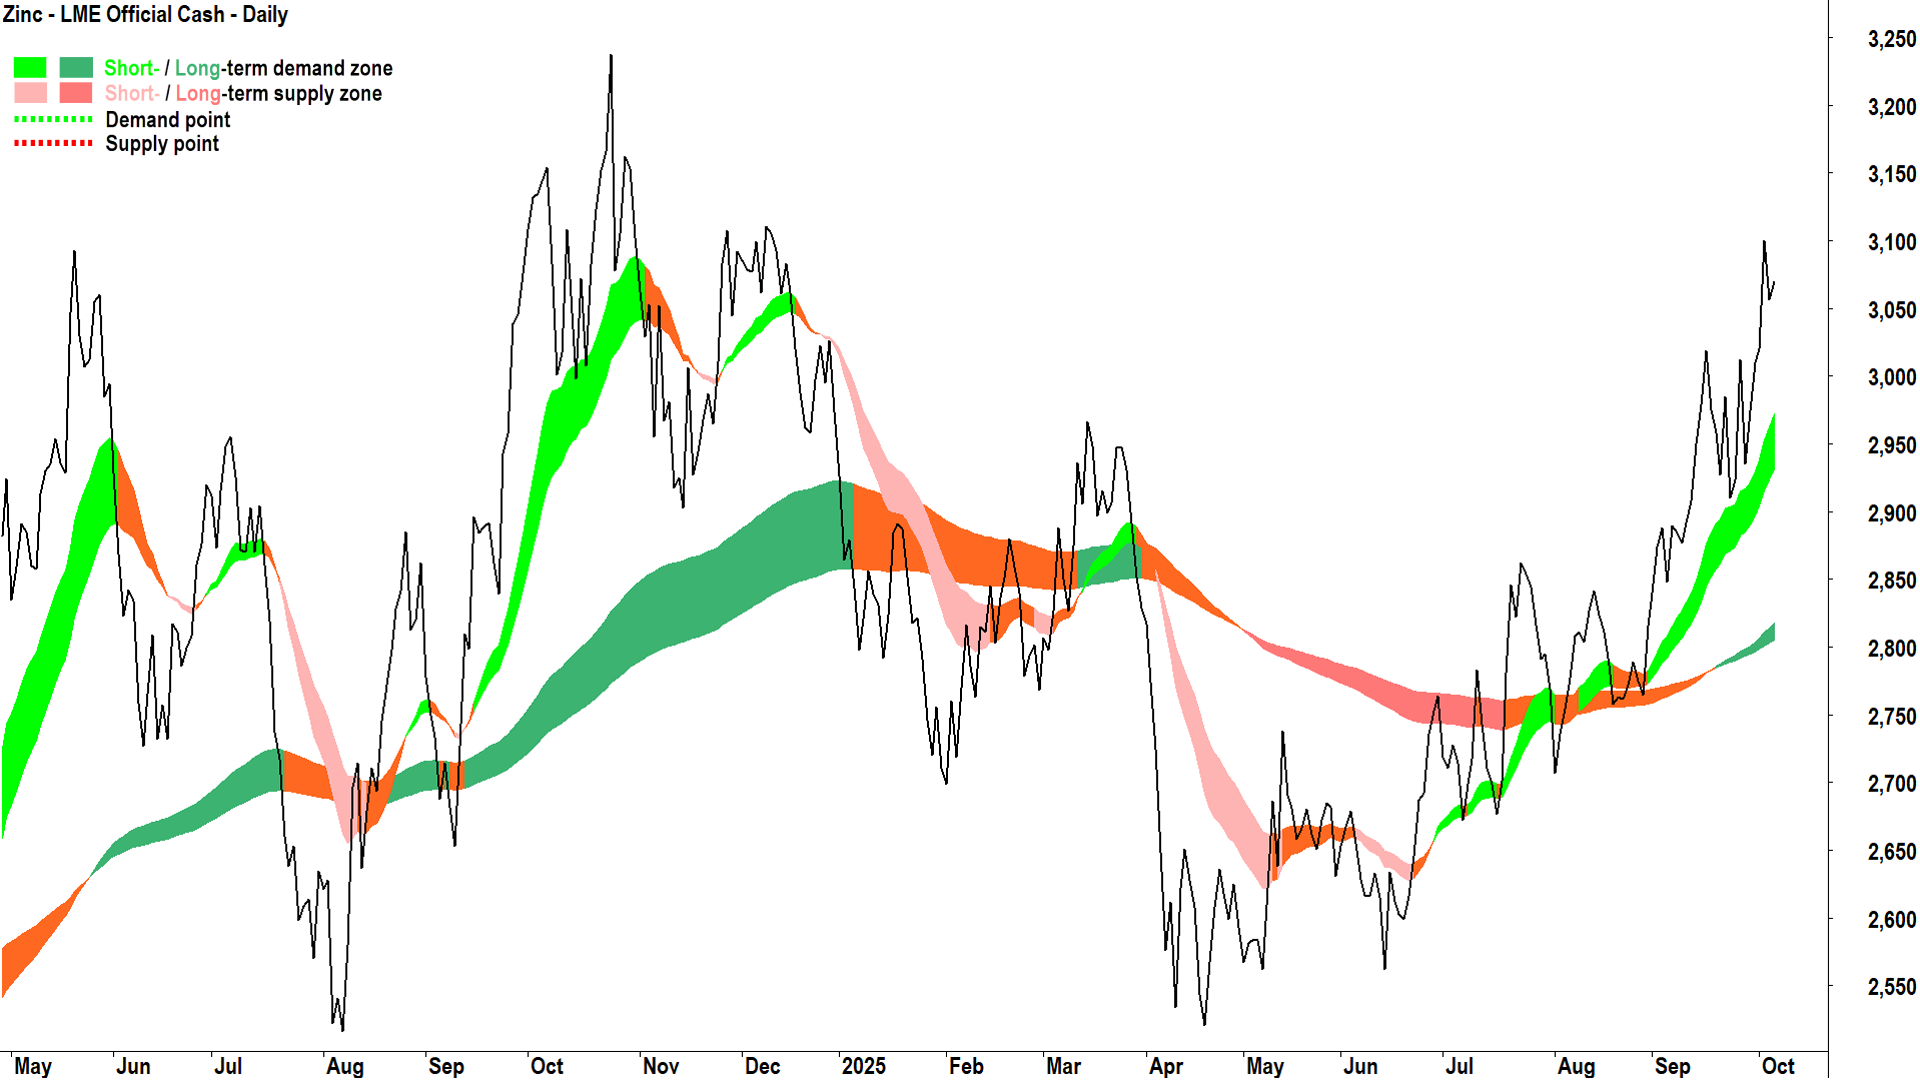
Zinc LME Official Cash

Zinc LME Official Cash chart (click here for full size image)
Last but certainly not least, zinc is also showing a well-established, consistent, and strengthening short term trend, supporting demand-side oriented price action (rising peaks and rising troughs), and a developing long term uptrend.
There’s still plenty of work to do to clear potential points of supply through to the 24-Oct 2024 peak of 3238. Beyond that, the weekly chart (not shown) suggests that 3509 and then 3678 could be future supply pressure points.
Zinc makes it 4 out of the 6 major base metals that are presently showing signs of solid-or-at-least-growing demand-side control, which in my experience is a positive – the more of them that line up, the better those underlying macroeconomic demand-side drivers tend to be.
ChartWatch *LIVE* Webinar
ChartWatch *LIVE* Webinars – WEEKLY Wednesday's @ 12pm AEDT
Learn more about technical analysis and trend following through real case studies on ASX stocks. Australia's premier technical analyst, Carl Capolingua, shares his unique insights on stocks as requested by viewers. Ask about a company in your portfolio or anything related to trading and investing and get Carl's expert opinion.
Places are limited so >REGISTER NOW!<
