ASX 200 rally on borrowed time? Risks and opportunities as the Middle East conflict drags on
Stocks are back at record highs. Is the rally real, or are markets sleepwalking into another crash? What you need to know before you invest.

Source: Market Index
Mentioned
KEY POINTS
- From double-digit per cent losses to a record S&P 500 high in just 11 trading sessions, the Middle East conflict has triggered one of the fastest stock market recoveries in history.
- But is it built to last? Oil supply remains impaired, inflation is rising, and central banks are boxed in. If energy prices stay elevated, things could turn ugly — fast. Investors need a plan.
- This article cuts through the noise, presenting both the bull and bear cases, expert insights into the present macroeconomic backdrop, and the specific sectors and stocks to watch right now.
Markets have done something remarkable. From the panicked lows that followed the eruption of the Iran conflict — with oil breaching US$110/bbl and local and international benchmark stock indexes sporting double-digit percentage losses — investor sentiment has staged a stunning about-face. The S&P 500 has clawed its way back to record territory, the local S&P/ASX 200 has steadied just below its all-time high, and base metals prices — leading global economic growth indicators — have rallied.
History is on the bulls' side here. Typical financial industry disclaimer required: “History is not always a reliable guide for future outcomes”, but the fact is, markets have, on average, fully recovered well within a year from supply-side oil shocks. The First Gulf War is perhaps the textbook example — that time it took only 7 months for the S&P 500 to recover the full extent of its losses.
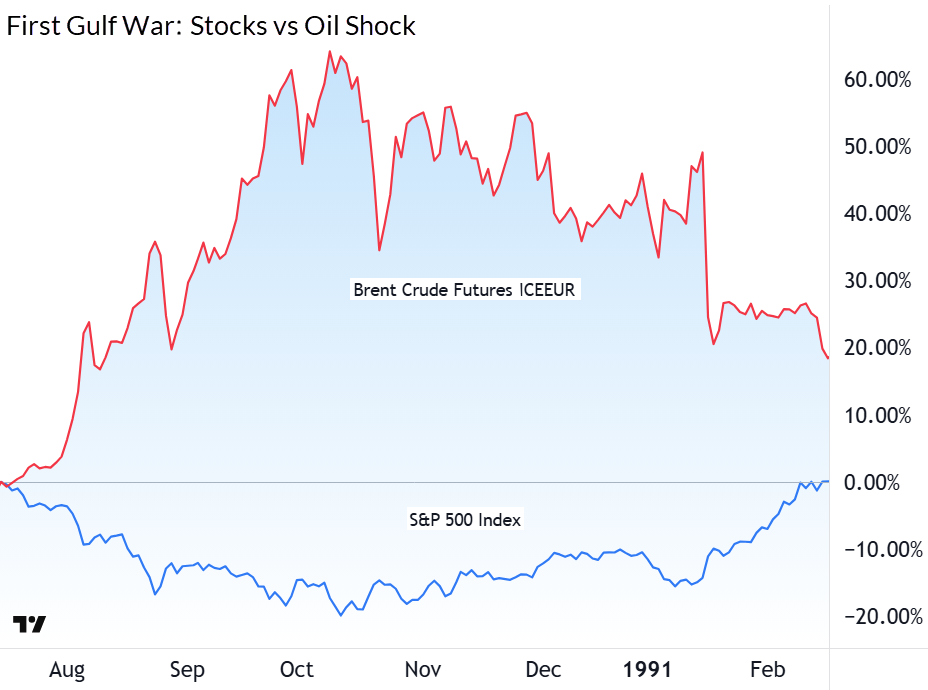
S&P 500 vs oil during the First Gulf War and aftermath
Wait a minute, you might say — that was 7 months, this time it took just 11 trading sessions. What gives? Indeed, either this time is different, or it raises an uncomfortable question every investor must now reconcile: is this rally pricing in a resolution that may not arrive as quickly as hoped — and what happens if it doesn't?
This article will explore the optimistic and pessimistic positions investors may take regarding stock investing in the current environment, and highlight where and how experts are looking to invest their capital in these uncertain times.
The great “is this time different?” debate
The velocity and breadth of the equity rebound have split investor opinion. Too early, just right, or just the beginning? Let’s try to lay out the optimistic and pessimistic cases:
Too optimistic — reasons for caution ⚠️
The Strait of Hormuz remains under de facto closure, with tanker delays and insurance costs still severely impairing logistics. We can see, even at this early stage, that a ceasefire announcement is not the same as restored supply. This would require sustained agreement from both sides to allow safe passage through the Strait —a condition that appears far from certain in the near term.
Energy prices haven't meaningfully unwound. Both crude oil and European natural gas prices are running substantially above pre-conflict February levels, and above most major investment bank forecasts for 2026. This doesn't feel like a blip — it feels more like a structural shift in the world’s energy cost base.
The inflation arithmetic is ugly. Morgan Stanley estimates a 10% rise in oil prices adds approximately 35 basis points to US headline CPI over three months. Australia's exposure is even more acute: diesel prices have nearly doubled locally, and with roughly 80% of refined fuel imported — a figure now temporarily higher after a fire at one of Australia's two domestic refiners — the pass-through risk is severe.
Central banks are increasingly boxed in. The RBA has already hiked twice this year (February and March) and markets are pricing two more. The ECB has signalled two additional hikes. The US Federal Reserve has pushed its first cut from June to September at the earliest. If inflation becomes embedded rather than transitory, the pivot from "delay cuts" to "consider hikes" becomes a very real tail risk — and arguably that's a scenario equity markets are not pricing at present record highs.
ASX earnings revisions are already negative. Macquarie's four-week rolling numbers show net Australian earnings revisions tracking negative in March, with the market price to earnings ratio ("PER") for December 2026 compressing to 16.8x (a lower PER signals cheaper stocks, a higher PER signals more expensive ones) — a sign that analysts are quietly marking down expectations even as share prices recovered. Yet, even against these lower expectations, Shaw and Partners research suggests that the 12-month forward PER for Australian stocks remains over one standard deviation above average.
Justified — and potentially more to come 🚀
History is unambiguous: geopolitical risk events are buying opportunities. Morgan Stanley's US strategists show the S&P 500 averages gains of 2%, 6%, and 8% over one, six, and twelve months following geopolitical shocks. Recent gains simply reflect the fact that markets tend to come back stronger after oil supply shocks.
The Fed's playbook is "hold or cut, not hike." Chair Powell has explicitly framed the Fed's response to oil-induced inflation as one of patience rather than panic. With US wage growth the lowest since 2021, UBS is comfortable pencilling in two Fed cuts in 2026.
US credit spreads have held. Morgan Stanley and UBS both flag that credit spread stability — now back near pre-conflict levels — has historically implied the US equity market is trading approximately 8% below fair value. In plain English: when credit holds, the liquidity underpinning equities holds.
AI remains a structural demand driver that operates largely independently of the energy cycle. UBS forecasts 2.5% productivity growth from 2028 — and every 1% of productivity adds roughly 20% to fair value. The broker also notes that The Magnificent Six have de-rated to a 12-year low relative to the broader market despite maintaining superior earnings growth and revisions.
What the experts are saying: scenarios, targets and where to invest
On the macro backdrop
Morgan Stanley notes their managed escalation base case has Brent at US$110/bbl in the second quarter, falling to US$90/bbl by September — a scenario it describes as uncomfortable but manageable. The investment bank’s bear case sees oil sustaining above US$120-130/bbl with the Fed pivoting to inflation over growth — a scenario where equity returns are negative over the next 12 months.
For Australia specifically, Morgan Stanley's macro outlook is decidedly below consensus. Their 2026 GDP forecast of 1.6% year-on-year (versus consensus near 2%) reflects a toxic combination:
RBA hiking into a supply shock
Likely fiscal tightening in the May budget
A weakening consumer
Simmering energy security risks given our import-dependent fuel mix.
The stagflation debate — growth down, inflation up — is no longer a fringe discussion. It's increasingly being accepted as the base case for Australia.
On index targets
Morgan Stanley holds a 12-month ASX 200 price target of 9,250 — implying upside from current levels but with the caveat of an "uneven backdrop" that justifies keeping Australian equities underweight relative to international peers.
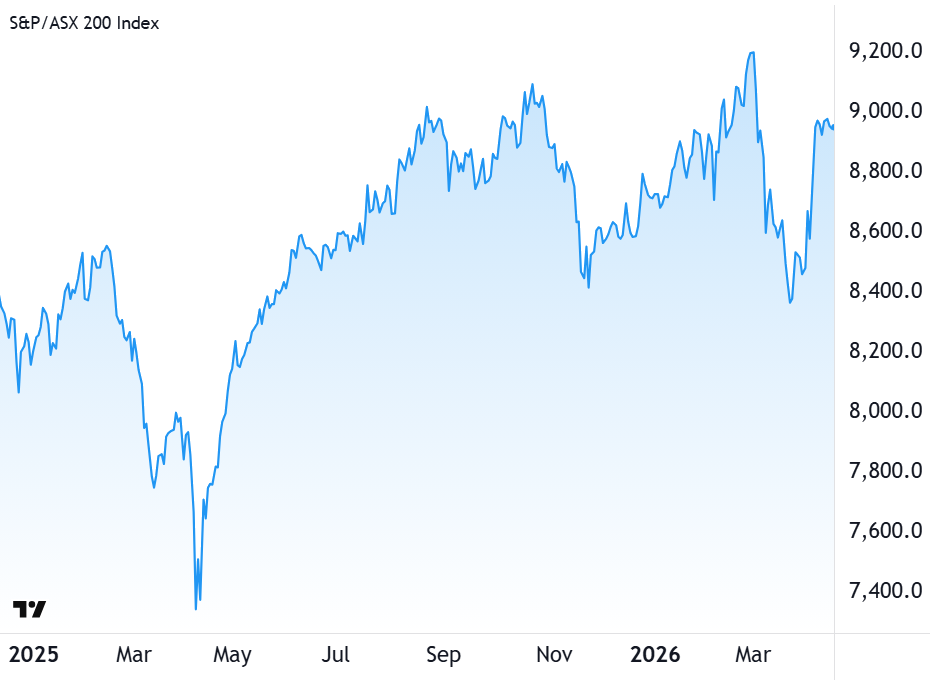
S&P/ASX 200 chart
For the S&P 500, the investment bank pegs the near-term technical support band at 6,400–6,500, representing approximately 20x next twelve months earnings. The upside target is 6,850 in the absence of a rapid conflict resolution. To put this value into perspective, the S&P 500 closed at 7109 on Monday 20 April. UBS is more constructive globally, maintaining an MSCI AC World Equity Index year-end target of 1,100 — its last close was 1,072. Slim pickings in both cases!
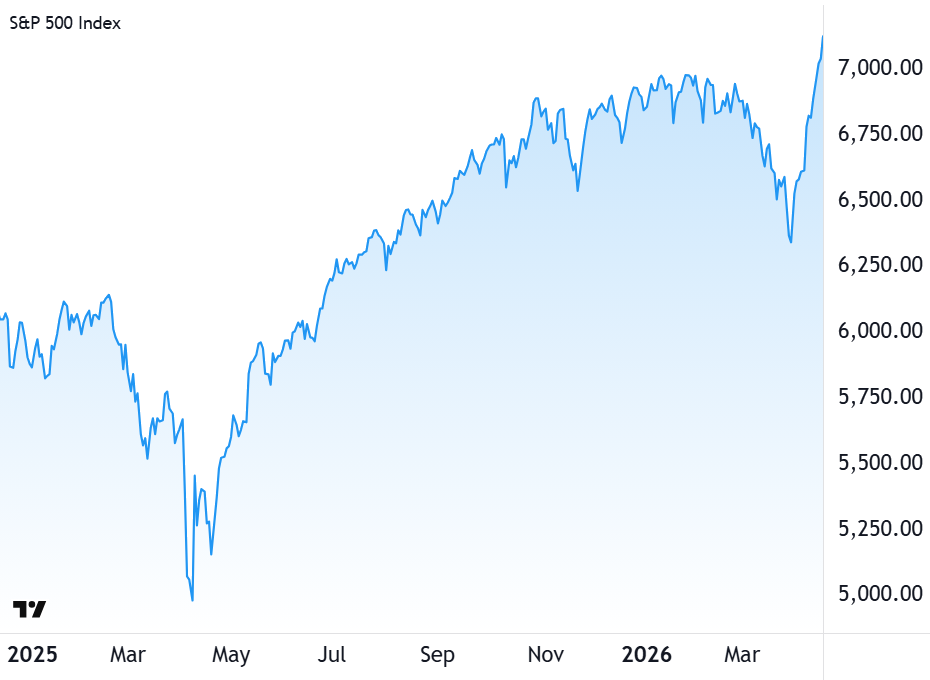
S&P 500 chart
On earnings
The earnings story for Australian equities is complicated. Morgan Stanley flags strong headline numbers — 13.9% growth pencilled in for FY26 and 9.4% for FY27 — but the quality is narrow, concentrated in Materials and highly vulnerable to commodity price swings.
The banks are a particular flashpoint heading into results season. A combination of RBA rate hikes, higher fuel costs, softening consumer sentiment, and deteriorating business conditions is pointing to loan growth deceleration. Morgan Stanley expects rising collective provision coverage across the major banks (following Westpac's lead at its 1H26 result), with individual provision charges also trending higher into FY27. Multiple compression is already underway.
On sectors and stocks
The message from Morgan Stanley's factor analysis is clear — quality, defensive value, and low volatility are the regime-appropriate exposures right now. Growth and traditional momentum strategies have been punished. Morgan Stanley's preferred Materials names include BHP Group (BHP), Iluka Resources (ILU), and Nickel Industries (NIC), while energy names Woodside Energy (WDS), Viva Energy (VEA), and Ampol (ALD) are flagged as potential candidates if the energy sector rally is sustained.
Macquarie prefers a list of non-consensus ideas for those willing to look through the near-term noise. On the upside, self-help execution stories dominate — Fortescue (FMG) on mine-plan optimisation and electrification, James Hardie Industries (JHX) on execution and the AZEK integration, NRW Holdings (NWH) on Fredon execution upside, Pinnacle Investment Management (PNI) on the PAM acquisition contribution, TPG Telecom (TPG) on cost-out delivery, APA Group (APA) for structural improvement in its long-term growth and risk profile.
On the downside, the investment bank flags ANZ Group (ANZ), Ingenia Communities (ING) on supply step-ups, and SEEK (SEK), facing both higher-rate headwinds and a structural AI challenge to its business model.
For those seeking safe-haven hedges, Morgan Stanley maintains a bullish gold price target of US$5,700/oz by the second half of 2026, though near-term risks from US dollar strength and any delay to Fed rate cuts deserve attention. Gold's role in a stagflation scenario — where growth falls and inflation persists — remains well-supported historically.
Conclusion: Chaos has its opportunities
Make no mistake — the situation remains deeply dynamic. The ceasefire is fragile, energy infrastructure damage is real and partially irreversible in the near term, and Australian businesses face their most challenging cost environment since the post-COVID inflation spike. The RBA is hiking, the budget is tightening, and earnings revisions are already drifting negative.
But markets rarely wait for certainty. The historical pattern of geopolitical shock, panic, and recovery is as reliable as any in investing — and stock prices usually rally well before the headlines vindicate a bullish approach.
There are structural pillars underpinning this cycle: AI-driven productivity gains, resilient US credit, and a Fed that can still cut if growth falters. The divergence between US and Australian stocks is arguably the most important portfolio insight right now: overweight the US, be selective domestically — with mining and energy stocks at the fore.
Yes, the chaos is real, but so are the opportunities. The savvy investor's edge — as ever — lies in knowing the difference.
This article draws on recent institutional research from Morgan Stanley Wealth Management Australia, UBS Global Research, Macquarie Equity Research and Shaw and Partners.
