ASX 200 bargain stocks: Why buying the dip is probably a bad idea
In October there were multiple massive one day share price falls. We looked at 458 past crashes to see whether buying the dip pays off.


Source: Chat GPT
Mentioned
KEY POINTS
- Big one-day falls among ASX 200 companies have become more common in recent years, with several suffering record or near-record drops.
- October brought another run of crashes, including NextDC and Zip, leaving investors to decide whether the sell-offs went too far.
- This article takes a look at data on hundreds of big one-day falls to show how often buying the dip has beaten simply holding the index.
For the past couple of years, Market Index analysts have noted that wild share price moves are becoming more common among top ASX 200 companies and beyond. A move of a few per cent in one of the market’s largest stocks was once considered a big day, and recent reporting seasons have seen several companies suffer record or near-record one-day falls.
October alone produced several such falls, in a year that has already had more than its fair share. The most eye-watering include Cochlear (COH), which lost more than 40% in April after cutting its profit guidance, Commonwealth Bank of Australia (CBA), which fell 10.4% in May on its worst day on record, and NextDC (NXT), which dropped 41.7% in October after cutting its FY27 guidance. When a well-known ASX 200 stock falls this far in a day, investors often ask themselves whether they should buy the dip.
This article looks at the biggest one-day falls of 2026 and what happened to ASX 200 stocks after similar falls in the past. The data covers 458 one-day falls of 10% or more by ASX 200 stocks over the last five years, including 70 falls of 20% or more. It shows how those stocks performed against the index over the following week, month, three months and year, and how often a stock that crashed went on to beat the market.
Big one day fallers in 2026
This year’s biggest one-day falls have spanned data centres, buy now, pay later, wealth management, shipbuilding and telecommunications, and some stocks have crashed more than once. The causes have ranged from guidance cuts and a fraud disclosure, to results that left investors unimpressed, and the shares have gone in different directions since:
NextDC (NXT) fell 41.7% on 21 October, wiping about $3 billion off its value, after cutting its FY27 earnings guidance by more than a third. Network operator Jemena had suspended works needed to lift power supply to its M3 Melbourne data centre, pushing billing for contracted capacity into FY28. The stock has recovered 17% to $6.27 a share but is still far off the $9.18 it was valued at before the crash.
Zip Co (ZIP), the digital financial services and consumer finance provider primarily known for its Buy Now, Pay Later (BNPL) services, has had a tumultuous year with three big one-day falls:
19 February (-34%): its half-year result missed ests on revenue and earnings, with bad debts rising and US growth slower than analysts expected.
20 August (-15%): FY26 profit hit a record, but bad debts rose again and FY27 guidance pointed to slower earnings growth.
23 October (-29.5%): its first-quarter update disclosed a US fraud incident that cost $10.1 million and disrupted customer acquisition, and the shares fell as much as 50.5% to $1.02 during the day.
In a note released on 23 October, UBS cut its price target to $4.05 from $4.40 but kept its Buy rating, saying the sell-off was an overreaction and that it expects momentum to improve in the second quarter. The stock has recovered 29% to $1.89 a share since its most recent crash, but is still far off the $2.82 a share it was valued at before its first crash in February.
AMP (AMP) fell more than 26% on 12 February, its largest one-day fall since 2003, wiping about $1.2 billion off its value. Its FY25 statutory net profit fell after costs from legacy class actions, remediation and simplifying the business, and it announced no share buyback despite holding surplus capital. Management also guided to a flat dividend and warned of tighter margins in its platforms business, in outgoing chief executive Alexis George’s final full-year result. The stock has recovered 66% to $2.17 a share, which is 24% higher than it was before the fall.
Austal (ASB) fell 22.8% on 13 February, wiping nearly $600 million off its value, after revealing its US business had double-counted incentives on a US Navy towing and salvage ship program. The error meant it had overstated its FY26 earnings, and it cut its full-year earnings guidance by almost a fifth. The stock has fallen another 10% to $4.34 a share, well short of the $6.31 it was valued at before the crash.
Tuas (TUA) fell 23% on its FY26 results in September, even though the result beat estimates, because it gave no update on the investigation into its spectrum use in Singapore. The stock has fallen another 22% to $1.39 a share, well short of the $2.33 it was valued at before the crash.
Does buying the dip pay off?
We examined every one-day fall of 10% or more by an S&P/ASX 200 over the last five years: 458 in total, including stocks since taken over or delisted. We tracked each over the following week, month, three months and year against the index, splitting the falls into two groups: 10% to under 20% (388 cases) and 20% or more (70 cases). We focus on median results, the return of the typical stock, because a small number of very large rebounds lifted the averages well above what most stocks actually did.
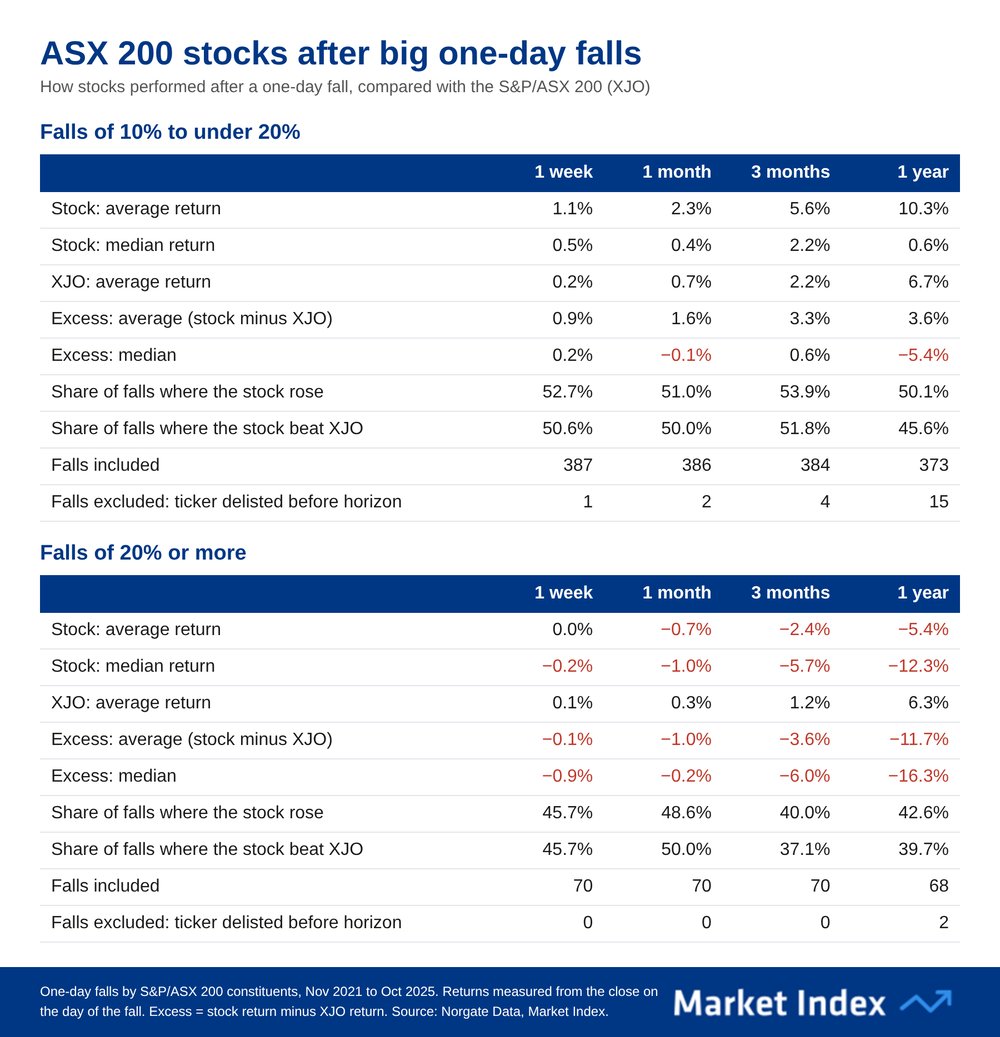
The first month tells you little: In both groups, roughly half the stocks beat the index over the following week and month, and median returns sat within 1% of zero. A big fall wasn’t reliably followed by either a quick bounce or further immediate selling.
Falls of 10–20% were a coin flip: After a year, the median stock was up just 0.6% and trailed the index by 5.4 percentage points. At every horizon, about half the stocks beat the index and half lagged it.
Falls of 20% or more typically kept falling: The median stock was down 5.7% after three months and 12.3% after a year, lagging the index by 16.3 points, with over 60% trailing over both periods.
You might get lucky: Had you bought every 10–20% faller in equal amounts, your portfolio would have earned the average return. That scenario actually beat the index by about 3.5 points over both three months and a year thanks to a minority of strong recoveries. Committing to buying every drop over 20% was a bad idea, though, with this group lagging over all look-forward periods and by a whopping 11.7 points over a year.
Outcomes vary enormously: For 10–20% falls, a quarter of stocks lost more than a third of their value over the following year, while another quarter gained more than 40%. For 20%-plus falls, a quarter lost more than half. Trying to trade big one-day drops usually meant a wild ride!
Conclusion
Is this a reliable investing strategy? The data shows that there were some bargains to be had, if one was able to pick (stumble?) across the big winners while consistently avoiding the losers.
Buying the dip in a single stock is at best a coin flip, and according to the data in our study, the bigger the fall, the worse the odds. Moderate falls were typically followed by flat performance that lagged the index, while really big falls typically saw marked underperformance.
One thing was clear, a suddenly lower share price didn’t necessarily equate to suddenly greater value – the fabled “quality on sale” opportunity as Mr Buffett put it. Indeed, over the entire sample universe, large one-day falls generally marked the start of a lasting de-rating rather than signalling a knee-jerk overreaction.