The most consistent ASX ETFs for growth and income in 2026
Most ETF investors chase returns. The smart ones manage risk. Here are the most consistent ASX ETFs for growth and income in 2026.


Source: Livewire
Mentioned
KEY POINTS
- Most ETF lists show you returns. Some show you yield. Almost none show you how those returns were achieved.
- The result? High yield often comes with equity-like risk, “Defensive” funds aren’t always defensive, and the best performers aren’t always the most consistent. If you’re choosing ETFs based on returns alone… you’re only seeing half the picture.
- The article delivers a clear framework for identifying ASX ETFs delivering the most consistent outcomes across growth, income and alternative assets.
Last year’s edition of Most Consistent ASX ETFs struck a chord. It became one of the most widely read pieces in the Listed Series – not because it chased the highest returns, but because it focused on something far more useful to investors: consistency.
Most ETF comparison tables encourage a simple, and often misleading, approach. Invariably, investors sort by average return, scan the top few names, and assume they’ve found the best options.
But returns alone tell only half the story. Professional investors know this well; they don’t just chase performance – they obsess over the risk taken to achieve it. After all, a strong return is meaningless if the path to get there involves volatility that doesn’t align with the investor’s risk tolerance.
This study takes a different approach. Instead of asking which ETFs delivered the highest returns, it asks which delivered the most consistent outcomes. To measure this, we use the Sortino Ratio – an industry-standard risk-adjusted return metric that focuses specifically on downside volatility. While widely used in professional portfolio analysis, it’s rarely considered in mainstream ETF comparison tools.
The result is a set of rankings designed for investors who value smoother, more reliable performance over time. Whether you’re building a core portfolio or refining an existing one, this is a list worth bookmarking – not just for today, but as a reference point for the year ahead.
Why Sortino Ratio?
Most ETF websites rank funds by simple returns. It’s easy to assume the top performers are the best options – but this ignores how those returns were achieved. A fund might deliver strong gains, but only after large drawdowns or sharp swings along the way. The Sortino Ratio improves on this by measuring return relative to downside risk – not just return on its own.
To understand why this matters, we need to define volatility. It’s often used interchangeably with risk, and investors are taught to avoid both. But not all volatility is bad. Investors don’t mind upside volatility because strong gains are welcome. The real risk is downside volatility: how far and how often an investment falls. That’s what can damage portfolios and investor behaviour.
The Sortino Ratio focuses specifically on this. It compares average returns to downside volatility only, ignoring the good volatility. This makes it a more practical measure of risk-adjusted performance than simple return metrics.
Sortino Ratio Pros:
Focuses on downside risk investors actually care about without penalising upside movements
Better reflects the real investor experience compared to simple return measures
Widely used in professional portfolio analysis
Sortino Ratio Cons:
A high Sortino Ratio doesn’t guarantee low overall risk – funds can still suffer large losses
Results can be influenced by the lookback period chosen, especially if it includes or excludes a major market shock
It is a relative measure, so it works best when comparing similar funds rather than very different strategies
For this study, the goal is consistency, so the Sortino Ratio is a strong fit. This is addressed by incorporating maximum drawdown into our results, which measures the maximum portfolio loss over the lookback period.
The remaining limitations are addressed through careful selection of the lookback period and by grouping ETFs into like-for-like sector categories.
Which ETFs to consider, and how far to look back
Selecting the right lookback period is one of the most important – and often overlooked – decisions in any performance study. Too long, and you shrink your usable universe. Too short, and you risk drawing conclusions from a narrow and potentially unrepresentative slice of market behaviour. For ASX ETFs, this trade-off is particularly acute given how rapidly the market has expanded over the past decade.
A traditional 10-year lookback would ordinarily be preferred, capturing multiple cycles and smoothing anomalies like the COVID-19 pandemic. However, applying that standard here would exclude a substantial portion of today’s ASX ETF universe because most didn’t exist a decade ago. The result would therefore favour older funds and reduce the study’s relevance.
At the other end of the spectrum, a shorter lookback – such as a clean five-year window beginning in 2021 – provides a broader and more contemporary sample. However, this period largely reflects the post-COVID recovery and subsequent bull market, and risks overstating consistency by excluding a genuine stress event.
The objective of this research is to identify consistency, not just performance. The Sortino Ratio is therefore used as the key metric, measuring returns relative to downside volatility. For this to be meaningful, the dataset must include periods of negative returns. Excluding major drawdowns reduces the effectiveness of the Sortino Ratio because it strips out the very downside variation it’s designed to assess.
Including the COVID-19 market shock of early 2020 introduces additional volatility, but it also provides a valuable real-world stress test. It was one of the sharpest drawdowns in modern market history, followed by a similarly rapid recovery. ETFs that maintained relatively stable performance through this period can reasonably be considered more robust than those assessed only in benign conditions.
While no lookback period is perfect, commencing in January 2020 offers a practical balance – preserving a broad ETF universe while incorporating a full market cycle. It ensures the analysis reflects not just how ETFs perform when conditions are favourable, but how consistently they deliver during periods of extreme downside volatility.
As for which ETFs to include, the approach is straightforward: all ASX ETFs with a continuous monthly return history from January 2020. This necessarily excludes newer funds, including some strong recent performers, but ensures every ETF in the study has been tested through the same market conditions.
The most consistent ASX ETFs – 2026 Edition
As a rule of thumb, a Sortino Ratio above 1.0 is considered strong, indicating returns have more than compensated for downside risk. A ratio between 0.5 and 1.0 is acceptable and typical for many equity investments, while anything below 0.5 suggests returns have been relatively weak given the level of downside volatility. Ultimately, the higher the ratio, the more consistent the investment has been in delivering returns without excessive losses.
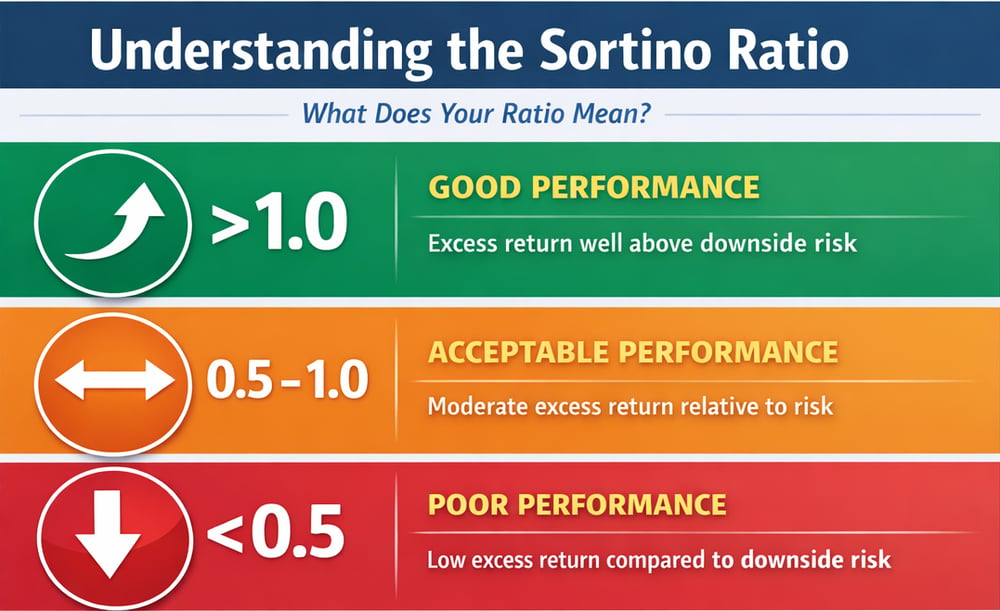
How to interpret the Sortino Ratio
To ensure fair comparisons, ETFs are grouped into distinct categories. Australian and Global funds are split into “Growth” and “Income” cohorts based on their stated investment mandates. Growth includes all equity ETFs without an explicit income mandate, covering broad market, sector, thematic, and capitalisation-based exposures, while Income captures ETFs targeting yield via dividends, fixed interest, or cash.
For the Income cohort, the inclusion of both equity income ETFs and traditional defensive exposures differs from last year, where equity-based income ETFs were grouped with Growth – as equities are typically labelled as growth assets. This change allows for a clearer comparison between equity-based income strategies and more traditional defensive exposures like fixed interest and cash, and whether the equity risk premium has been worth it.
A final category – Alternatives & Multi-Assets – includes commodities, currencies, cryptocurrencies, infrastructure, and inverse (BEAR) ETFs, offering additional insight into consistency across non-traditional asset classes.
Each Sortino Ratio is calculated using monthly returns, with distributions matched to ex-distribution dates. This ensures total return is captured accurately without distorting downside volatility. Given the relatively short lookback period, using monthly data rather than annual returns allows us to properly measure downside volatility within each year.
1. Most Consistent ASX Australian Growth ETFs
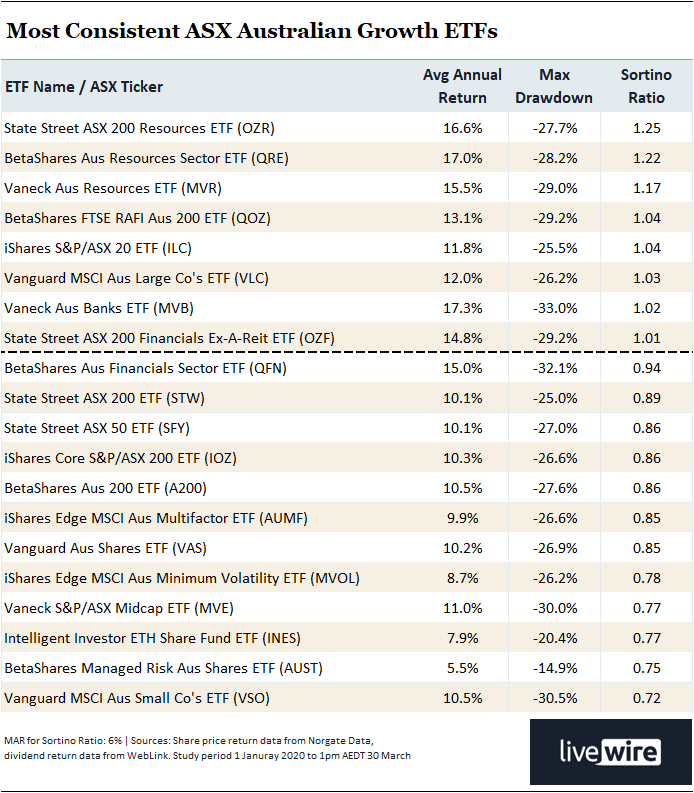
Top 20 most consistent ASX Australian Growth ETFs with history from January 1, 2020.
Reprising top spot in the Most Consistent ASX Australian Growth ETFs category is the State Street ASX 200 Resources ETF (OZR). Indeed, given the S&P/ASX 200 Resources Index (XJR) surged around 40% over the past 12 months – it’s no surprise that the top three spots are all resources-focused funds.
Strong gains combined with relatively low downside volatility pushed their Sortino Ratios materially higher, with BetaShares Aus Resources Sector ETF (QRE) and VanEck Aus Resources ETF (MVR) taking second and third spots.
Beyond the top three, the rest of the top ten has a distinctly large-cap and sector-tilted flavour. If we zoom out for a second and jump to places 7, 8 and 9 – each an ETF focused on banking and financial stocks – we can see why large capitalisation and benchmark index ETFs are prominent this year.
Big banks and major resources companies constitute the vast bulk of the S&P/ASX 20 (XTL) and the S&P/ASX 200 (XJO), therefore explaining the appearance of the iShares S&P/ASX 20 ETF (ILC) and the Vanguard MSCI Australian Large Companies ETF (VLC) in fifth and sixth places.
They’re followed by the VanEck Australian Banks ETF (MVB), the State Street ASX 200 Financials ex-A-REIT ETF (OZF) and the BetaShares Aus Financials Sector ETF (QFN), with the benchmark-focused SPDR S&P/ASX 200 ETF (STW) at number 10.
Importantly, most of the top ten sit in the “good” Sortino Ratio range (≥1.0), with the remainder in the upper end of “acceptable”. This highlights that recent market conditions have been generally supportive of both returns and stability, particularly in dominant sectors. A portfolio of big banks and big resources has been a clear winner this decade.
However, the addition of maximum drawdown in this year’s data provides a crucial layer of context. While many of these ETFs delivered strong and consistent returns, several still experienced peak-to-trough declines of 25–33% during the COVID-19 shock. This reinforces an important point: even “consistent” ETFs can suffer meaningful losses, and investors must be comfortable with a potentially similar level of downside risk during the next major crisis.
Finally, note that rankings by average annual return and Sortino Ratio do not always align. Higher-return ETFs may rank lower on Sortino Ratio if those returns came with greater downside volatility. The trade-off for investors is clear: pursue higher returns with more variability, or accept slightly lower returns in exchange for a smoother ride – which, for many, is the more desirable path.
2. Most Consistent ASX Australian Income ETFs
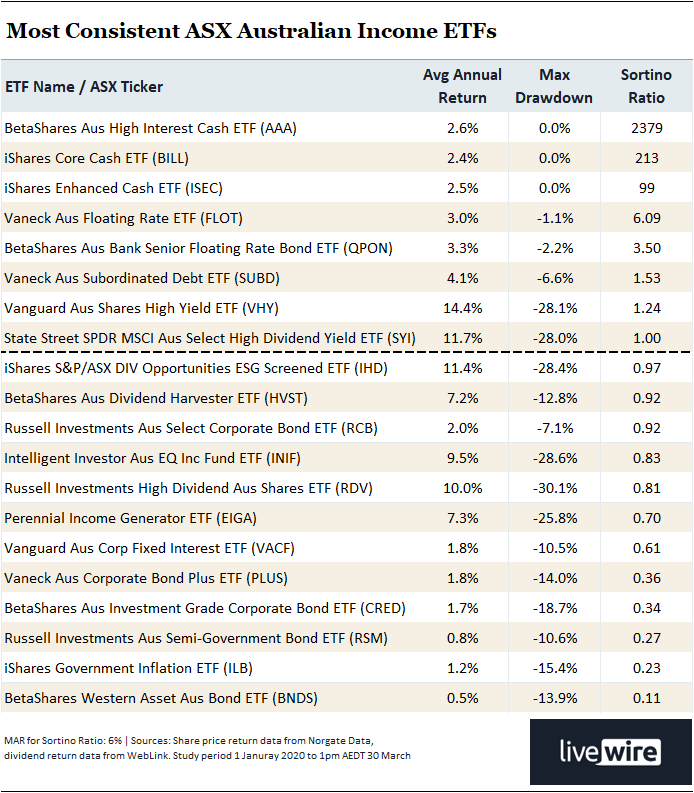
Top 20 most consistent ASX Australian Income ETFs with history from January 1, 2020.
Topping the Most Consistent ASX Australian Income ETFs this year are cash and floating rate strategies, led by the BetaShares Aus High Interest Cash ETF (AAA), the iShares Core Cash ETF (BILL) and the iShares Enhanced Cash ETF (ISEC). With minimal price volatility and steady income streams, these funds naturally produce exceptionally high Sortino Ratios – in some cases running into the hundreds or even thousands – albeit with modest absolute returns.
This highlights an important quirk of the Sortino Ratio. Because it measures return relative to downside volatility, assets with near-zero negative returns can generate extremely large values. In the case of cash ETFs, where monthly returns are consistently positive and drawdowns effectively non-existent, the denominator of the calculation becomes very small – mathematically inflating the ratio. While these figures may look extraordinary, they are entirely expected and simply reflect the extremely low-risk profile of these assets.
Just below them, floating rate and credit exposures such as the VanEck Aus Floating Rate ETF (FLOT) and the BetaShares Aus Bank Senior Floating Rate Bond ETF (QPON) continue the theme of low volatility income. Their slightly higher yields come with marginally higher drawdowns, but still deliver strong risk-adjusted outcomes relative to traditional equity income strategies.
The picture becomes more interesting further down the top ten, where equity-based income ETFs begin to appear. The Vanguard Australian Shares High Yield ETF (VHY), SPDR MSCI Australian Select High Dividend Yield ETF (SYI), and iShares S&P/ASX Dividend Opportunities ETF (IHD) all offer materially higher returns, but with drawdowns approaching 30% – broadly in line with the growth cohort.
It’s worth noting the mix of yield and capital growth here. Using VHY as a case study, it averaged a ~5% p.a. grossed-up dividend yield (i.e., taking into account franking credits) over the lookback period — a compelling outcome for income-focused investors. However, that income stream came with equity-like volatility, including drawdowns of a similar magnitude to the broader equities asset class.
This contrast goes to the heart of the study’s objective. Many income investors – particularly those funding retirement – are naturally drawn to the highest yields on offer, often without fully considering the risks required to achieve them. Equity income ETFs can look attractive on the surface, but their distributions come with equity-like volatility and the potential for meaningful drawdowns.
By comparison, cash and fixed income exposures offer lower yields, but far greater stability of both capital and income. This is where the concept of the equity risk premium comes in – the idea that investors should earn a higher return for taking on the additional risk of equities. The key question is whether that extra return has been sufficient to justify the added volatility.
For income-focused investors, that trade-off is critical. Chasing yield alone can lead to uncomfortable outcomes when markets fall, whereas a more balanced approach – considering both income and risk – may prove more sustainable over the long term.
3. Most Consistent ASX Global Growth ETFs
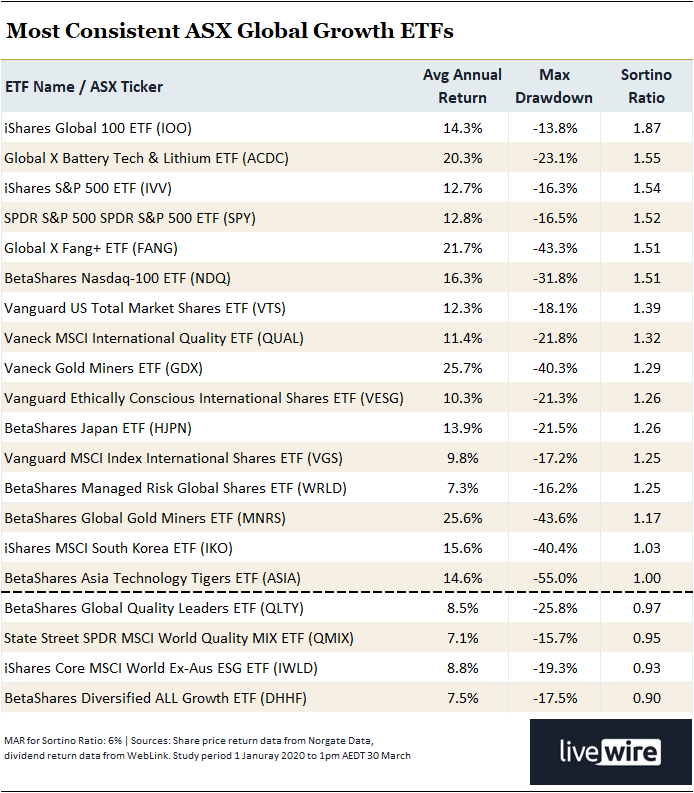
Top 20 most consistent ASX Global Growth ETFs with history from January 1, 2020.
Topping the Most Consistent ASX Global Growth ETFs this year are funds heavily exposed to large-cap US equities, led by the iShares Global 100 ETF (IOO), iShares S&P 500 ETF (IVV) and SPDR S&P 500 ETF (SPY). These funds capture the dominant technology and growth themes driven by the so-called “Magnificent Seven”, delivering strong returns with relatively contained downside volatility, particularly compared to the top Australian Growth options.
Just behind them, more concentrated growth exposures such as the ETFS FANG+ ETF (FANG) and BetaShares Nasdaq 100 ETF (NDQ) offer higher absolute returns but with greater downside volatility, resulting in slightly lower Sortino Ratios than the broader market ETFs. One notable outlier in the Top 5 is the Global X Battery Tech & Lithium ETF (ACDC), which has benefited from energy transition tailwinds, delivering both high returns and competitive risk-adjusted performance.
Further down the rankings, more diversified global exposures and equal-weight strategies begin to appear. With the exception of BetaShares Global Gold Miners ETF (MNRS), these tend to exhibit slightly lower returns and weaker Sortino Ratios. MNRS’ 25.6% average annual return looks impressive, leveraging the massive run-up in precious metals prices and the stocks aiming to produce them – but it came with a substantial 43.6% maximum drawdown.
As with the Australian Growth category, most of the top ten sit comfortably within the “good” Sortino Ratio range (≥1.0). However, the concentration of returns in a narrow group of global leaders is worth noting – recent consistency has, in many cases, been closely tied to exposure to a handful of dominant themes.
4. Most Consistent ASX Global Income ETFs
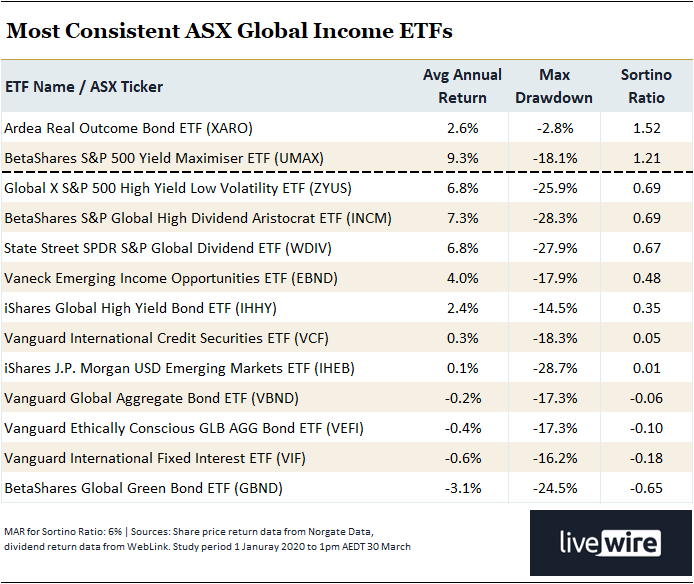
All ASX Global Income ETFs with history from January 1, 2020.
Topping the Most Consistent ASX Global Income ETFs this year is the Ardea Real Outcome Bond ETF (XARO), followed by the BetaShares S&P 500 Yield Maximiser ETF (UMAX). Unlike the Australian Income cohort, there are no true cash-style products here – instead, a mix of fixed income and equity income strategies. However, beyond XARO, the results deteriorate quickly, with most funds delivering Sortino Ratios below 0.7.
This raises an important question: what is the point of these funds? Many offer average annual returns roughly half that of the best growth ETFs, yet still experienced drawdowns of 20–30%. In other words, investors are taking on equity-like downside risk without being adequately compensated in returns – resulting in clearly inferior risk-adjusted outcomes.
For investors, the takeaway is simple. Not all income strategies are created equal – and in some cases, the pursuit of yield may come at the expense of both return and consistency.
5. Most Consistent ASX Alternative & Multi-Asset ETFs
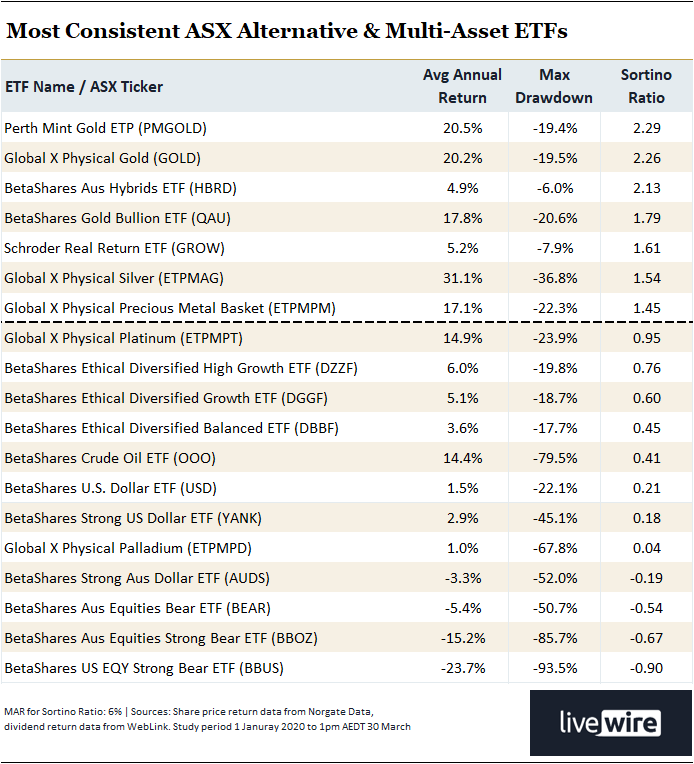
All ASX Alternative & Multi-Asset ETFs with history from January 1, 2020.
Topping the Most Consistent ASX Alternative & Multi-Asset ETFs this year are precious metals exposures, led by the Perth Mint Gold ETF (PMGOLD) and Global X Physical Gold (GOLD). These funds have benefited from the strong rally in gold, which rose from roughly US$1,500/oz to around US$2,400/oz during the lookback period. It was a relatively steady run despite encompassing a number of major global economic shocks – reinforcing gold’s role as a portfolio stabiliser during periods of uncertainty.
Just behind them, strategies such as the BetaShares Australian Hybrids ETF (HBRD) and Schroder Real Return ETF (GROW) offer a different form of consistency. Both use a mix of cash, bonds and equities to target steady income with a focus on downside risk. Their ~5% returns — roughly double cash and materially higher than traditional fixed interest — combined with modest maximum drawdowns, helped them achieve strong Sortino Ratios of 2.13 and 1.61, making them highly credible options for income- and stability-focused investors.
Further down the rankings, outcomes become far more dispersed. Currency, commodity and tactical strategies can deliver strong returns when investors are flocking to specific themes, but often with significantly larger drawdowns.
Conclusions: The most consistent ASX ETFs – Top Picks

The most consistent ASX ETFs with history from January 1, 2020 — Top Picks
Across the category winners, the trade-offs between return, drawdown and consistency are clear:
Growth leaders such as State Street ASX 200 Resources ETF (OZR) and iShares Global 100 ETF (IOO) delivered strong double-digit returns, and solid Sortino Ratios in the 1.2–1.9 range. However, IOO’s maximum drawdown of just 13.8% was roughly half of OZR’s 27.7%.
Defensive income exposures such as BetaShares Aus High Interest Cash ETF (AAA) and VanEck Aus Floating Rate ETF (FLOT) produced far higher Sortino Ratios due to minimal downside volatility, but with much lower returns. Vanguard Australian Shares High Yield ETF (VHY) delivered a solid dividend yield, average annual return, and a Sortino Ratio that would have placed it in second spot in the Australian Growth cohort — but with an equity-like maximum drawdown. Global Income ETFs struggled to justify their place, offering lower returns than growth alternatives while still experiencing meaningful drawdowns.
Among alternatives and multi-asset options, Perth Mint Gold (PMGOLD) stands out as a rare asset delivering both strong growth-only returns and relatively contained drawdowns, while diversified strategies such as BetaShares Australian Hybrids ETF (HBRD) and Schroder Real Return ETF (GROW) achieved high Sortino Ratios through steady income and comparatively low volatility.
The most consistent ASX ETFs for growth and income are hopefully far clearer now. This article provides a menu of options where you can make an educated decision on what's best for your portfolio when it comes to return and the risk likely required to achieve it.
For some, that will mean accepting equity-like volatility in pursuit of higher returns. For others, it will mean prioritising stability and capital preservation. Either way, with this data in hand, the choice is yours.
This article first appeared on Livewire on Wednesday 1 April 2026.
