PME, WTC, TNE — the SaaSpocalypse decoded: what killed ASX growth stocks, and what comes next
AI didn't kill ASX SaaS stocks – it killed the multiples investors would pay for them. That distinction could make or break your portfolio.


Source: Livewire Markets
Mentioned
KEY POINTS
- Growth stocks have always traded on a leap of faith, with investors paying for earnings that are typically years away. History shows this faith can be as volatile as growth stocks’ earnings themselves.
- New AI coding tools have triggered a sharp sell-off across ASX growth and technology stocks, causing some like PME, WTC and TNE to lose as much as 60% of their value – even as earnings continued to rise.
- This article examines 10 of the ASX’s top SaaS stocks to identify the critical warning signs investors could have heeded to avoid heavy losses, as well as how to spot if a turnaround is underway.
Growth stocks are a bet on the future. When an investor buys a growth stock trading at 80 times earnings, they aren’t paying for what that business earns today – they’re paying for what it may earn in three, five, or ten years. Consider that a well-established company with stable earnings might only trade at 10 times earnings. This difference represents the market's leap of faith that the growth stock will deliver on its promise, and like all acts of faith, it’s subject to revision.
The dot-com collapse of 2000 didn't eliminate the technology stocks whose share prices collapsed – many of the underlying companies survived, rebuilt, and thrived. What changed was the extraordinary multiples investors had been prepared to pay for growth stocks’ earnings. A similar shock occurred in 2022 when growth stocks were hit by the “Fed lift-off”, as rising interest rates made the distant future worth less in today's money.
The mechanism is deceptively simple, but its understanding is the foundation of good growth stock investing:
If a company earns 100 cents per share and the market values it at 80 times earnings, the stock trades at A$80.
If sentiment shifts – for whatever reason – and the market will only pay 40 times for the same earnings, the stock is worth A$40.
It’s that simple. The business didn't change. Its quality didn't change. Its earnings growth outlook didn't change. What changed was what investors were willing to tolerate paying for it. The leap of faith halved, and so did the price.
This article explains the mechanics of multiple compression, investigates its impact on ten ASX growth stocks, and identifies the warning signs investors should monitor to help them spot if a major turnaround in sentiment is underway.
How AI changed the outlook for ASX growth stocks
From the second half of 2025, a shift arrived for ASX growth and technology stocks that hit with unusual force. New AI coding tools that materially reduce software development costs have triggered a major rethink about the threat posed to incumbent businesses from startups or via price-cutting that reduces margins. Also, consider that if building software is cheaper and easier, customers might simply choose to do it themselves.
What followed was a sell-off, finance journalists have coined the SaaSpocalypse – a rout that, at its worst, wiped as much as 60% from the share prices of stocks whose underlying earnings had barely changed. (SaaS stands for software as a service – a popular and lucrative business model that has been adopted by most major global software developers).
The critical question for investors must now be: is there a genuine structural deterioration in the earnings outlook for these companies or is this merely a sentiment-driven re-rating that will likely reset? I.e., can the multiples investors are willing to pay drift back towards previous norms, allowing for substantial subsequent share price growth? Let’s consider each item.
What is a P/E multiple, and why can it compress?
A price-to-earnings multiple, or P/E Ratio, is simply the price investors will pay for each dollar of a company's annual earnings. A stock trading at 40 times earnings means the share price is equal to 40 years' worth of future earnings in the company. Of course, plenty can happen in 40 years, so this seems like an extraordinary leap of faith.
The critical factor in understanding why growth investors may be comfortable with such a bet is they are betting the business compounds and grows its earnings over that horizon. The faster the business grows its earnings, the quicker the investor will recoup their initial investment. This is the allure of growth stocks.
Multiple compression occurs when investor appetite for long payback periods associated with growth stocks contracts. A longer payback period implies greater risk that something unforeseen can occur (and vice versa: shorter implies less risky). Think Nokia and BlackBerry here. Shareholders in both companies on June 28, 2007, likely expected their respective company’s shares to be still trading today (the first generation iPhone was released on June 29, 2007).
A growth stock’s earnings don’t need to fall – simply that investors become less willing to wait for their eventual payback. As perceived risks to earnings rise, and in the present-day’s case, arguably complete business models are being challenged by AI, multiples can contract fast. When they do, this means share prices must fall just as quickly.
%20share%20price%20chart%205%20May%202026.png)
WiseTech Global share price chart
WiseTech Global is a particularly striking illustration of this dynamic in the current cycle. Between October 2025 and April 2026, consensus earnings estimates for WTC's FY27 financial year rose 28.9%, yet its share price more than halved. WTC’s forward multiple collapsed from 86.2 times to 33.9 times, partly due to that improvement in earnings expectations, but the rest is plain multiple compression.
The ASX SaaSpocalypse experience
To quantify the extent to which the ASX SaaS sector selloff was driven by multiple compression rather than earnings deterioration, I compared consensus forward earnings per share (EPS) estimates and P/E Ratios for a ten-stock ASX SaaS cohort between October 2025 and April 30 this year – i.e., the cusp of the sector’s broad selloff to present. The cohort comprises:
Life360 (360)
Car Group (CAR)
Hub24 (HUB)
IDP Education (IEL)
Pro Medicus (PME)
REA Group (REA)
Seek (SEK)
Technology One (TNE)
WiseTech Global (WTC)
Xero (XRO)
The analysis has two components. The first is straightforward: how much did forward P/E multiples compress over the period, and how much did each company’s EPS estimates and share price change, as these comprise the “P” and the “E” in the P/E Ratio equation.
The second goes deeper – to address the reasonable objection that near-term earnings stability doesn't rule out that investors slashed their longer-dated growth expectations. To test this, we calculated the implied EPS growth trajectory for each stock at both dates: the 1-year implied growth rate between the +1yr and +2yr forward consensus EPS estimates. Think of it as the slope of the forward earnings curve – how steeply the "E" is expected to rise. A steepening slope should support a higher multiple between the two snapshots, while a flattening slope provides rational grounds for compression.
Together, these two measures allow us to ask the question directly: how much of each stock's P/E compression can be explained by a change in the "E" – whether in absolute terms or in its forward growth trajectory – and how much reflects a change in what investors were prepared to pay for a given "E"? The latter is sentiment: price change for no other reason but investors’ tastes changed.
The findings are presented in full in the table below.
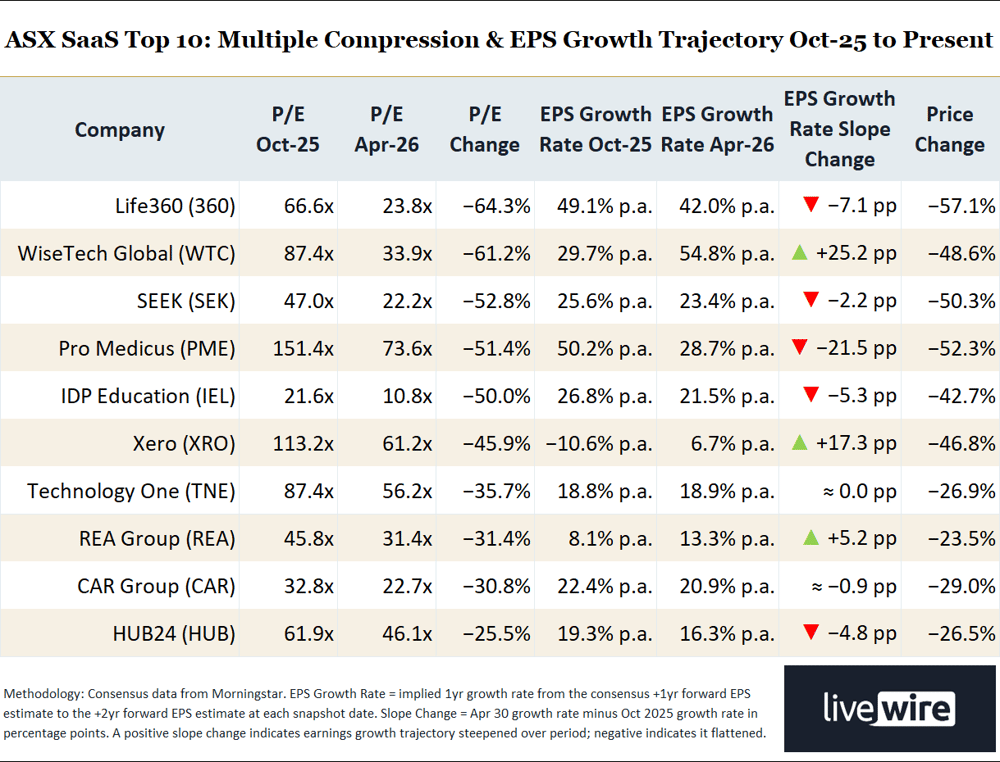
ASX SaaS Top 10: Multiple Compression & EPS Growth Trajectory October 2025 to Present
The multiple compression picture is stark – across all ten stocks, P/E Ratios contracted between 26% and 64%. The "P" fell sharply in every case. The question is whether the "E" outlook gave investors reason to pay less.
For six stocks – WTC, XRO, REA, SEK, CAR, and TNE – the answer is largely no. Near-term EPS estimates were stable or revised upward, and the forward earnings growth trajectory either held or steepened. WTC is the most striking case: its implied EPS growth rate accelerated from 29.7% to 54.8% per annum – the "E" improved materially at every point on the curve – yet the stock fell 48.6%. XRO's growth trajectory swung from a near-term earnings miss of −10.6% back to a healthy +6.7%. REA's growth rate improved. In each of these cases, the "E" didn't justify investors paying less. The "P" simply fell because sentiment changed.
Four of the stocks tell a more complicated story. 360, IEL and HUB saw modest trajectory softening. For these names, a rational investor had some grounds for reassessing the "P" they were prepared to pay for a slower-growing "E" – even if the full extent of the price decline remains difficult to justify on this basis alone.
PME's EPS growth trajectory flattened from 50.2% to 28.7% per annum – a decline of 21.5 percentage points – making it the sharpest illustration of how a high P/E Ratio can leave a stock vulnerable to an outsized price response if "E" disappoints even modestly. At 151.4 times forward earnings in October, PME’s "P" was arguably priced for perfection.
Two caveats apply to the analysis as a whole. First, the forward period window rolls forward between snapshot dates for all stocks – the October and April estimates therefore span adjacent but not identical financial years, which limits strict like-for-like comparability. The rationale for this choice is: growth investors don't think in specific financial years – they think in trajectories. The directional signal in earnings matters more than strict period alignment.
Second, a compressed near-term growth trajectory doesn't necessarily reflect permanent deterioration – it may capture a transitional earnings period. The data should be read as indicative rather than definitive. That said, the direction of the evidence is consistent: for the majority of this cohort, the "E" held up. The "P" did not – and the gap between the two is where sentiment lives – the proverbial leap of faith!
Warning signs – how to spot multiple compression before it hits
The case studies above demonstrate that a focus on fundamentals alone is unlikely to protect oneself from a major multiple compression event like the one experienced in ASX and global SaaS stocks this year – for the most part, the experts made few adjustments to their near-term earnings forecasts. Instead, the data shows sentiment toward ASX SaaS stocks changed, not expectations about their earnings. Still, there are some key fundamental factors investors can watch out for to guard against a potential major multiple compression event.
Fundamental warning signs of multiple compression
1. The multiple already prices perfection. A stock trading at 80 times or more forward earnings has little margin for error – or swings in risk appetite. Any question about competitive durability, earnings, or sector sentiment could see its multiple compress sharply.
2. The moat is single-layered. New AI tools are directly attacking engineering complexity. Where a company's competitive advantage rests primarily on engineering complexity, the re-rating risk may be structural rather than sentiment-driven. The businesses that held up best through the SaaSpocalypse were those with multi-layered attribute moats: proprietary data, regulatory integration, network effects, and workflow embeddedness. A single-attribute moat is considerably more exposed.
3. The sector narrative is shifting. Investor focus shifts from company operations and upcoming earnings to “what protects this business – is it still viable?" That shift happened early this year in both the institutional research, which we regularly bring to you here at Livewire, but also in the rise of the SaaSpocalypse term across the financial media. By the time such terms enter the financial media, multiple compression is typically already well underway.
4. Hyperscalers have arrived. Where Amazon, Google, or Microsoft are actively competing in the same space, the incumbent's defensibility timeline is materially shorter. These businesses have the infrastructure, distribution, and AI capabilities to rapidly build and scale competing products, often bundling them into broader cloud offerings at marginal cost.
5. Falling share price. This is the most actionable warning sign – and the most dangerous to ignore. The market looks forward, not backward, and prices risk in real time. By the time earnings downgrades or cool nicknames like SaaSpocalypse appear, share prices have tumbled.
Technical analysis warning signs of multiple compression
This is a nice segue from Point 5 above. Technical analysis operates independently of fundamental valuation. Deteriorating trend, price action and volume factors often occur in advance of the worst portion of a major sector meltdown. In every case in the ASX SaaS cohort studied here, the technicals flashed major warning signals potentially worse declines were on the way.
My ChartWatch ASX Scans series, which I run daily on Livewire’s sister site Market Index, tracks trend status across the ASX on a systematic basis. The table below summarises how many times each stock in the ASX SaaS cohort in this study was flagged as being in a downtrend since July 31 – arguably well before the term SaaSpocalypse became commonplace.
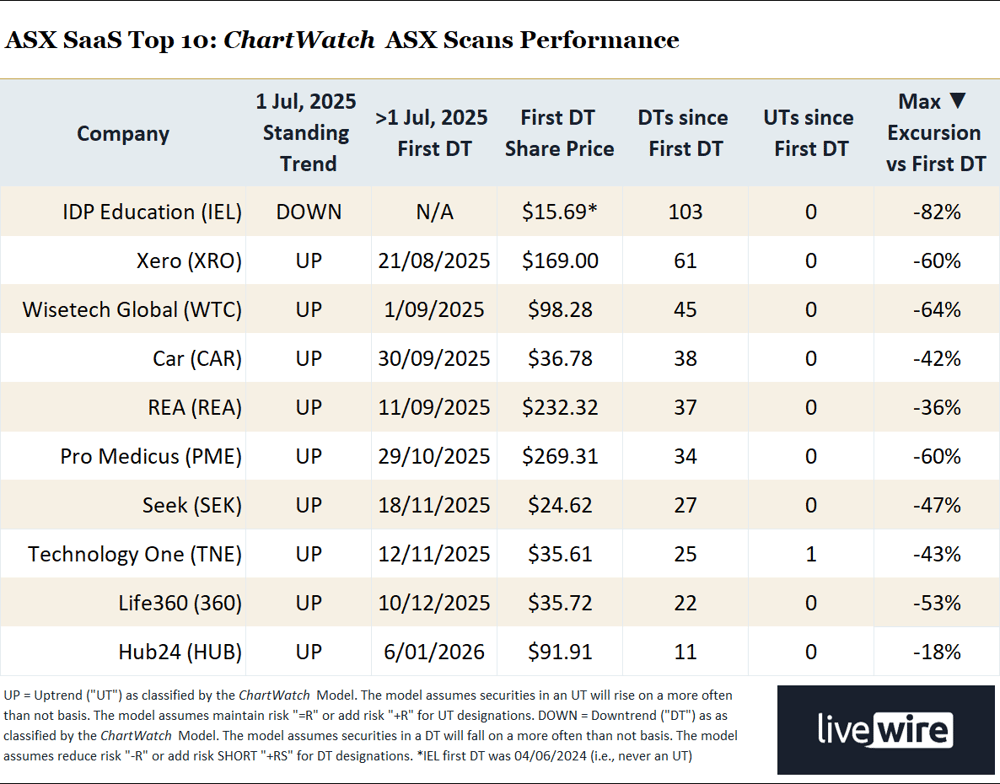
ASX ChartWatch Scans Downtrends List appearances for Top 10 ASX SaaS cohort since July 1, 2025, as at 6 May, 2026 (You can learn more about my technical analysis model by watching videos of any of the regular educational webinars I run at lunchtime each Wednesday)
The ChartWatch ASX Scans Performance table above tells its own story — and it's a compelling one. Operating entirely on share price and volume data, the ChartWatch model flagged a downtrend in nine of the ten cohort stocks between September and December 2025, with IEL already in a prevailing downtrend.
Indeed, those other nine stocks were generally in strong uptrends heading into the back-half of 2025. Yet from those first downtrend designations, share price declines across the cohort ranged from 18% for HUB to a sobering 82% for IEL, with an average decline of 51%. The ChartWatch Model continued identifying downtrends steadily across the entire cohort, and investors could have used any one of those designations as a catalyst to manage their risk exposure to the stock in question.
Only one stock in the cohort has returned to an uptrend — TNE, which has recorded a single uptrend designation since its first downtrend flag in November. Only 360, WTC, SEK and HUB have appeared in the downtrend scans in the last ten trading sessions, with the rest generally avoiding the list since early April.
The major technical analysis warning signs the ChartWatch Model uses to flag a that stock may be on the verge of a major share price decline are:
1. Short and long-term trends transition to down. The price falls below the short-term trend ribbon, the short-term trend ribbon turns amber, then pink, and it begins to impede upward price action. The same process occurs at the long-term trend ribbon – after which it can be said a long-term downtrend has begun.
2. Price action transitions from rising peaks and rising troughs to falling peaks and falling troughs. Uptrends are characterised by fear of missing out (FOMO), holding on for more (HOFU), and buying the dip (BTD). Rising peaks and rising troughs demonstrates investors are piling in and holding on for more at new highs, as well as aggressively buying the dip. When these traits are no longer evident, it’s a reliable signal that supply has taken over the price setting process.
3. Candlesticks transition from white-bodied and or upward pointing shadows to black-bodied and or downward pointing shadows. White-bodied candles demonstrate pervasive excess demand, while downward pointing shadows are consistent with healthy BTD activity. When black-bodied candles appear in greater frequency, it’s a reliable signal that supply has taken over the price setting process. Upward pointing shadows are consistent with sell the rally (STR).
4. Volume increases into a blowoff top, then subsides during the sell down. In a healthy uptrend, one would expect to see strong trends, price action and candles – with little volume. When volume arrives, particularly if coinciding with strong supply candles, it is a reliable sign that the balance between demand and supply has shifted. If the price breaks lower, particularly on low volume, it is a reliable sign that buying motivation and interaction has dried up.
%20chart%205%20May,%202026.png)
Xero (XRO) chart 5 May, 2026 showing typical trend change characteristics. Source: Market Index
What the brokers say – SaaS stocks to buy now
The data identifies where multiple compression occurred. The harder question – whether the present multiples represent fair value, an overshoot, or the beginning of a more structural de-rating – requires a view on the durability of each business's competitive position. Institutional research across multiple houses suggests the selling was indiscriminate to some degree and that value can be found in the ASX SaaS sector. Below is a summary of the 10 study stocks’ present broker consensus ratings and 12-month price targets as per Market Index broker consensus data.
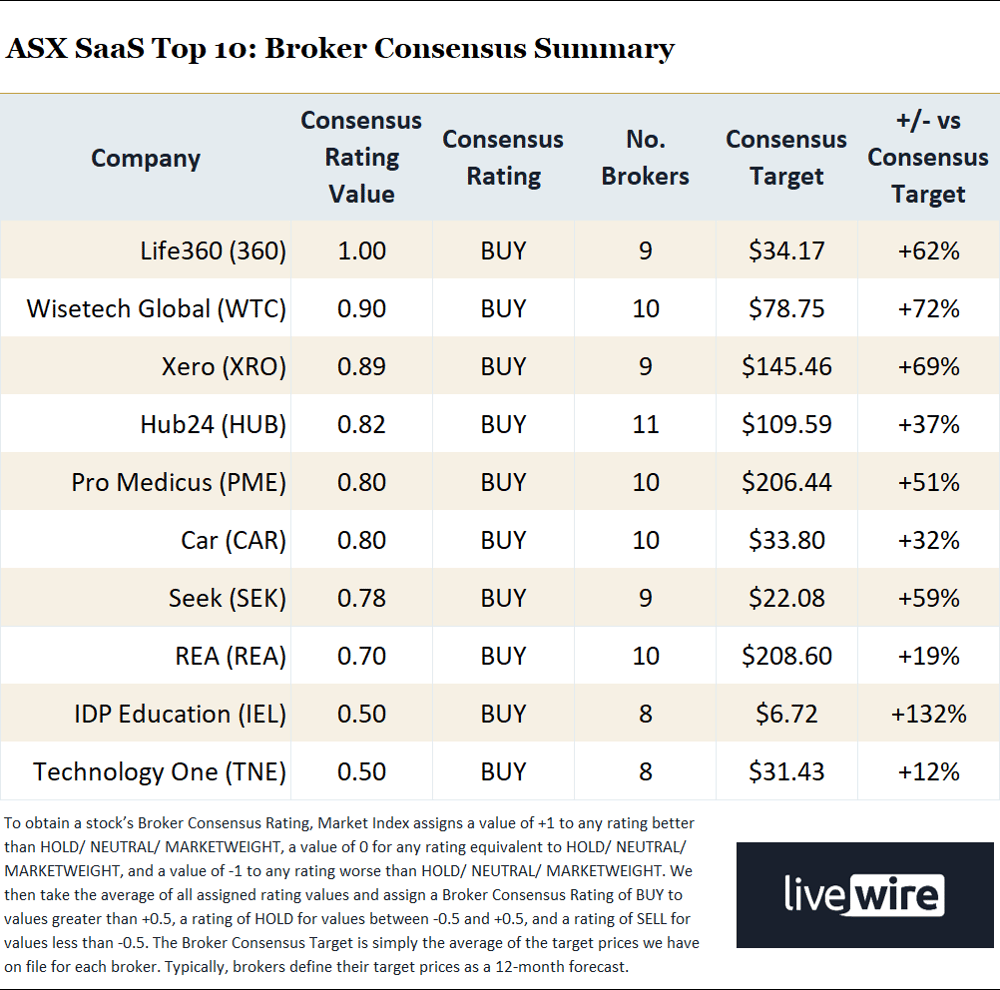
Market Index Broker Consensus data for the Top 10 ASX SaaS cohort as at 6 May, 2026
Ten out of ten consensus buy ratings for the top ten ASX SaaS stocks, with all but IEL and TNE able to be described as strong buys. Consensus price target upside across the cohort ranges from a still respectable 12% for TNE, to a substantial 132% for IEL. Consider though, that with all broker consensus snapshots, and like anything else in markets: the data is subject to revision. Broker views, and their ratings and targets will change as the fundamentals change.
Conclusion: SaaSpocalypse Now (and what to do next time)
The data suggests that multiple compression – not earnings deterioration – drove the overwhelming majority of price declines in the ten-stock ASX SaaS cohort since the start of the downturn around October last year. In all but one case, consensus earnings estimates for the anchor forward period were positive, and in all but two, they showed double-digit earnings growth. Growth rate trajectories were generally positive-to-flat at worst.
Yet the market's response to the AI threat was real, substantially negative, and could not be explained by fundamentals alone.
For growth investors, the lesson is that the price of a growth stock depends as much on what investors will tolerate paying for its future earnings as on the earnings themselves. A business can improve its outlook and still see its share price crunched if the multiple the market assigns to those earnings contracts sharply enough. Sentiment is as much a part of the growth stock valuation story as any discounted cash flow model.
The question now is whether the current reset multiples represent a more rational long-term baseline or an overshoot that will partially correct as clarity about AI's actual impact emerges. The broker consensus data presented above offers one answer — all ten stocks in our ASX SaaS cohort presently carry a consensus buy rating and price target upside of greater than 10%.
As for the technical picture, most stocks in the cohort have improved at least somewhat since the sector’s February nadir. However, only TNE is so far showing a confident return to a long-term uptrend. On that part, at least, I hope to provide you with ongoing insights in ChartWatch ASX Scans and each lunchtime on Wednesday.
This article was first published on Livewire on Thursday 7 May, 2026. It draws on institutional research from Morgan Stanley, Macquarie Research and Ord Minnett produced in April and May 2026. Consensus data sourced from Morningstar. Broker consensus data sourced from our own Market Index Broker Consensus page.
