
Evening Wrap: ASX 200 logs another solid gain on takeover rumours in health and industrials, gold stocks slump again
Tue 23 Apr 24, 5:48pm (AEST)

Copper – it’s one of the world’s most fundamental metals and often viewed as a leading indicator for global economic health.
Australia has the world’s second largest copper resources
Australia is ranked 6th for copper production, and produced approximately $12 billion in exports in 2021-22.
In this article, we will provide a concise guide for copper for investors, including:
A brief overview of the commodity
Supply and demand dynamics
Factors that influence its price
Key ASX-listed copper companies
The big problem with copper miner cash flows
Use case: The main industries that use copper are Equipment (31%) and Building Construction (30%) followed by Infrastructure (15%), Transport (12%), and Industrial (12%), according to the Office of the Chief Economist. Copper is also 100% recyclable and nearly 80% of copper produced is still in use.
Copper prices: The world’s primary market for copper trading is the London Metal Exchange (LME) – which provides benchmark pricing and widely used as a reference in the global copper market. Copper spot prices refer to the metal in its most basic form, typically copper cathode, a high-purity form of copper that’s used as raw material in the production of downstream products such as wire, tubing, and sheet metal.
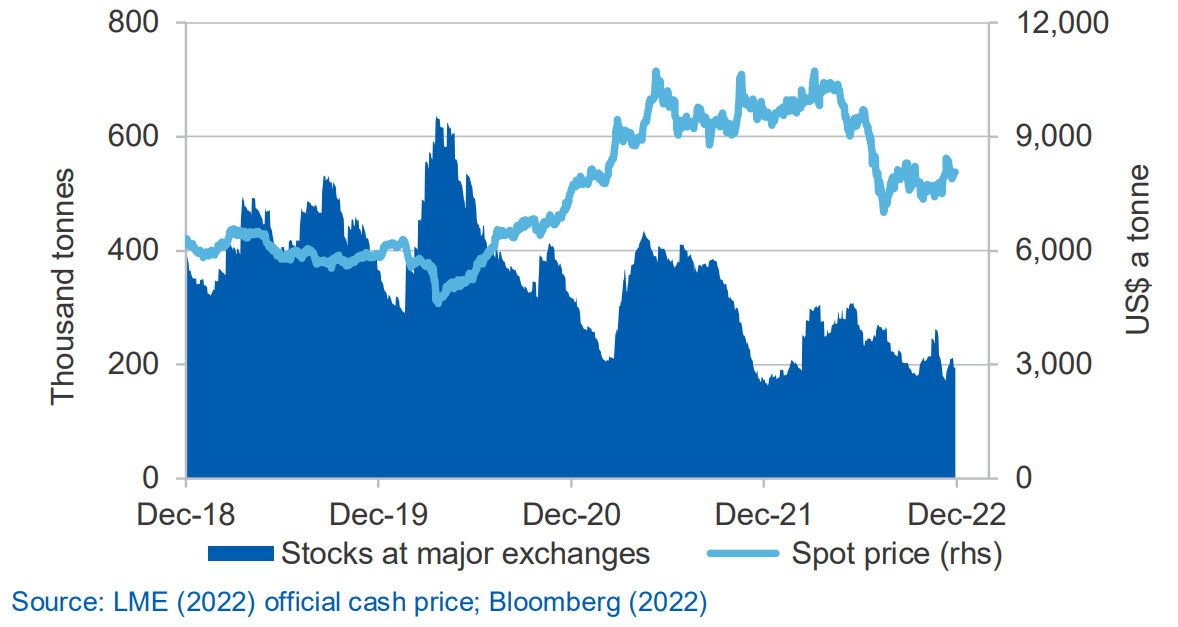
Copper inventory: The LME is the most well-known organisation for the storage of copper. It operates a network of approved warehouses located around the world where copper and other metals are stored on behalf of traders, investors, and industrial users. As of early February 2023, the LME’s copper inventory had fallen to 65,100 tonnes, the lowest level since November 2005.
Understanding grades: Copper (Cu) grades of more than 1.0% are commonly used as a threshold for high-grade copper deposits. Grades between 0.5% or higher are considered to be economically viable for mining. However, this also needs to take into account other factors such as location, accessibility and the cost of extraction.
All about China: China uses about 50% of the world’s copper supply, followed by Japan (7%), the US (5%), South Korea (5%), and Germany (5%).
Supplied by the Americas: North, South, and Central America collectively hosts 15 of the 20 largest copper mines in the world. Chile is the top copper producer with approximately 27% of global copper production. This is followed by Peru (10%), China (8%), Congo (8%), the United States (6%) and Australia (4%).
Supply shocks: There have been several instances where Chile has faced major supply issues which led to significant increases in copper prices. Some recent examples include:
A labour dispute at the Escondida Mine, which is the world’s largest copper mine, began in February 2017 and lasted 44 days. The strike involved 2,500 workers and the mine produced around 120,000 fewer metric tonnes of copper during the strike period.
Protests erupted in Chile in October and November 2019, which halted several copper mines due to safety concerns and supply chain disruptions. During this time, Chilean copper output fell approximately 5% compared to the same period in 2018.
The Australian Government’s commodity forecaster, the Office of the Chief Economist, expects copper consumption to increase by 2.9% in 2023 and by another 3.0% in 2024, reaching over 27 million tonnes.
From a supply perspective, global mined output is expected to grow by 7.5% in 2023 before moderating to 3.7% in 2024, where output will sit at more than 24 million tonnes. Most of this growth is expected to come from Chile and Peru.
Prices are expected to ease in 2023 to US$8,100 a tonne (US$3.68/lb) and US$7,900 a tonne (US$3.58/lb) in 2024.
Copper is the backbone of global decarbonisation efforts and demand is projected to increase from 23.9 million tonnes in 2020 to 28.6 million tonnes by 2030, under a ‘Stated Policies Scenario’, according to the International Energy Agency.
Under its ‘Sustainable Development Scenario’, global copper demand is projected to increase 25.1% to 29.9 million tonnes by 2030.
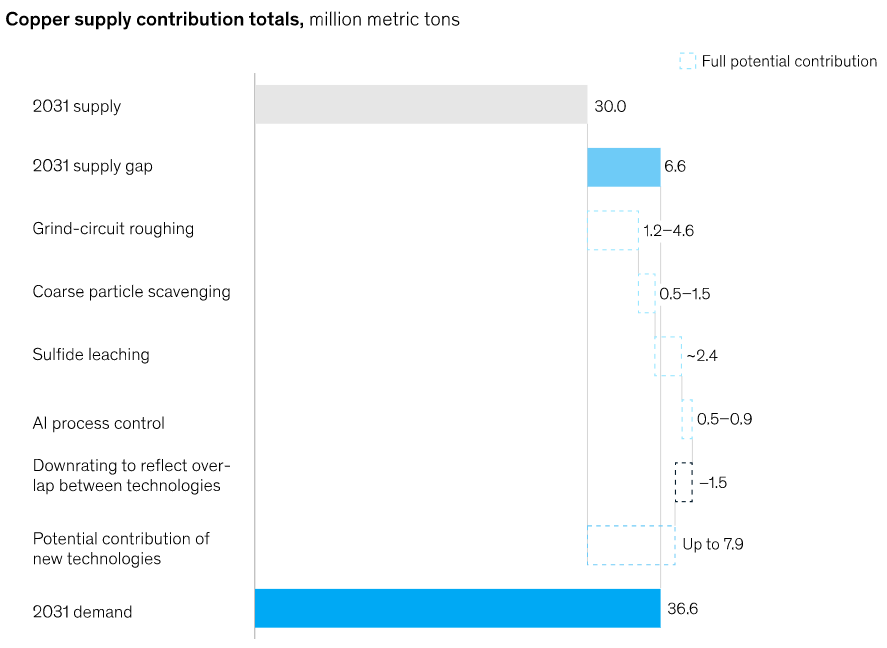
McKinsey has a far more optimistic outlook with projections for annual copper demand to reach 36.6 million metric tonnes by 2031. But what’s more interesting is its supply projections, which estimate that current project restarts, certain or probable projects and recycled production only offer a pathway to 30.1 million tonnes. So there’s a 6.5 million tonne (an additional 20%) shortfall.
“However, the adoption of new emergent technologies—including coarse particle recovery, sulphide leaching, and process optimization with machine learning—has the potential to close a significant portion of that gap,” the report says.
But ultimately suggests that technological levers should be recognised alongside new mine development as part of the solution.
There’s not a whole lot to look at when it comes to the ASX-listed copper scene – especially after BHP’s (ASX: BHP) acquisition of Oz Minerals (ASX: OZL).
Notable pure-play names include:
Large caps:
Small-mid caps:
Notable explorers:
Cannindah Resources (ASX: CAE)
Austral Resources (ASX: AR1)
Cyprium Metals (ASX: CYM)
Caravel Minerals (ASX: CVV)
Normally, we'd talk about the fundamentals and outlook for each company, but there's a far more pressing issue.
Megatrends like decarbonisation and electric vehicles seem to place copper and copper miners on a one way street to higher prices. Unfortunately, it’s not that simple. At least in the near term.
Copper is proving to be one of the most capital intensive resource industries on the ASX and that’s taking a massive toll on company cash flows – both big and small.
Take Oz Minerals FY22 results for example:
Operating cash flow: $647.6 million
Investing cash flow: -$951.0 million
Financing cash flow: $224.5 million
Net cash flow: -$78.9 million
The bulk of cash flow was attributable to brownfield expansion projects, mine development, and sustaining capital expenditures including:
Carapatenna plant, equipment and mine development costs: $358.3 million.
Prominent Hill development: $235.5 million.
West Musgrave costs: $165.8 million.
If BHP is paying $9.6 billion for Oz Minerals … When exactly is it going to make its money back?
The same goes for Sandfire Resources, which acquired the Spain-based MATSA operation in February 2022 for US$1.865 billion.
Sandfire’s flagship DeGrussa operations generated $68.6 million in earnings for the half-year ended 31 December 2022. This would be offset by a $34.3 million loss from MATSA and an additional $36.2 million associated with various exploration and employee benefit expenses.
Sandfire failed to make operating cash flow for the first-half of FY23, with outflows of $6.8 million. When combined with financing and investing activities, cash outflows ballooned to $188.4 million.
29Metals is very much the same, with its 2023 guidance pointing to another year of weak cash flow.The midpoint of all its mining, processing and capital costs add up to approximately $850 million. When other costs such as leases, interest and debt repayments are added on, the figure is likely to be north of $1 billion.
At the midpoint, the 2023 guidance points to unchanged year-on-year copper and zinc production but gold and silver production is expected to be lower. From an earnings perspective, the company generated $720.7 million in revenue in 2022.
There’s no denying that copper is a critical component to many current and future facing industries and is expected to remain in high demand for the foreseeable future – I’m sure we’ve all seen the diagrams about how an EV contains up to 80 kg of copper while an onshore wind turbine can contain anywhere between 4-7 tonnes.
However, it would be foolish to neglect the current cash crunch that’s faced by most established ASX-listed copper producers. This also makes me wonder:
If near-term cash flows continue to be negative, does this put a capital raising back on the cards?
What if the company has to opt for debt and what do interest rate repayments look like in this kind of environment?
If something like the US 6 month Treasury bond is yielding 5.0%, why would I want exposure to a copper miner that doesn’t even produce positive cash flow, at least in the near-term?
If financials are so underwhelming, does this mean copper prices must head north in the medium-to-long term to incentivise more supply?
If copper prices and miner fundamentals remain underwhelming, does this not exacerbate the long-term supply crunch (re McKinsey’s supply gap as well as current LME warehouse levels)
Well, that was a rather thought provoking way to finish the copper feature. We covered nickel last year and iron ore a few weeks ago, and I’d be keen to hear what you guys want next (link to poll).
Get the latest news and insights direct to your inbox