Diversification is dead! Why half your ASX shares crashed (plus best EOFY tax-loss sellers)
The gap between the best and worst ASX 200 sectors just hit an all-time high. This financial year, diversification meant devastation!


Source: Shutterstock
Mentioned
KEY POINTS
- As investors, we’re told to pin our faith in diversification – spreading our capital across enough sectors in the hope that the winners more than pay for the losers.
- This year, owning a diversified spread of ASX stocks almost invariably caused investors to hold several blue-chip wipeouts, with the spread between the best and worst S&P/ASX 200 sector the widest since the index began in 2000.
- In this article, I break down which sectors won and lost and why, flag the stocks most exposed to tax-loss selling, and set out a simple way to tell when momentum has turned against stocks or a sector.
Diversification: don't put all your eggs in one basket – spread your money across enough sectors and the winners will cushion the losers, smoothing your returns.
It’s the bedrock of modern portfolio theory and the first principle drummed into every new investor. But the past 12 months have torn this investing adage to shreds. The 2025–26 financial year (FY) has produced the widest gap between the ASX's best and worst sectors of any 12-month period since the S&P/ASX 200 (XJO) index began in 2000.
If you spread your money evenly across the market this year, your returns weren’t so much smoothed – they resembled a barbell: several of your holdings got absolutely smashed, several shot the lights out, and most were mediocre.
The market average return of roughly 8% over the last 12 months belied a massive flaw in most investors’ Buy, Hold & Pray (i.e., the ‘BHP Technique’) methodology. Most ended up holding losers all the way down, ignoring their devastating impact, because a few other strong performers balanced them out.
Going forward, the problem is this: in an increasingly algorithm-driven market where enormous rallies in one sector are bankrolled by selling in another, we are likely to see further massive disconnects like the one we just experienced. The old diversification is essential gospel needs a desperate rethink.
In this article, I break down which sectors won and lost over the year and why, flag the stocks most exposed to tax-loss selling, and set out a simple way to tell when momentum has turned against a stock or sector you own.
The widest sector dispersion on record
The performance of Australian shares over the last 12 months is shaping up as one of the most dispersed in the 26-year history of the XJO and its sector indices. The table below shows the performance of each of the 11 S&P/ASX 200 sector indices, plus the S&P/ASX All Ordinaries Gold Sub-Index (XGD).
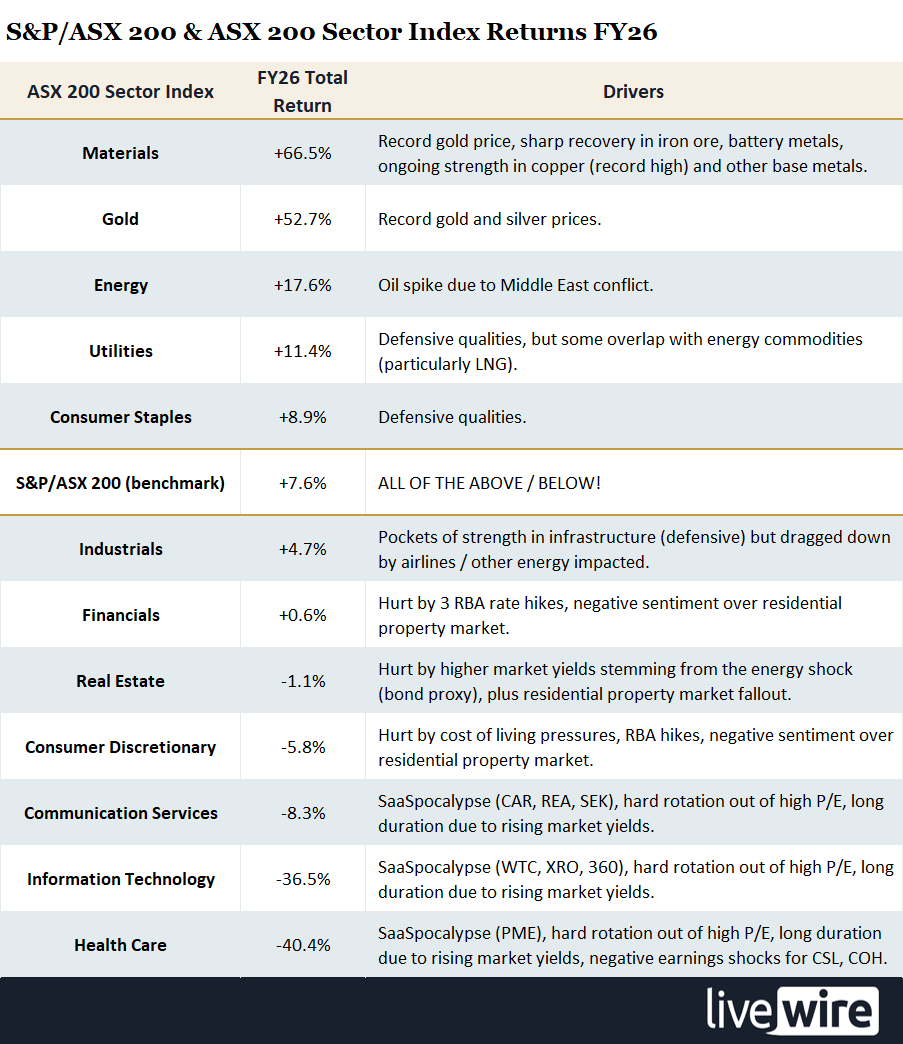
Note: ASX 200 Total Return Indices were used in FY26 Total Return calculations (equals capital gains/losses plus dividends). Values correct as at 18 June 2026.
It’s important to note that all the sector performance data in this article is based on total shareholder return, i.e., capital return plus dividends. The range in performance between the best and worst performing ASX sectors of 106.9% (i.e., Materials’ +66.5% versus Health Care’s -40.4%) is the largest since the XJO’s implementation in 2000.
See below a table of quarterly performance data for the cohort since 2000. Here we can look within each year’s return, gauging each quarter’s 12-month rolling performance – and back through some of the most volatile markets in history.
.png)
Note: ASX sector indices were seeded in 2000, so a handful of early readings distorted by that start date were excluded. The current 12-month figure includes an in-progress June 2026 quarter performance to 18 June.
Each of the quarters above coincided with a major market volatility event:
The dot-com unwind in 2001, when tech stocks crashed, triggered three of the top 10 widest quarterly sector performance ranges (2nd, 3rd, and 6th).
The COVID crash/rally is responsible for 4th, 5th, and 8th spots.
The December quarter of 2022 was likely due to the impacts of Russia’s invasion of Ukraine in Q1 2022 (7th).
March 2003 (9th) was a major bear market low as global economies grappled with the dot-com bubble burst (Australian GDP shrank by 0.6% in the December quarter of 2001).
If we classify the dot-com tech wipeout and the COVID crash as once-in-a-generation dislocations, the past year’s massive disconnect stands alone. Note also that the March quarter of this year took out 10th spot – it has been a substantially dispersed six months.
If we consider the standard deviation of sector performances each quarter over the lookback period, i.e., the dispersion in their returns, we can see that this year’s June quarter’s max-range title is similarly backed by substantial internal volatility. Again, we can see massive dispersions in the sector returns of quarters associated with the dot-com crash and subsequent fallout (1st, 2nd, 6th, 9th and 10th), COVID (3rd), Russia-Ukraine (8th) – while the GFC, a period of tremendous upheaval, makes its debut (7th). But there they are again – at 4th and 5th – the first two quarters of this year.
.png)
Note: Early readings in the sample were excluded. The current 12-month figure includes an in-progress June 2026 quarter performance to 18 June.
The rise of the machines: why sector dispersion may grow
Markets have always rotated – capital migrating from last year's darlings to this year's, from defensives to cyclicals and back as the cycle turns. What looks different now is the sheer violence of it, and I suspect automated trading is a big part of the reason.
A growing share of daily turnover is now driven by systematic, rules-based strategies – ultimately executed by algorithms. The London School of Economics noted in September 2025 that an estimated 60–70% of all trades are now conducted algorithmically – the vast majority of buying and selling decided by machines, not humans.
Much of the flow is passive, simply tracking indices. Those indices, weighted by market capitalisation, are prone to domination by a concentrated group of stocks riding a single theme – the Magnificent 7, and more recently AI innovation and disruption.
Much of the global passive flow is being channelled through exchange-traded funds (ETFs), which let investors buy a whole theme in a single trade – e.g., 'Buy gold', or 'Buy AI' to name two recent dominant ideas. In its latest Global Market Intelligence note, the largest market maker in US equities, Citadel Securities, reported that ETFs accounted for roughly 31% of average daily trading volume year-to-date, well above the 10-year average of about 27%. Citadel believes that as more activity flows through passive vehicles like ETFs, reallocation decisions are increasingly likely to move prices.
As far as quantitative flows go, much of this is pegged to momentum-based strategies – funds that, by design, buy what's rising and sell-short what's falling. When those flows dominate, they become self-reinforcing: money pours into the handful of sectors already winning, funded by selling whatever isn't. The result is precisely the kind of market we've had over the last 12 months – a few enormous rallies bankrolled by capitulation elsewhere.
This is known as the momentum trade, and analysts at UBS think it’s going to continue to dominate markets. In a global strategy note released earlier this month, the investment bank made the case for sticking with the most prominent momentum trade right now – AI innovation and infrastructure stocks. UBS argued the trade is underpinned by genuine earnings growth, with record retail participation acting as one of the "powerful amplifiers" of prevailing trends.
Closer to home, UBS strategist Richard Schellbach set out the rotation likely to drive ASX flows over the next 12 months, noting his clear preference for miners and industrial stocks over sectors “most exposed to the challenges that the domestic housing/consumer space faces”, like banks, REITs and consumer discretionary.
2026’s Dogs: EOFY tax-loss selling candidates
Momentum or not, this year there seems to be an unusually large cohort of stocks nursing losses – and for many, massive ones: falls of 60, 70, even 80% aren't uncommon. That sets up this EOFY as a particularly spicy tax-loss selling season.
Tax-loss selling involves crystallising losses on losing investments to offset capital gains banked elsewhere during the financial year. Because Australia's financial year ends on 30 June, this selling tends to cluster in the weeks leading up to this date. It also means that after today (24 June), there are only four more days to finalise tax-loss transactions.
The practical impacts of tax-loss selling for Aussie investors are threefold:
Stocks that have underperformed over the past 12 months tend to be singled out for further selling into 30 June – they're the obvious candidates for crystallising a loss.
But booking that loss isn't as simple as selling and buying straight back in – the ATO's wash-sale rules can deny it where you reacquire the same, or a substantially identical, holding without genuinely changing your economic position.
In some cases, weakness caused by aggressive tax-loss selling reverses just as quickly, with those same names potentially bouncing from 1 July.
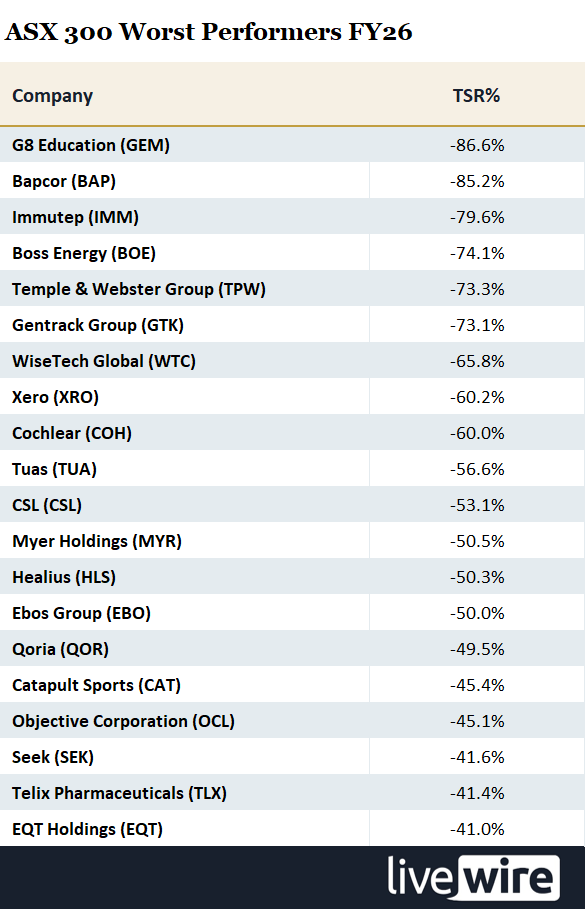
Note: TSR% includes capital return plus grossed-up dividend yield. 18 June record date.
The table above shows the 20-worst performing stocks in the ASX 300 since the start of FY26 by total shareholder return (TSR%). TSR% includes capital return plus grossed-up dividends (i.e. dividends increased by their franking percentage to account for the tax benefits to an Australian resident shareholder).
Given that 131 ASX 300 stocks have lost value so far in FY26 (i.e., 43.7%), there were always going to be plenty of stocks in consideration for tax-loss selling this month. There are several blue-chip names in this list, most likely cornerstones of your portfolio, or at least they were. The question for many investors will be: do I try to extract some benefit from one of these losses via a tax offset, or do I hold on in hope of a recovery?
While you’re mulling that one, consider that the pressure to crystallise tax losses this year could be sharper than usual. The Government's proposed CGT changes require capital gains under the old 50% discount system to be locked before 30 June 2027. Whilst still a year away, this looming expiry date might energise this year's loss-harvesting as there are so many clunkers to choose from. Investors may look to take advantage of their capital losses now if they think their losing stocks are going to bounce before 1 July next year.
How to spot when momentum turns
If momentum is the force driving this market, then the risk every investor faces is being caught in a stock when momentum fades. Here’s the fickle thing about momentum: the same flows that lifted a stock can reverse its course just as fast. Take this chart of WiseTech Global (WTC), for example. It started FY26 with decent upside momentum, but once the trends changed, it was a slippery slope from there.
%20chart%20with%20ChartWatch%20Model%20trend%20ribbons,%2023%20June%202026.png)
WiseTech Global (WTC) chart with ChartWatch Model trend ribbons
The good news is you don't need a complex system to determine when momentum in a stock is changing. Each day in my ChartWatch ASX Scans series on Livewire’s sister site Market Index, I publish a list of the ASX’s strongest momentum-based uptrends and downtrends. The lists are free for all to use, and they flagged some of FY26's biggest winners and losers.
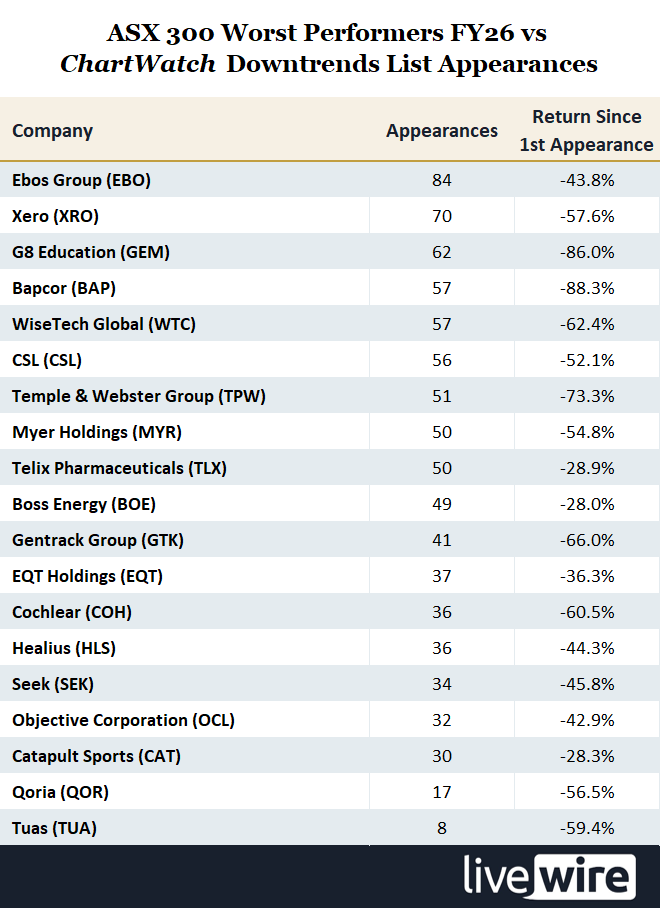
ChartWatch ASX Scans is published Monday to Friday at 9am AEST each trading day. It contains two watchlists, one containing ASX stocks exhibiting the strongest upside momentum, and one containing ASX stocks exhibiting the strongest downside momentum. The methodology for identifying up/down momentum is discussed here, or you can watch any of these videos to learn more about my trend following model. Note: IMM did not appear in the Downtrends List prior to its most recent decline that earned it a place in the “ASX 300 Worst Performers FY26” table.
Conclusion
One sector returned 66% this year while another lost 40%, and the index in between gained less than 8%. That isn’t a market that rewarded spreading your bets evenly – it’s one that downright punished it!
One of the oldest sayings in investing is, “Cut your losses and let your winners run”. This year, that advice would have left you in a very strong position to capture a good chunk of the gains from the best stocks, while avoiding most of the damage inflicted by the worst stocks.
If algorithmic flows keep growing their share of the market – and there's little sign they won't – then this year's dichotomous performance may not be an aberration. It means that investors may need to find new strategies for managing risk in addition to diversification. One thing is for sure, though: investors who ignore momentum shifts do so at their own peril.
References: Sector performance and dispersion data: Norgate Data, to 18 June 2026 (original analysis by the author). This article also draws on UBS Global Research (Global Strategy, 15 June 2026; Australian Equity Strategy, 16 June 2026), the London School of Economics ("AI and the stock market: are algorithmic trades creating new risks?", 23 September 2025) and Citadel Securities (Global Market Intelligence, 2026); and on the Australian Taxation Office (Taxation Ruling TR 2008/1, "wash sale" arrangements) and the proposed capital gains tax changes in the 2026–27 Federal Budget.
This article first appeared on Livewire on Wednesday 24 June 2026.
