ChartWatch Markets: The bull market in US stocks lives on! Plus, it's official, the new lithium bull market has begun!
Technical analysis of the most important global stock indices, commodities, bonds, FX, and crypto impacting your ASX portfolio each day.


Source: Shutterstock
Mentioned
KEY POINTS
- The Nasdaq Composite, and to be fair, the broader bull market in US stocks, faced a critical test on Friday night – absolute make or break stuff!!! Fortunately for most investors, the Nasdaq passed its test in an emphatic fashion.
- Lithium prices have been in the doldrums for over 3 years – experiencing arguably one of the most devasting bear markets in the history of markets at a 90% decline from top to bottom. But, finally, things are looking up again!
- We investigate the trends, price action, and candles for the Nasdaq Composite and Lithium Carbonate Futures markets to help investors determine whether they’re more likely to rise or fall.
In today's edition of ChartWatch Markets, we'll be covering the technicals for:
Nasdaq Composite
Lithium Carbonate Futures (Benchmark month, back-adjusted) GFEX
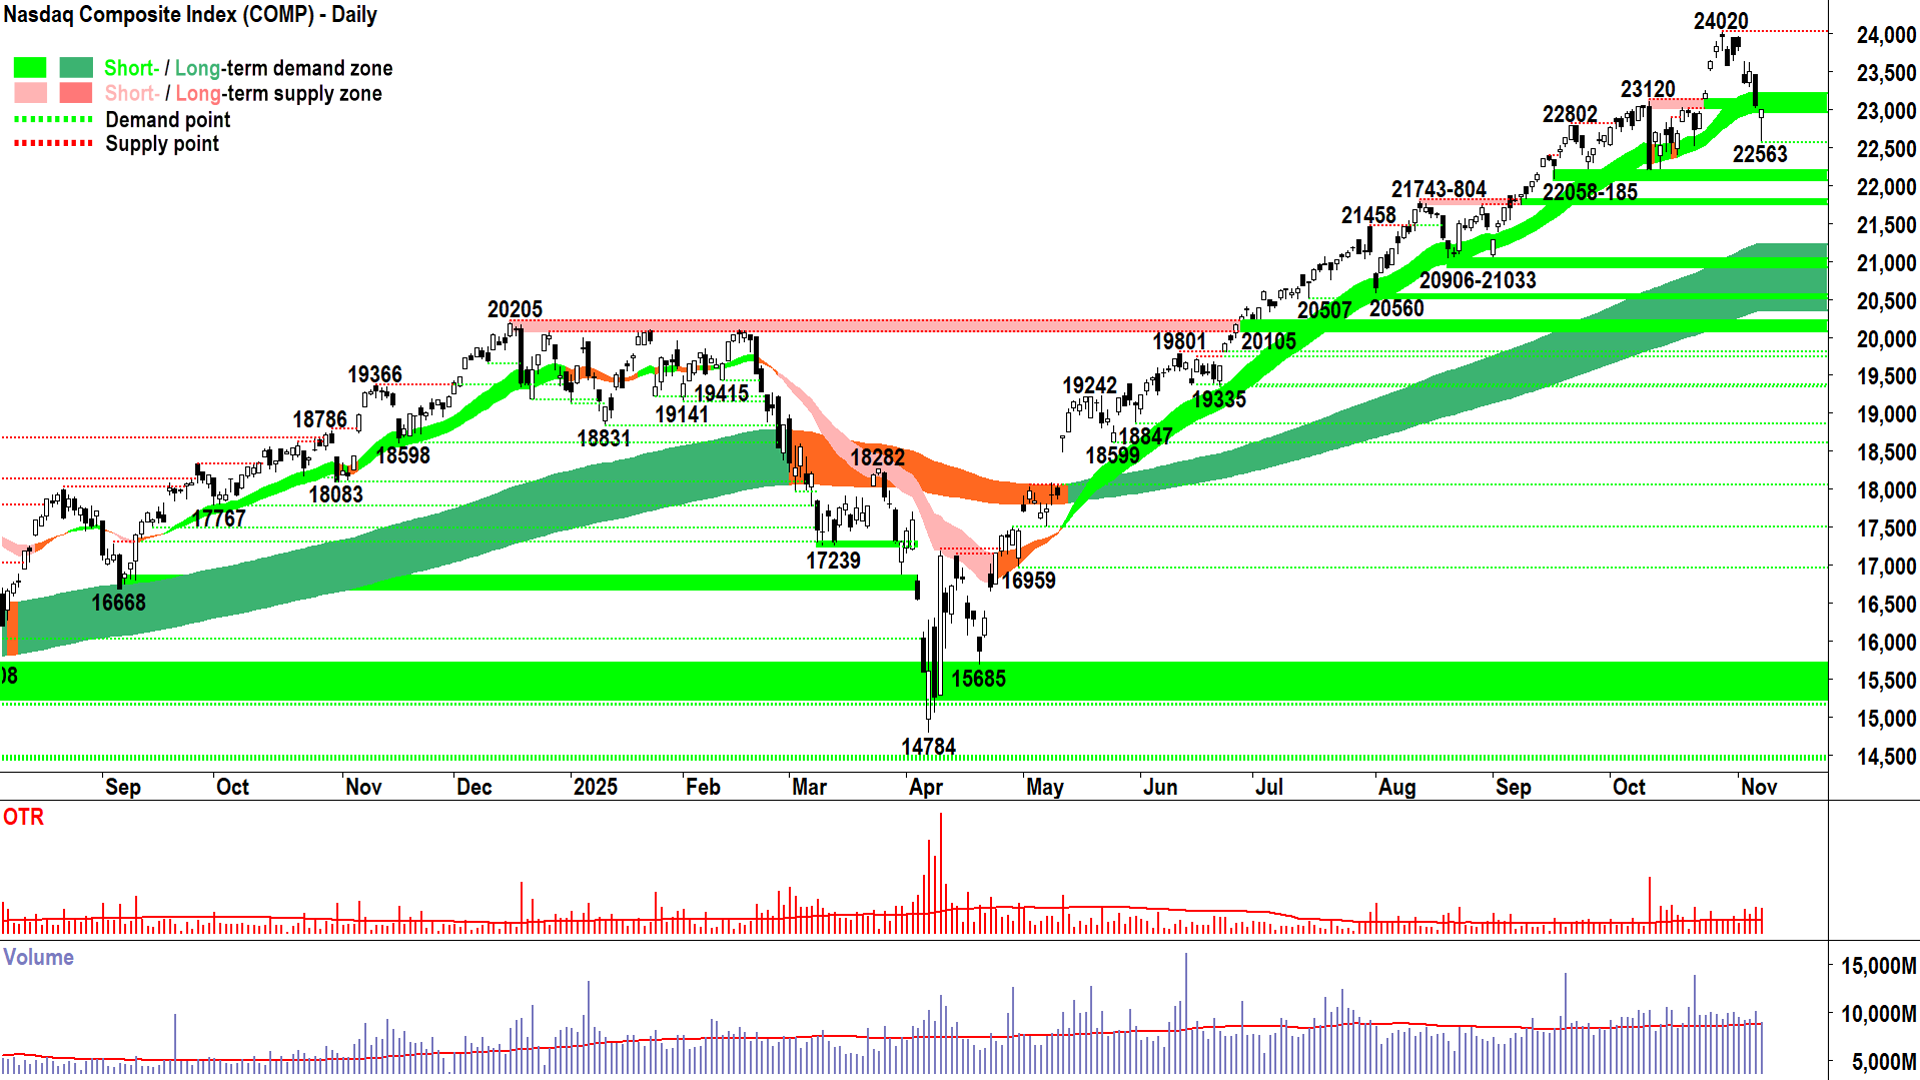
Nasdaq Composite Index

Nasdaq Composite Index chart (click here for full size image)
Friday’s candle was the candle we were largely expecting – but more specifically – that we were hoping for! 😅
To the untrained eye, it’s still a down session… so most would likely overlook the importance of Friday’s candle as a clear demand-side showing.
We know better! We know that in the face of a potential supply-side dominant display – demand triumphed over supply.💪
Certainly, at Friday’s low, it all looked lost for the short term uptrend – total supply side control.

NASDAQ Composite Index - Intraday chart Friday 7 November
But this is why we ignore live candles! If you looked at the Comp around midday on Friday, you may well have loaded up on shorts… Only to come back at market’s close to see that everything had turned green!
Control is determined by the end of the trading session – when all is said and done and everyone who wishes to transact within that trading session has done so (hey – if they were motivated enough – they absolutely would have made it happen!).
Supply thought they were cruising, then the demand-side decided: “Yep, okay, that’s our price… let’s flick the switch”. They soaked up the prevailing supply, and when there was none left at the session’s lows… they started bidding higher and higher prices to entice out more supply – which was largely not forthcoming.
In terms of price action, this superior latent excess demand manifests itself as a downward pointing shadow – hence the reason why I bang on about downward pointing shadows so much here! 😉
Repetition in ChartWatch is not accidental or simply as result of lazy / unimaginative writing…
Why doesn’t this bloke write about something different for once…? Blah trends, blah price action, blah bloody shadows, blah volume, blah volatility, blah who’s in control… Mate, you’re boring my socks off!!! Tell me about something way more complex and exciting like Bollinger bands, Fibonacci, Elliott Wave and Gann forecasting – markets are complicated = They must require a complicated solution!!! 😒
Nope. Markets are as simple as D vs S = P.
They have been since D, S, and P became a regular thing in commerce.
Friday’s long downward pointing shadow points to where excess demand was found in the system. It’s where the demand-side showed substantial motivation and the supply-side, well… it kinda evaporated.
So, we can assume that MOTN (More Often Than Not), with demand once again active in the system (crystal clear to those who understand how to tell such a thing!), the market psychology changes to:
Demand-side (i.e., “cash” and other assets like bonds that can be liquidated to become cash, plus cash raised by going short): “Hmmm… maybe I won’t get those stocks I wanted to buy any cheaper… maybe I better pay up = FOMO (Fear Of Missing Out!)”
Supply-side (i.e., “stock” and those potentially looking to go short): “Maybe I’m better off holding off selling… I might get a better price”.
It also sets the low of Friday’s candle as a critical line in the sand = Cross it and market participants will lose faith that the excess demand which caused its formation remains active in the system (if then, watch out below!!! ⚠️)
Average volume on Friday suggests an average amount of demand kicked into dislodge and average amount of supply. There was no great supply blowoff that a massive amount of demand then bought into.
So, without that supply blow-off… there still could be latent supply lurking in the system – and this will need to be reconciled. It might kick back in at previous points of demand (MOTN, they will now act as points of supply), or at any trend ribbons that may hover overhead.
Either way, we’ll know when it does: Black-bodied candles and or upward pointing shadows – so we must be super watchful of these signals, particularly if they occur on above average volume and volatility.
In the meantime, we want further confirmation of demand-side control – one candle doesn’t a trend make! So, we want more white-bodied candles and or downward pointing shadows – the lengthier the better and as soon as possible – because we don’t want to linger down here as it will discourage the FOMO + Hold On For Upside – HOFU!) forces that facilitate higher prices!
View: Still hanging in at FRP (Full Risk Position corresponds to a 100% allowable capital allocation limit for US stocks based on my personal risk management model).
Key levels: A close below the short term uptrend ribbon (presently 22960-23185) will nullify the short term uptrend = ⚠️, 22563 is Friday's low – as noted above it is a "critical line in the sand" for demand-side control – and therefore a close below this point will trigger a cut to my US capital allocation limit to 2/3RP. The next critical zone of demand below 22563 is 22058-185 – below it, the short term trend is likely down, and the long term trend is under significant pressure = ⚠️
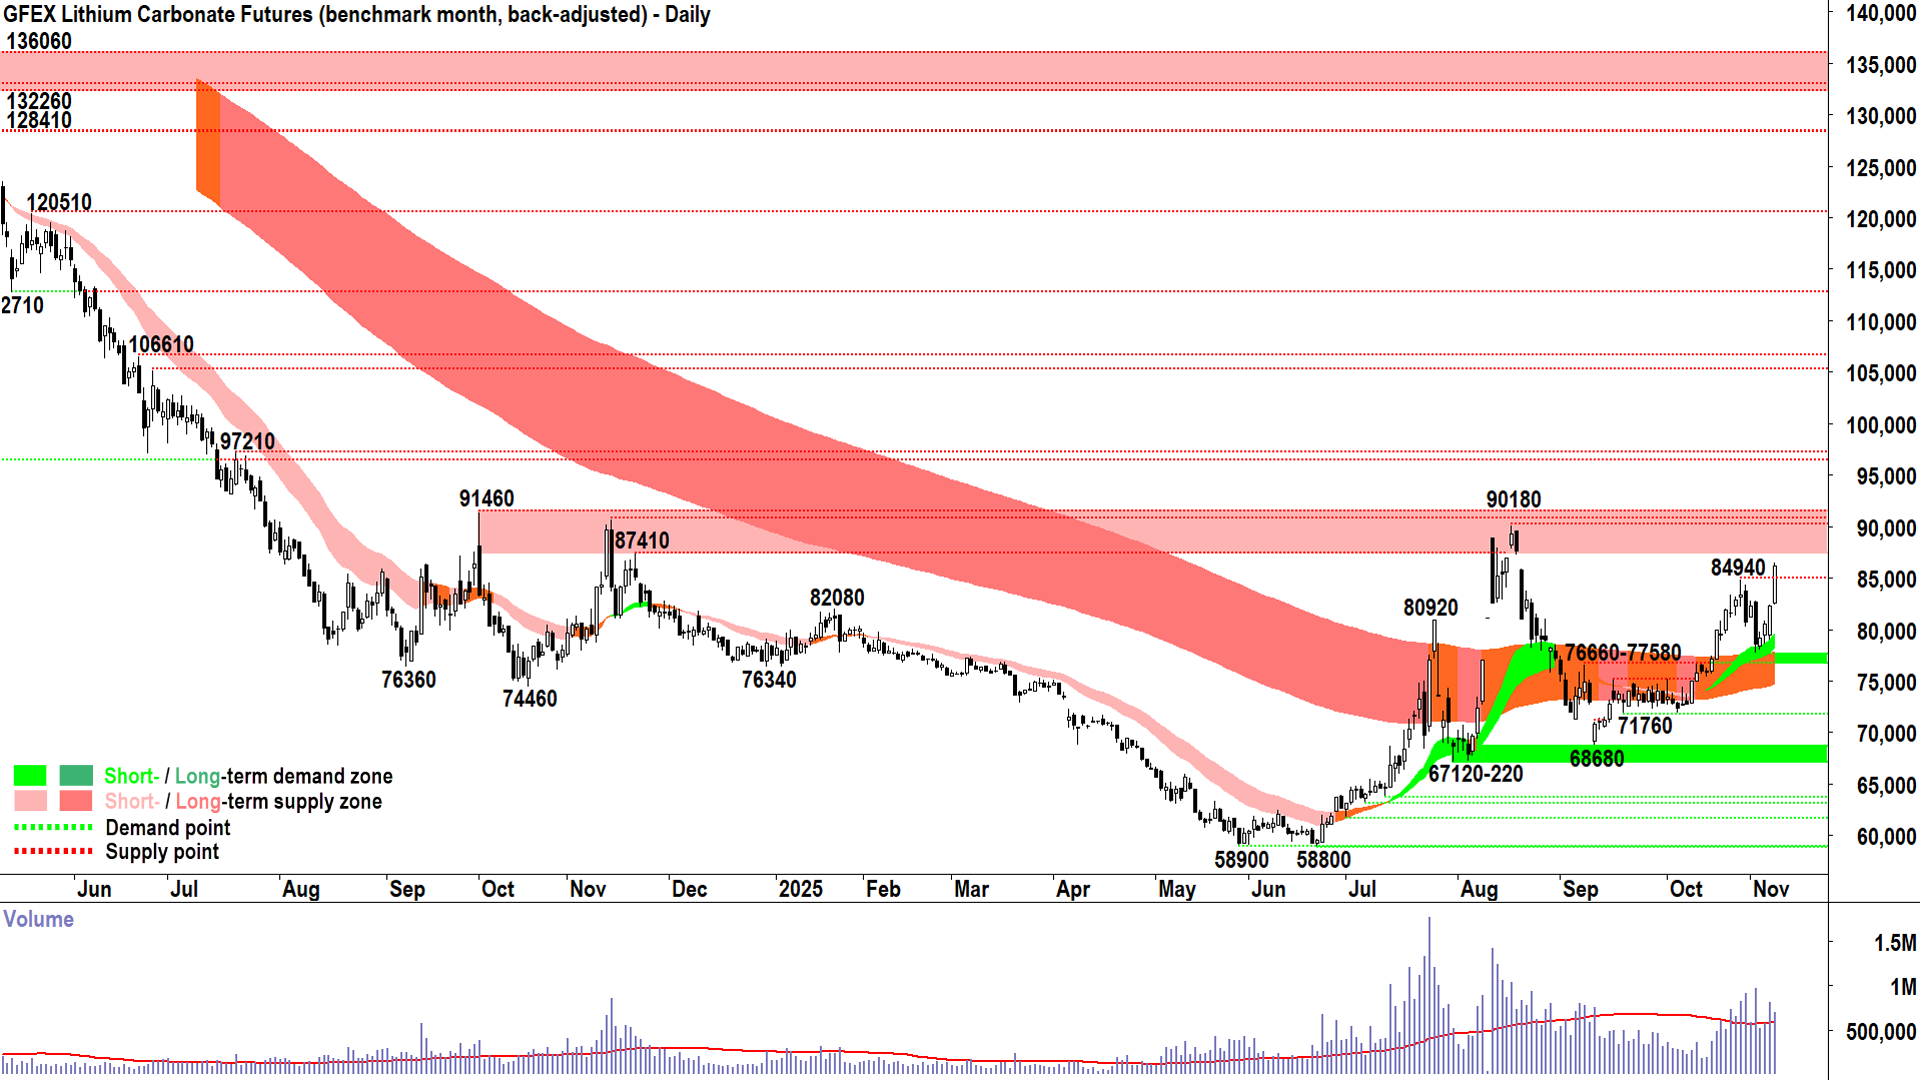
Lithium Carbonate Futures (Benchmark month, back-adjusted) GFEX

Lithium Carbonate Futures (click here for full size image)
Super quick update here because we only just covered this one on Friday – and because the candle is still OPEN!
So, I am NOT drawing any conclusions, but I trust that you will look back the closed candle at 3pm Perth time and determine the location of the close relative to:
The high of the session = Best is as close to the high as possible
The 84940 previous point of demand = Must close above it for today’s improvement to be taken seriously!
As surprising as this chart might be for many (while making total sense to others! 😉) more and more, the trends, price action, and candles are demonstrating increasing short and long term demand-side control.
I know I called this a few updates ago, but let me say this now to make it as official as anyone might care to believe: A close above 84940 with a high close candle = New bull market as far as my technical model is concerned.
What does that mean? 🤔
Not very much I guess… because the future is known and anything can happen. However, let me just say that in my experience it means that MOTN – i.e., given the present set techincals I'd expect the lithium price to continue to rise.
View: Happy to stay the course on lithium carbonate. My technical model allows me to either add or maintain risk (i.e., +R / =R).
Key levels: 74525-78860 is the critical zone of demand, a close below it will nullify this new lithium bull market = ⚠️ 87410-91460 is the clear and critical next zone of supply. The price action there will be crucial in confirming or denying the resilience and commitment of the supply-side.
ChartWatch *LIVE* Webinar
ChartWatch *LIVE* Webinars – WEEKLY Wednesday's @ 12pm AEDT
Learn more about technical analysis and trend following through real case studies on ASX stocks. Australia's premier technical analyst, Carl Capolingua, shares his unique insights on stocks as requested by viewers. Ask about a company in your portfolio or anything related to trading and investing and get Carl's expert opinion.
Places are limited so >REGISTER NOW!<
