ChartWatch Markets: Bull market blues as Nasdaq goes from hero to zero, plus latest Lithium and Uranium chart analysis
Technical analysis of the most important global stock indices, commodities, bonds, FX, and crypto impacting your ASX portfolio each day.


Source: Shutterstock
Mentioned
KEY POINTS
- It feels like in the few candles from the demand-side perfection that was the 29-Oct peak of 24020 – the Nasdaq Composite has gone from all to nothing – from hero to zero! Yep, this “mean reversion” is starting to get a little nasty...
- Interestingly, for completely unrelated reasons, the chart of lithium and uranium have had their own little crises of confidence. Both were recovering from major downturns, only to experience a minor hiccup last week. Will it turn into indigestion!?
- ChartWatch Markets brings you the latest technical analysis of the key global stock, commodity, crypto and bond markets. Even better, we teach you how to be a better analyst by showing you how to spot the best trends, price action, and candles.
In today's edition of ChartWatch Markets, we'll be covering the technicals for:
Nasdaq Composite
Lithium Carbonate Futures (Benchmark month, back-adjusted) GFEX
Uranium Futures (Front month, back-adjusted) COMEX
Nasdaq Composite Index

Nasdaq Composite Index chart (click here for full size image)
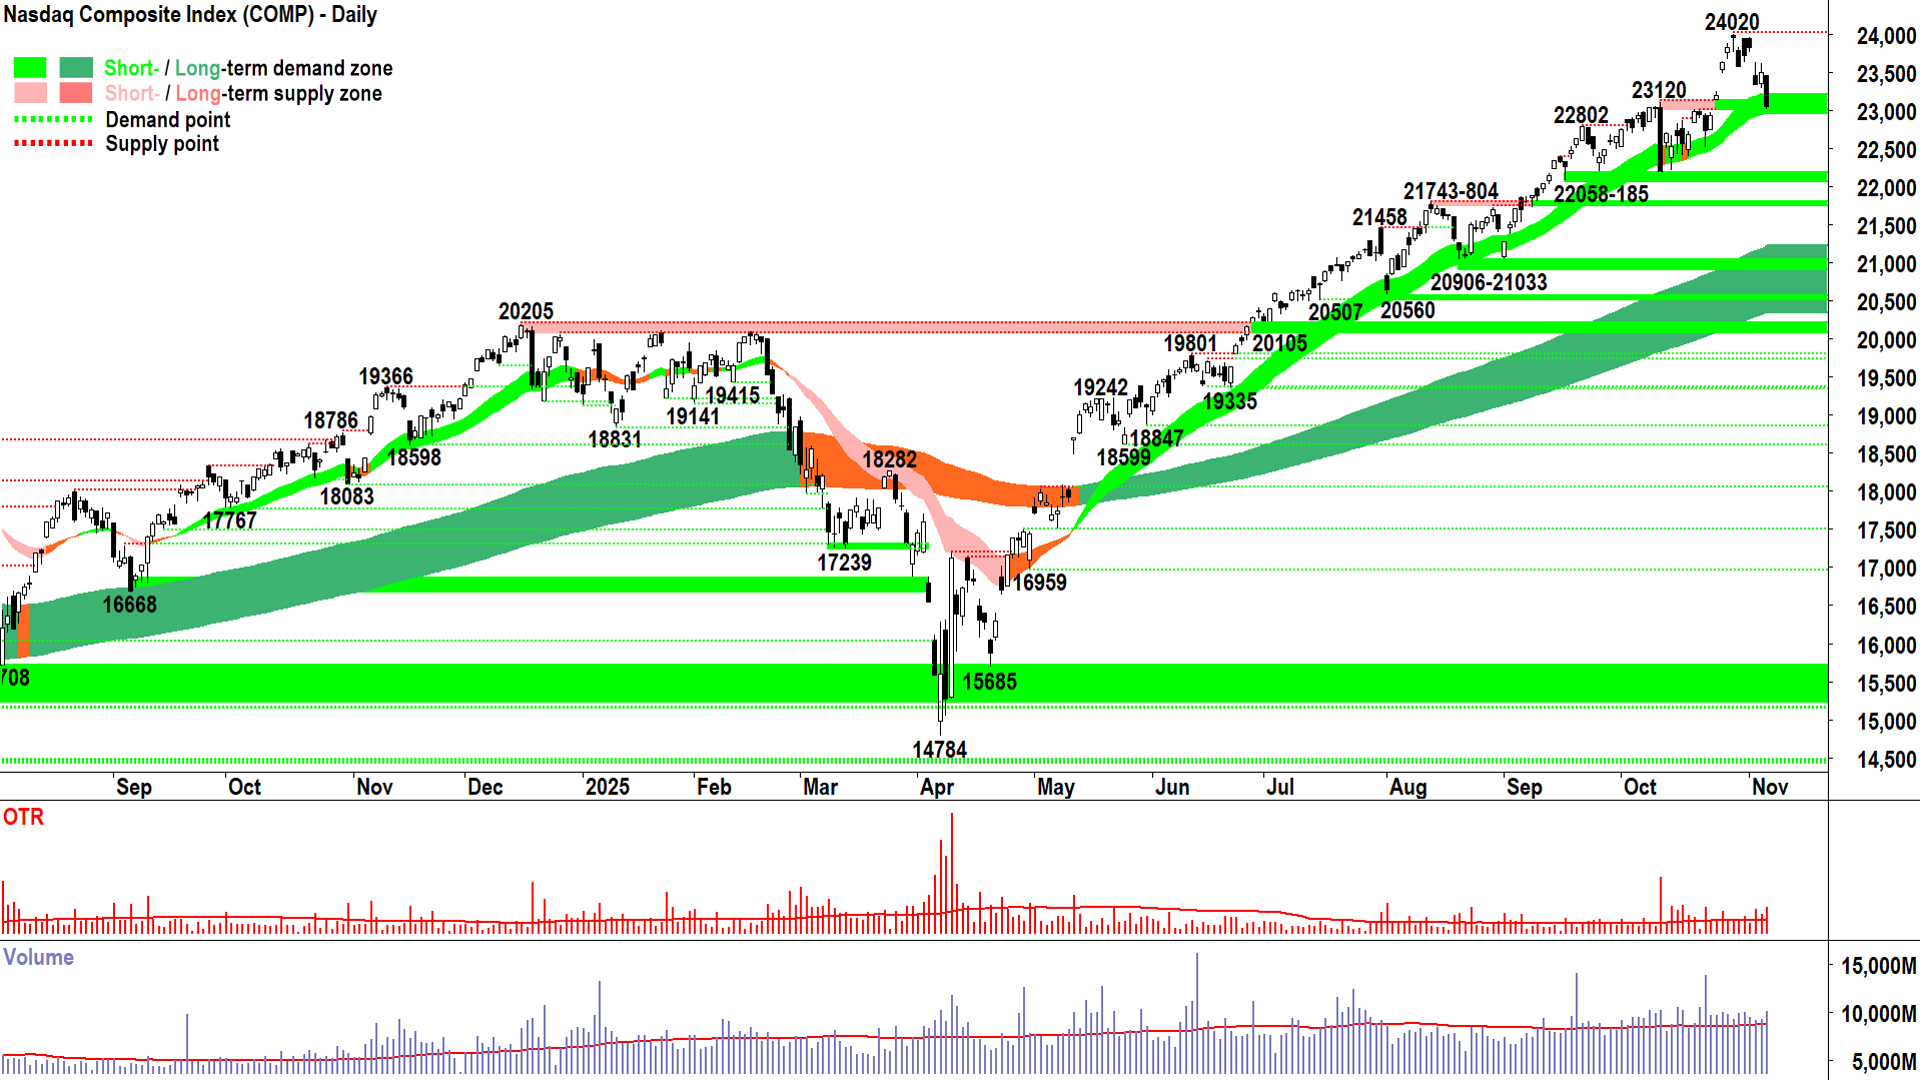
Well, there’s some price action and volume to take note of: Full black-bodied candle of decent size relative to the last couple of dozen, close near the low of the session, close below the 23120 point of demand, above average volume...⚠️
It feels like in the few candles from the demand-side perfection that was the 29-Oct peak of 24020 – we’ve gone from all to nothing – from hero to zero!
Yep, this “mean reversion” is starting to get a little nasty... 😱
I’ll let you Google and troll the usual major news outlets for why, because the best I can offer is this: Since 30-Oct, S > D = P⬇️.
Sometimes, it can be as simple as the change of the month… hey – fund managers do strange things…
Regardless of the reason… the course of action remains the same: Analyse the trends, price action, and candles, determine the outcome that is likely to occur MOTN (More Often Than Not) as a result, and manage risk accordingly.
So, let’s get to work 🧐!
1. Analyse the trends, price action, and candles (Note for the following: consistent with demand-side control = ✅ vs consistent with supply-side control = ⚠️)
Short and long term trend ribbons: ⬆️ / ⬆️, the price is above both ribbons and both ribbons are acting as a zone of dynamic excess demand (note: short term – only just!) = ✅
Price action: Falling peaks and falling troughs (29-Oct 24020 peak vs 3-Nov 23977 peak and 30-Oct 23578 trough vs next trough = unknown!) (i.e., demand removal and supply reinforcement = ⚠️
Candles: Mixed over the last month or so due to the batch of supply-side candles since 30-Oct (i.e., black-bodied candles and or upward pointing shadows) = ↔️
2. Determine the outcome that is likely to occur MOTN (More Often Than Not) as a result
There's been a definite shift back to equilibrium in the short term, however the long term trend remains very much intact.
The dynamic demand of the short term trend ribbon is critical now – it really should hold or we're likely to see further "mean reversion"!
The next major demand zone if the short term trend ribbon cracks is 22058-185.
3. Manage risk accordingly
Based on recent candles and price action, my model suggests there's little reason to +R here (i.e., my model doesn't see a reason to add risk to existing US stock exposures), however, I still feel the requirements for -R remain absent.
A close below the short term uptrend ribbon / 23032-23120 demand zone – particularly with another convincing supply-side candle and above-average volume performance – would change that.
View: I remain FRP (Full Risk Position corresponds to a 100% allowable capital allocation limit for US stocks based on my personal risk management model) but I wouldn't be replacing any risk that has been removed due to the recent pullback, i.e., one could call this an "=R" stance (i.e., not +R or -R!).
Key levels: A close below the short term uptrend ribbon (presently 22960-23200) will nullify the short term uptrend = ⚠️, the next critical zone of demand below this is 22058-185 – below it, the short term trend is likely down, and the long term trend is under significant pressure = ⚠️
Lithium Carbonate Futures (Benchmark month, back-adjusted) GFEX

An interesting chart (click here for full size image)
The last time we covered lithium carbonate was in ChartWatch Markets on 30-Oct.
In that update, we noted that while “Blind Freddy can see there's plenty more work to be done to repair nearly 3-years of one of the most savage bear markets in the history of markets” the chart above is “increasingly looking like a strong set of trends”.
Well Fred old man, what do we think now!? 🤔
As is usually the case with GFEX lithium carbonate futures – give them a wrap – and watch them unravel! 🤦
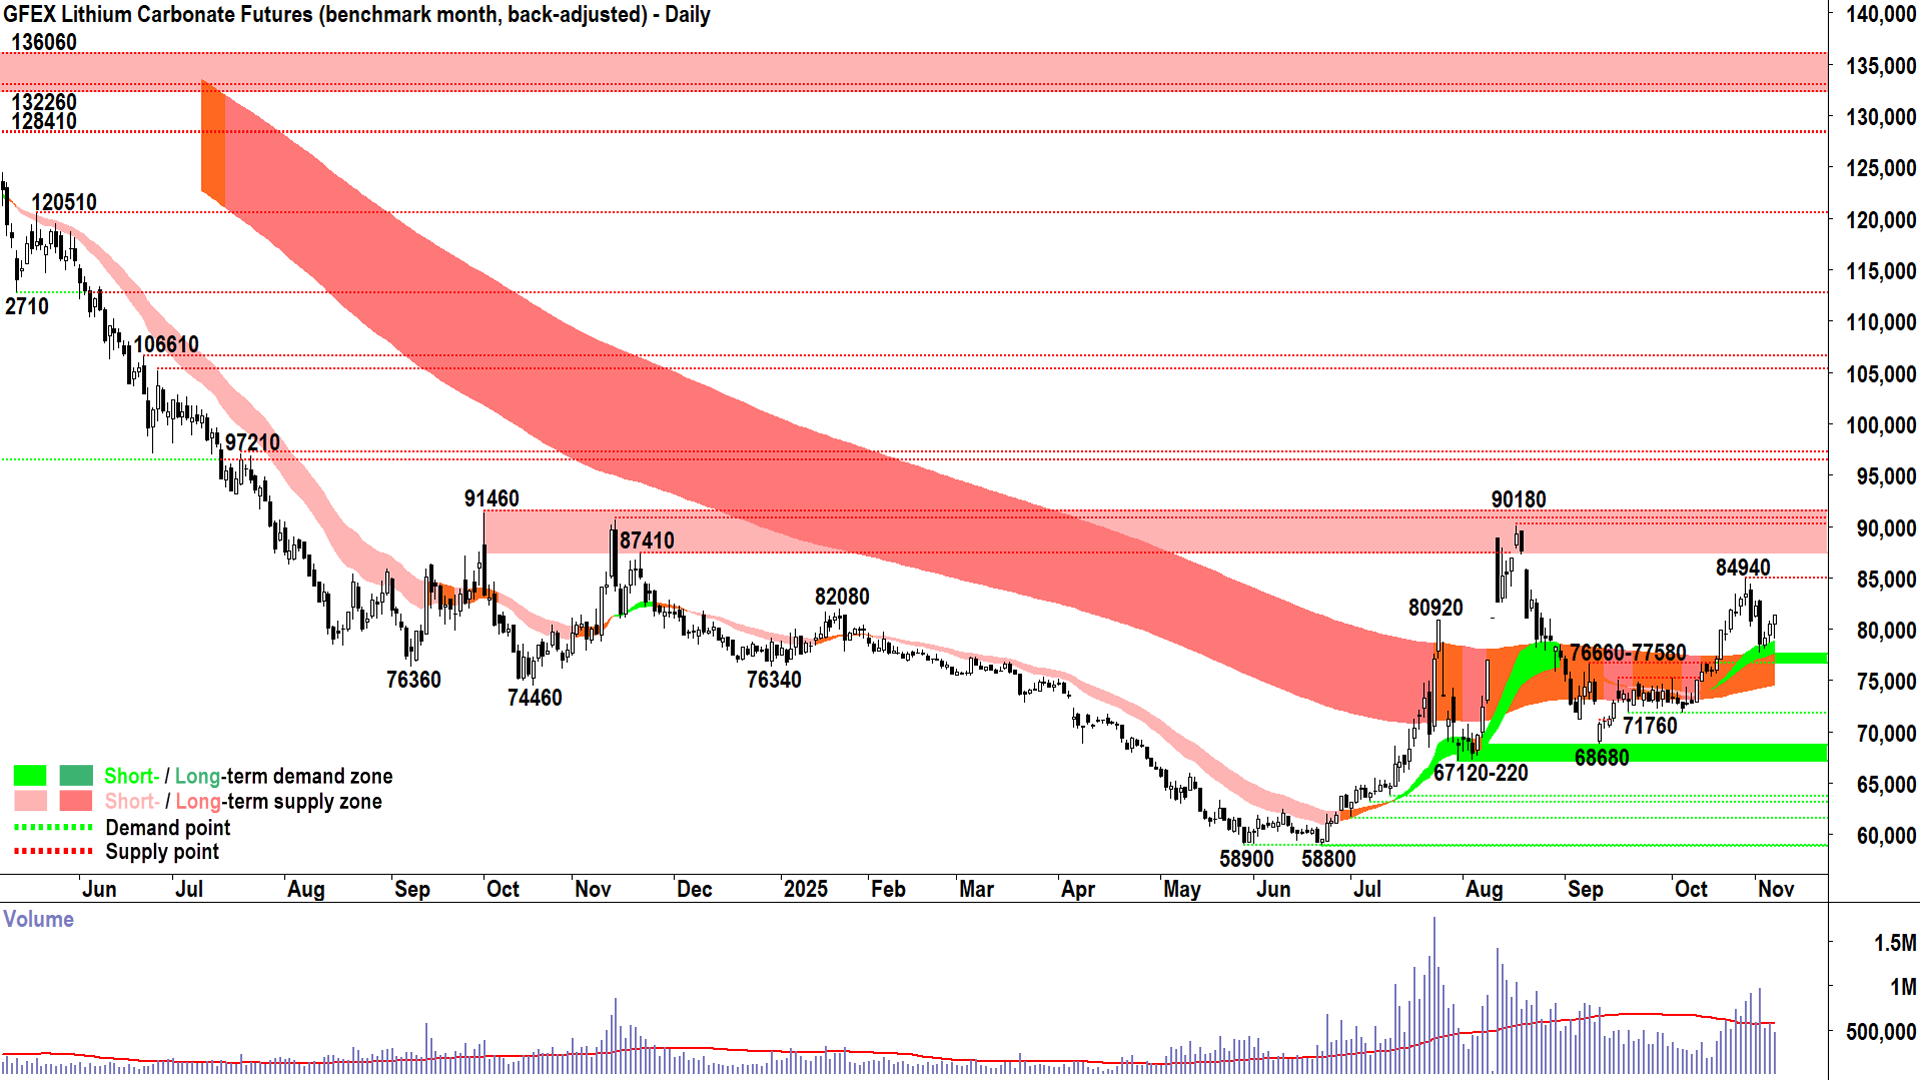
It’s not quite that bad, but we have seen a very decent pullback from that 30-Oct-now-peak of 84940. To be fair, that level wasn’t all that far off from where we’d expect supply to kick back in around 87410-91460.
Plus, nothing goes up in a straight line.
Plus, there was the usual shenanigans in this market regarding whether certain shuttered Chinese mines were about to reopen or not… but that’s all noise to me 🙉.
The price action shows very solid supply-side candles on 31-Oct and 4-Nov – both accompanied by substantial volume = the supply-side cannot be completely discounted here. They’re still able to flex when they want to.
This fact does require some caution with respect to the developing short and long term uptrends – it will no doubt nag away at lithium bulls’ minds…
But I suggest that while the dynamic demand of the short term uptrend and long term trend ribbons hold – then the fledgling recovery remains intact.
Whether you believe this new baby lithium bull or not – at least we now have the clearest of clear-cut lines in the sand for its survival:
Remain above 74525-78860 (i.e., the bottom of the long term trend ribbon and the top of the short term uptrend ribbon) – and the new bull lives.
Close below it, and well… ☠️⚰️😵🌵
The last candle is today’s candle – it’s live and so we really should discount it – but let’s pretend for one second that GFEX lithium carbonate futures can close here or better. This would be the minimum to make it a decent comeback from the 4-Nov wipe out.
Minimum. I note low volumes since 4-Nov which suggests that the demand-side is circumspect, but the decent price gains suggest it’s also showing some motivation. And it doesn’t appear to be finding any great swathes of supply in opposition just yet…
You know me, a quick bounce is a good bounce, so the sooner the price starts sniffing around 84940 the more credible this little rally is. A lower peak to 84940 would not be a good look. Further supply-side showings (i.e., black-bodied candles and or upward pointing shadows) also wouldn’t bode well…
View: Happy to stay the course on lithium carbonate. My technical model allows me to either add or maintain risk (i.e., +R / =R).
Key levels: 74525-78860 is the critical zone of demand, a close below it will nullify this new lithium bull market = ⚠️ 87410-91460 is the clear and critical next zone of supply. The price action there will be crucial in confirming or denying the resilience and commitment of the supply-side.
Uranium Futures (Front month, back-adjusted) COMEX
%20COMEX%20chart_6%20Nov.png)
An interesting chart (click here for full size image)
The last time we covered uranium was also in ChartWatch Markets on 30-Oct.
In that update, I similarly gave uranium a wrap. Similarly, market events have conspired to make that wrap look rather silly (Kazatomprom production report).
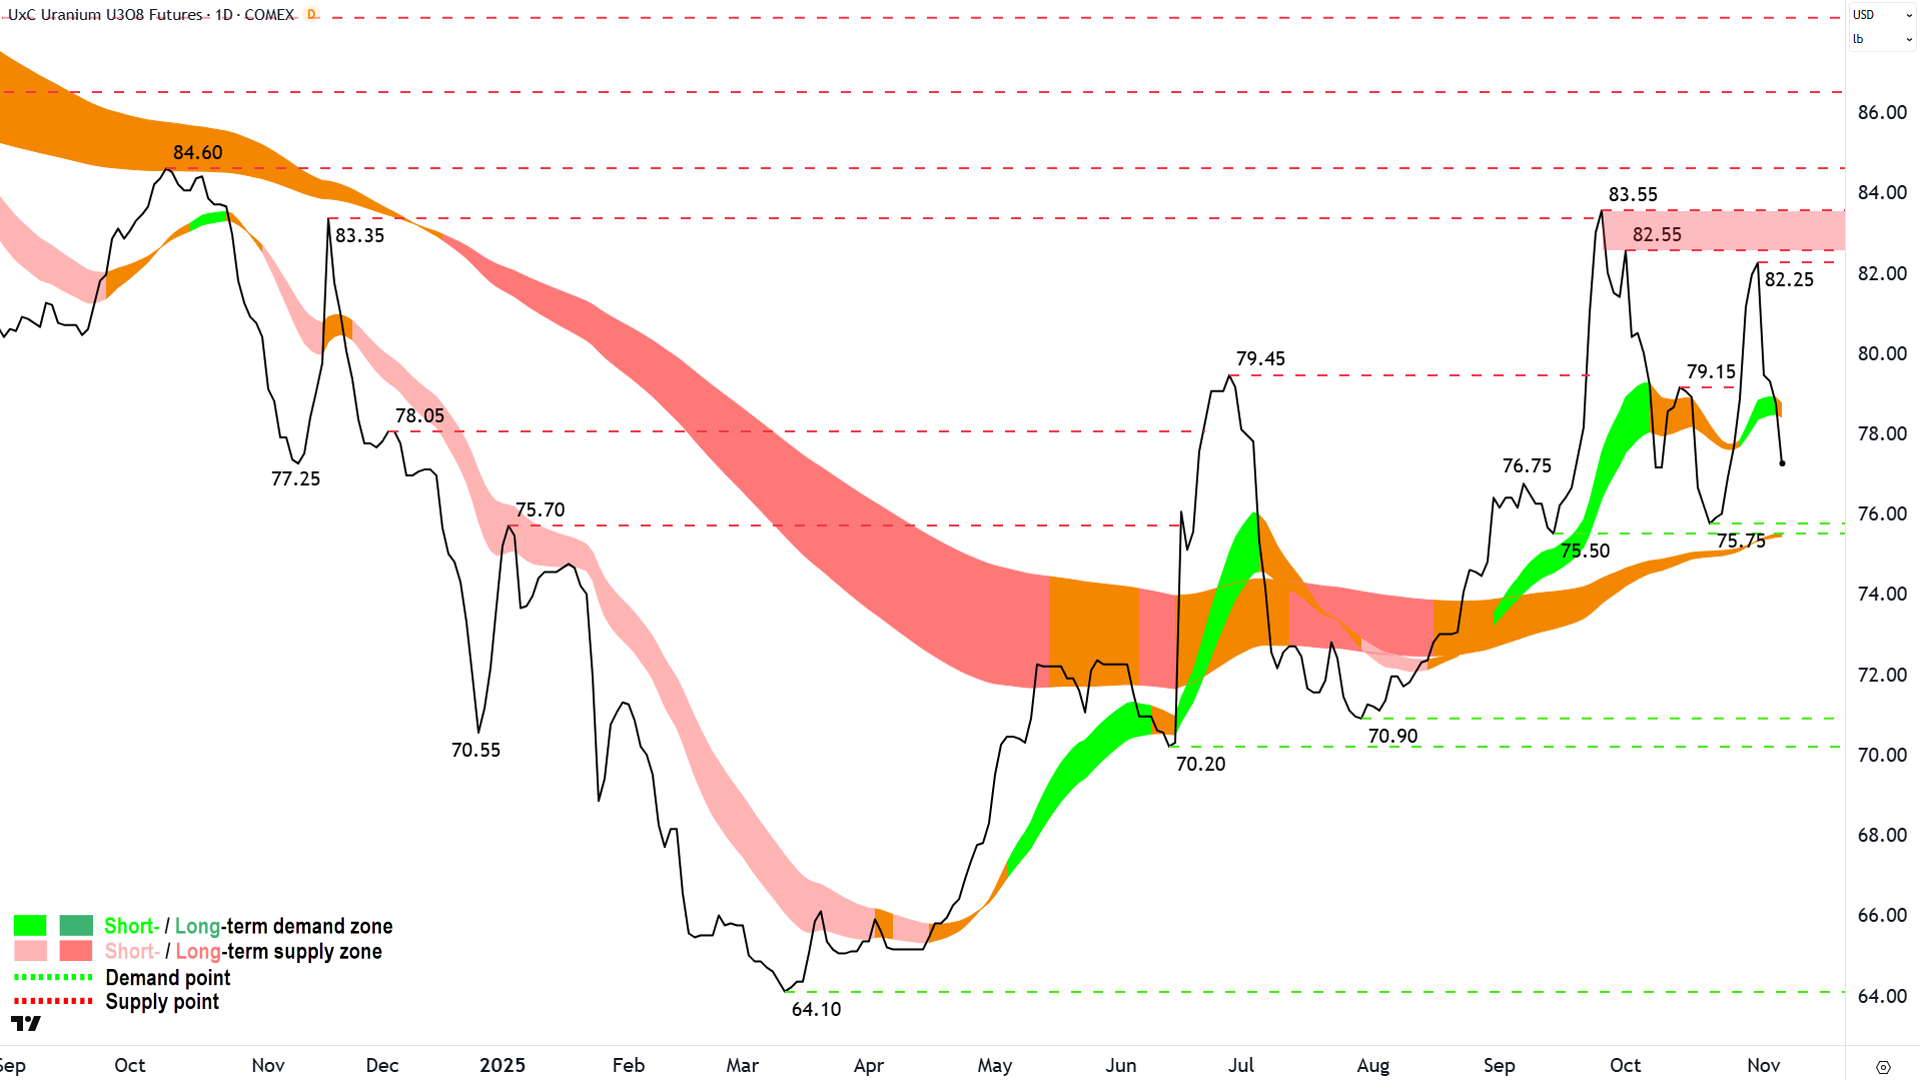
I won’t spend much time here because I am rapidly losing interest in this trend – well, because the trends are rapidly losing momentum...
The price action here, gyrating between 75.50 and 83.55 is quickly resembling a trading range. The price is back below the short term trend ribbon, which has neutralised = ⚠️.
The uranium chart smacks of growing equilibrium to me. The top and bottom of that range become the key points going forward – inside them and it’s going to be a bit ho-hum.
View: My technical model dictates a more neutral stance here, so =R (i.e., neither looking to add nor reduce risk).
Key levels: 75.50-75.75 is the closest point of demand, a close below here will nullify the short term uptrend = ⚠️ 82.55-83.55 is the critical zone of supply, a failure to push through this zone would raise concerns about the sustainability of the present short and long term uptrends.
Have you seen this week's ChartWatch *LIVE* Webinar?
ChartWatch *LIVE* Webinar
ChartWatch *LIVE* Webinars – WEEKLY Wednesday's @ 12pm AEDT
Learn more about technical analysis and trend following through real case studies on ASX stocks. Australia's premier technical analyst, Carl Capolingua, shares his unique insights on stocks as requested by viewers. Ask about a company in your portfolio or anything related to trading and investing and get Carl's expert opinion.
Places are limited so >REGISTER NOW!<
