ChartWatch Markets: Stock market records are made to be broken, as uranium and lithium charts are also pointing up
Technical analysis of the most important global stock indices, commodities, bonds, FX, and crypto impacting your ASX portfolio each day.


Source: Shutterstock
Mentioned
KEY POINTS
- There’s old saying in markets: “The trend is your friend”. But many add after this: “Until it bends!” What are the trends on the Nasdaq Composite telling us about the health of the global bull market in stocks? We investigate!
- Uranium stocks had a rocket put under them this week on news that the US government is investing heavily in nuclear power to shore up the USA’s energy security. It’s also sparked a strong move up in the uranium price, as you will see…
- Also on the move, another energy transition favourite – that up until recently was down in the dumps. The price of lithium is steadily recovering from one of the most devastating bull markets in the history of markets. Can it continue?
In today's edition of ChartWatch Markets, we'll be covering the technicals for:
Nasdaq Composite
Uranium Futures (Front month, back-adjusted) COMEX
Lithium Carbonate Futures (Benchmark month, back-adjusted) GFEX
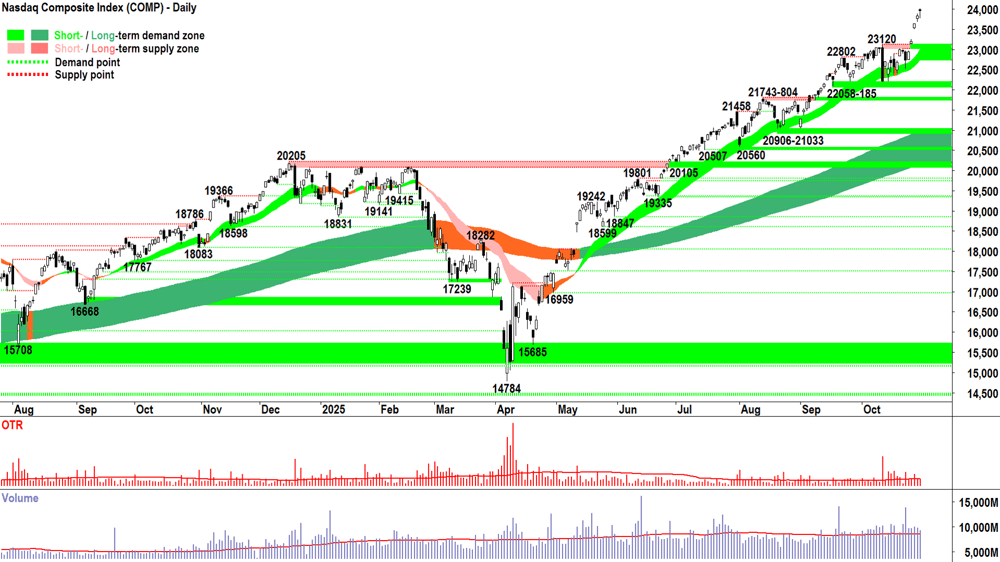
Nasdaq Composite Index

Nasdaq Composite Index chart (click here for full size image)
Here's the thing about trend following. Most of the time (if you can pick decent trends), there's not a great deal to do... 🥱
That's because if you can pick decent trends, then MOTN (More Often Than Not) the price tends to keep moving in the direction it is already moving in... Hmmm... what's Newton's First Law? 🤔
An object in motion stays in motion, unless an unbalanced force acts on it — Sir Isaac Newton
The Comp's present state of motion is "short and long term uptrends" – caused by an imbalanced force: D > S = P⬆️
So, it makes sense in this case, that to stop its motion, a "balancing force" must act upon it.
How do we go from D > S = P⬆️ to D = S = P↔️?
S⬆️ or;
D⬇️ or;
S⬆️ and D⬇️
It's that simple. The other thing that is delightfully and reassuringly simple, is that the candles and price action are the perfect tools for indicating if we're in one of those scenarios:
Black-bodied candles and or downward pointing shadows must = 1, 2, or 3.
Slightly bigger picture, the formation of a lower point of supply (S⬆️) or the breach of a previous point of demand (D⬇️), or both (S⬆️ and D⬇️), are also highly instructive.
No, I could waffle on about overvaluations, the global economy, or the possibility an asteroid the side of Rottnest Island hitting... um Rottnest Island (sorry quokkas! 💥)... but that would be a shameful waste of both of our time... wouldn't it?
Because at the end of the day, all that stuff is fluff. But! While I have no respect for any of that noise, I do have respect for the fact it's important to those who are most influential in the markets – you know – the ones responsible for creating all that D vs S!
So, I'll let them worry about it... as they make my beloved candles and price action! 😉
As far as the 3 tent pegs of my technical model go, i.e., trends, price action and candles:
Consistent with demand-side control = ✅
Consistent with supply-side control = ⚠️
Short and long term trend ribbons: ⬆️ / ⬆️, widening (getting stronger), acting as a zone of dynamic excess demand = ✅
Price action: Rising peaks and rising troughs (i.e., supply removal and demand reinforcement) = ✅
Candles: Demand-side candles (i.e., white-bodied candles and or downward pointing shadows) = ✅
View: ✅✅✅ = I prefer to stay the course here at FRP (Full Risk Position corresponds to a 100% allowable capital allocation limit for US stocks based on my personal risk management model). The only thing I would note here is that the Comp is now a decent whack away from the short term uptrend ribbon – some mean reversion here would not be a surprise – even though there's little in the candles or price action to suggest it's coming!
Key levels: 23120 is the closest point of demand, the price should not close below here if the demand-side is in control of the Comp's price; a close below the short term uptrend ribbon (presently 22740-23000) will nullify the short term uptrend = ⚠️
Uranium Futures (Front month, back-adjusted) COMEX
%20COMEX%20chart_29%20Oct.png)
An interesting chart (click here for full size image)
%20COMEX%20chart_29%20Oct.png)
The last time we covered uranium was in ChartWatch Markets on 17-Oct.
In that update, we noted the u-price was “likely approaching a bit of a make-or-break moment”.
There were some concerning items in the price action, namely, lower peaks and lower troughs… but there was still plenty of reason to back the long term trend that appeared to be transitioning from bear to bull.
Looking at the latest price dynamics, it appears the longer term has triumphed over some of those short term concerns – at least for now!
The uranium price has rallied strongly from just above the long term trend ribbon to take out the most recent point of supply at 79.15, and edge its way towards the “big one” – the 82.55-83.55 zone of supply.
The price action response there will be critical, i.e.,:
A confident move straight through it = little-to-no motivated supply-side opposition 💪; vs
A crumple back to lower peaks and lower troughs = dedicated and motivated supply-side opposition ⚠️
View: Happy to stay the course on uranium. My technical model allows me to either add or maintain risk (i.e., +R / =R).
Key levels: 75.50-75.75 is the closest point of demand, a close below here will nullify the short term uptrend = ⚠️ 82.55-83.55 is the critical zone of supply, a failure to push through this zone would raise concerns about the sustainability of the present short and long term uptrends.
Lithium Carbonate Futures (Benchmark month, back-adjusted) GFEX

An interesting chart (click here for full size image)
My approach isn't for everyone. I get that. It probably ticks a few people off, too. Well, um, it definitely ticks a few people off (sent to me via X today):
Don't you have a job to do Carl? I'm retired so I have time for research. You not only promote parasitic trading but you actively discourage research?
I'm not sure if I "actively discourage" research... simply, I believe it's an utterly pointless exercise. You see, I believe that research is for those who like to convince themselves their favourite narrative is right. That's okay with me, hey – you can spend your days however you want to spend your days, believing whatever you want to believe.
Knock your pretty frilled little socks off.
I believe, though, that no matter how bullet proof / correct / right / valid / impervious to attack your chosen narrative is... the market reserves the right not give a flying fruit about it! 🍌
That's all. And ain't that a shame when it chooses to make a mess of your narrative and any stocks you're belligerently holding onto because of it. It's hard to let go when one is so sure one is right...
Now take me. I do nil research. I have zero strong views on any narrative.
But! I have total and utter respect for the fact that the market knows more than me – and therefore I must abide by only one mantra: D vs S = P.
So, when the market turns against my positions... I run like a startled burglar – for what would I know anyway!? 🤷
Yep, gonski 💨! Oh well, on to the next strong trend...
And good news lithium bulls... this is increasingly looking like a strong set of trends here. The short term is now up and it's gathering momentum, the price appears to be confidently holding above the long term trend ribbon (neutralised), and the price action is... pretty darn good actually – strong motive phases and very shallow pullbacks.
Finally, the icing on the cake is a bunch of credible demand-side candles among the last dozen or so.
Obviously, it's still relatively early days – Blind Freddy can see there's plenty more work to be done to repair nearly 3-years of one of the most savage bear markets in the history of markets (90% decline from top to bottom!).
But, things are moving along nicely 🤞.
View: Happy to stay the course on lithium carbonate. My technical model allows me to either add or maintain risk (i.e., +R / =R).
Key levels: 76660 is the closest point of demand, ideally, the price should not close below here if the demand-side is in control of the GFEX lithium carbonate's price – but I expect the long term trend ribbon will be a more critical balance point between demand-and-supply-side control (presently 73880-77520) a close below it will nullify this new lithium bull market = ⚠️ (There... I said it! 😉) 90180-91460 is the clear and critical next zone of supply. The price action there will be crucial in confirming or denying the resilience and commitment of the supply-side.
ChartWatch *LIVE* Webinar
ChartWatch *LIVE* Webinars – WEEKLY Wednesday's @ 12pm AEDT
Learn more about technical analysis and trend following through real case studies on ASX stocks. Australia's premier technical analyst, Carl Capolingua, shares his unique insights on stocks as requested by viewers. Ask about a company in your portfolio or anything related to trading and investing and get Carl's expert opinion.
Places are limited so >REGISTER NOW!<
