ChartWatch Markets: Nasdaq, gold, silver, and platinum bull market trends are unrelenting
Technical analysis of the most important global stock indices, commodities, bonds, FX, and crypto impacting your ASX portfolio each day.


Source: Shutterstock
Mentioned
KEY POINTS
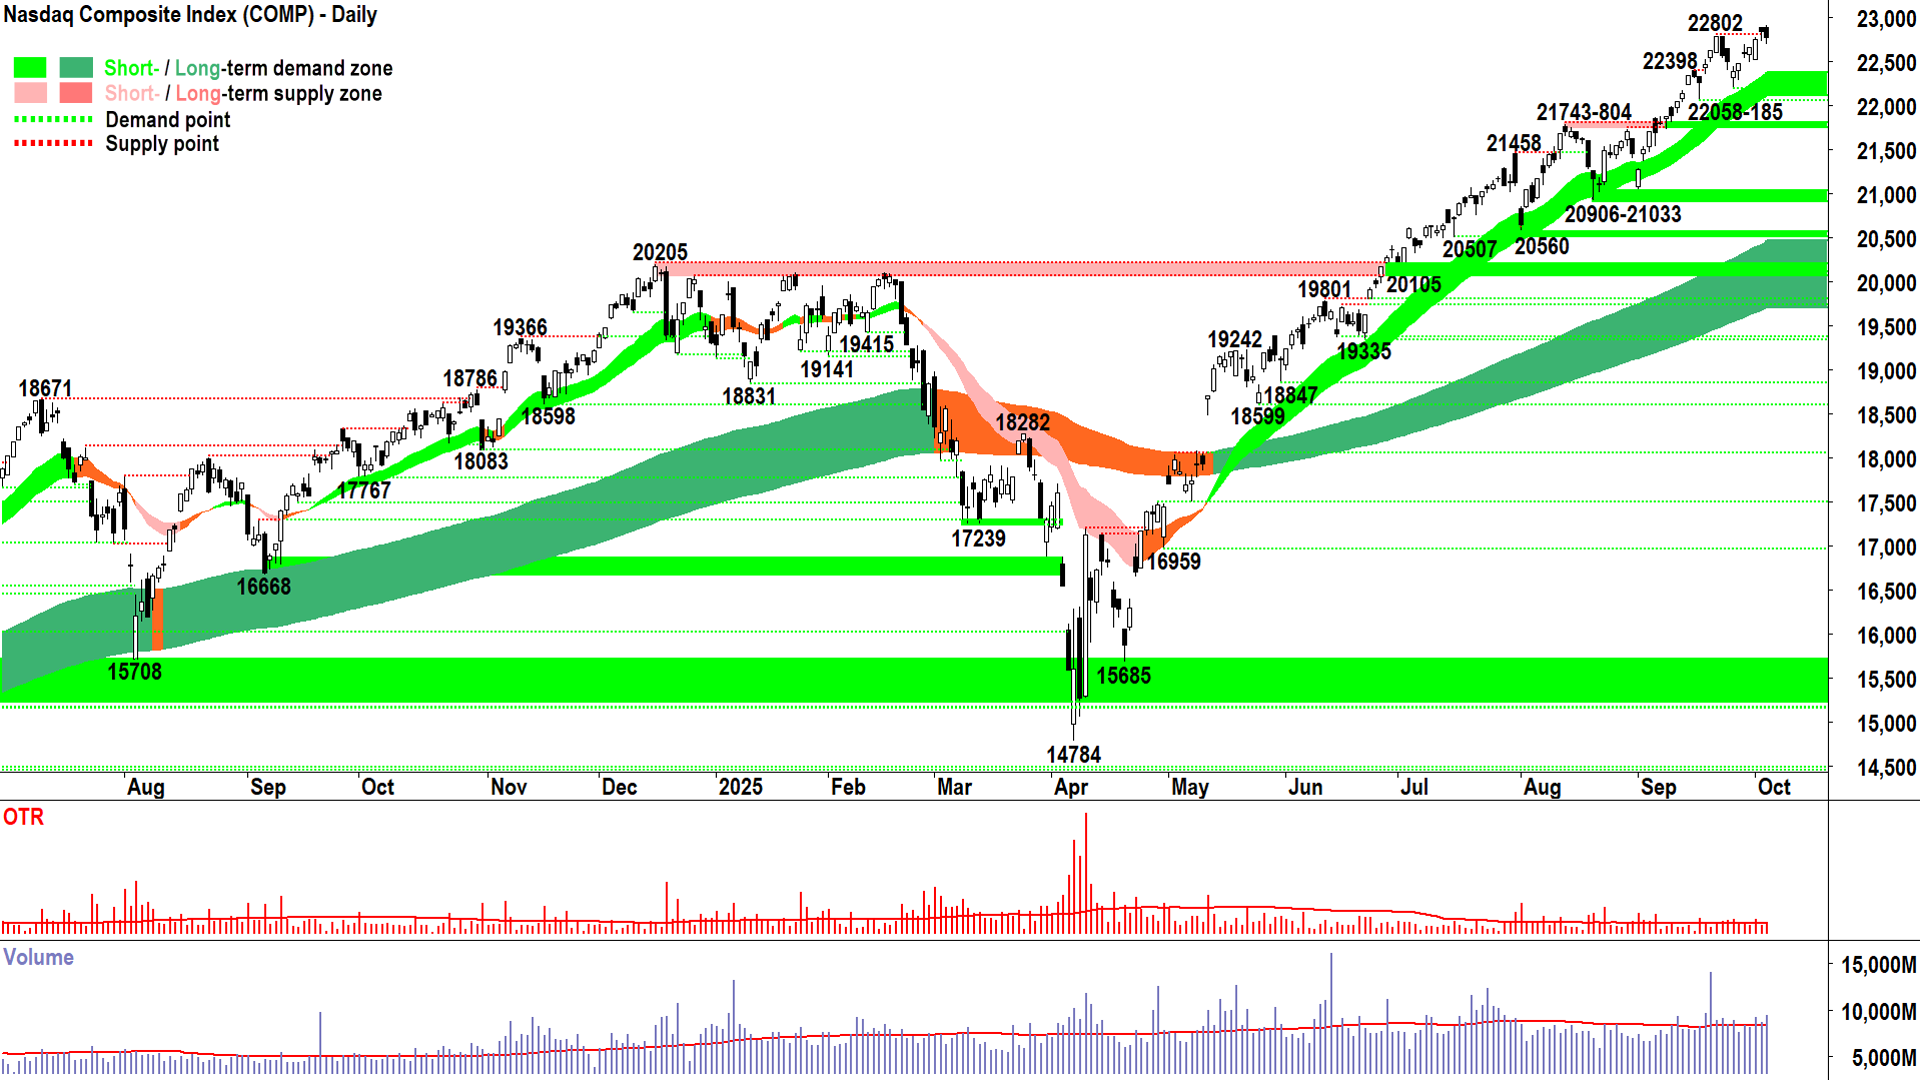
- The Nasdaq Composite Index has tipped a new all-time high during the week, closing at 22844.
- Gold and silver's bull market trends have also continued unabated, as each moves further in to rarefied air.
- Platinum's bull market is substantially newer, but is similarly gathering momentum.
In today's edition of ChartWatch Markets, we'll be covering the technicals for:
Nasdaq Composite
Gold Futures (Front month, back-adjusted) COMEX
Silver Futures (Front month, back-adjusted) COMEX
Platinum Futures (Front month, back-adjusted) COMEX
Nasdaq Composite Index

Nasdaq Composite Index chart (click here for full size image)
A smidge of excess supply creeping in here. Not ideal, sure… but put in context with respect to the rest of the technicals – which remain exemplary – it's insignificant.
There’s really only one thing a trend follower can do with a chart like that above: Remain watchful for increasing signals of growing supply-side control – and continue to follow the trend.
Which is unequivocally – UP ⬆️!
So, there's no change to my personal portfolio risk management settings here – which to be fair, has been the case since May: FRP. (Full Risk Position = My personal allowable capital allocation limit for my investments in US stocks is 100%).
On that “since May” comment, I just went back and checked my analysis for the two critical candles of that month, on 12 May (analysis 13 May here) and 27 May (analysis 28 May here) (Remember: We are 1 day in arrears!).
It’s worth reviewing my analysis and the checklists/thought process I went through to call the resumption of the Comp’s bull market – concluding with 28 May’s declaration of “Total demand-side control”. And here we are, nearly 4,000 points higher...✅
If you’ve only just started reading ChartWatch, you’ll be pleased to know that my analysis back then is identical to what it is now = CONSISTENCY 💯.
CONSISTENCY is repeatable. It allows for meticulous scrutiny and targeted process refinement. 💪
The opposite of CONSISTENCY is RANDOMNESS.
RANDOMNESS means all attempts at figuring out where you’re going wrong are FUTILE! Therefore, RANDOMNESS ensures that improvement is FUTILE! ⚠️
You can count on my analysis to NEVER succumb to RANDOMNESS. Because RANDOMNESS is the worst enemy of the disciplined and diligent trend follower!
Key levels: 22058 is the closest point of demand, the price should not close below here if the demand-side is in control of the Comp's price; a close below the short term uptrend ribbon (presently 22110-22380) will nullify the short term uptrend = ⚠️
Gold Futures (Front month, back-adjusted) COMEX
%20COMEX%20chart_6%20Oct.png)
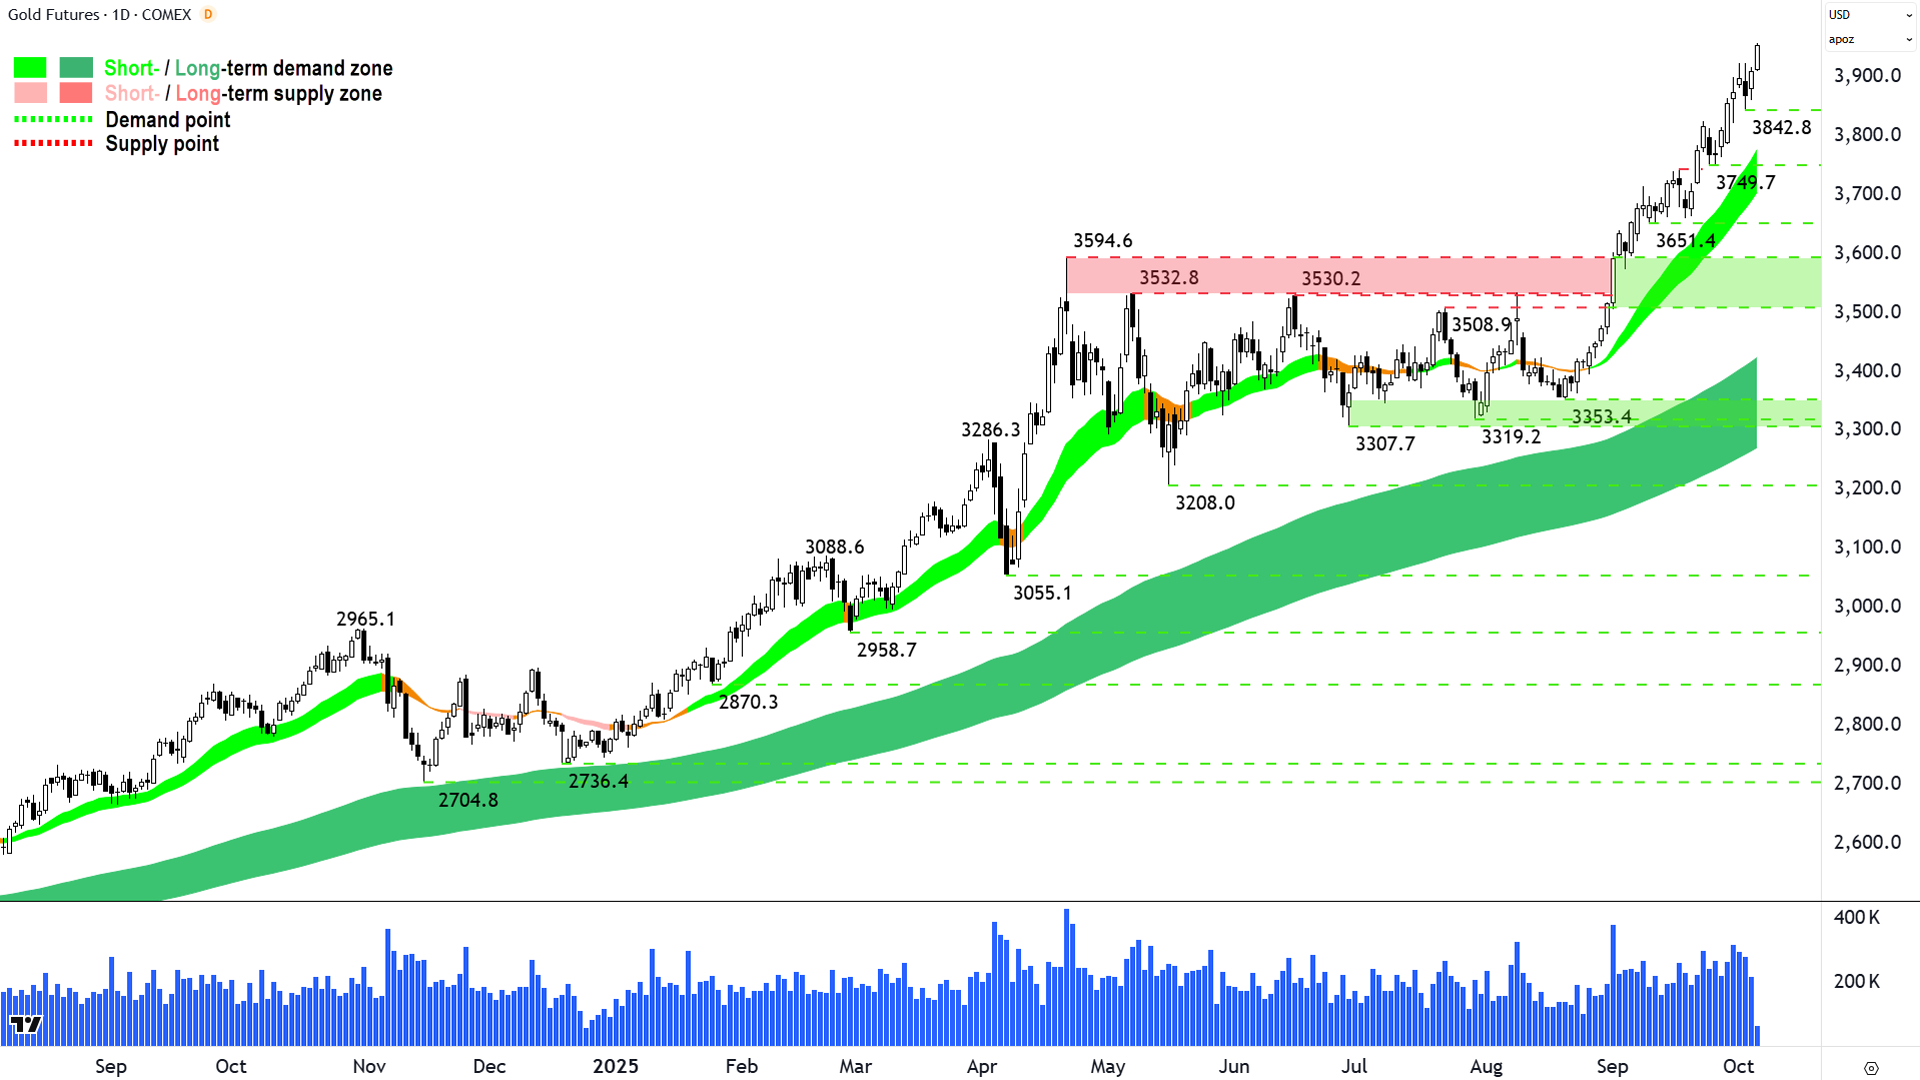
Remains a picture of unanimous demand-side control (click here for full size image)
The last time we covered gold was in ChartWatch Markets on 30-Sep.
In that update, we noted “there’s absolutely nothing to do but continue to back gold’s perfect uptrend”.
I feel like I’m restating the obvious here, but with gold's:
Trends:
ST trend = Up, well-established, steepening, acting as zone of dynamic demand = traders buy the dip = demand-side control ✅
LT trend = Up, well-established, steepening, acting as zone of dynamic demand = funds’ accumulating = demand-side control ✅
Price action: Rising peaks & rising troughs = buy the dip = demand-side control ✅
Candles: Predominance of demand-side candles (i.e. white bodied and or downward pointing shadows) = buy the dip, pervasive programmed buy orders = demand-side control ✅
…it remains a picture of unanimous demand-side control!
Last update, I also remarked just how futile it would be to try to predict when the gold bull market will end. It will end when it ends = Stop worrying about it! 🛑
Sure it looks high / overbought / extended whatever you want to call it... but those are words... they're narratives. Dangerous narratives! Always bring your thinking back to what's happening in the demand-supply environment... and that "remains a picture of unanimous demand-side control".
We'll see in our trends, price action and candles when that's changing – and we will manage our risk accordingly. Until then, it's a case of ditto last update: ✅✅✅ = I prefer to stay the course here (i.e., FRP).
Key levels: 3842.8 is the closest point of demand, the price should not close below here if the demand-side is in control of gold's price; however, it would take a close below the next key point of demand at 3749.7 / short term uptrend ribbon (presently 3705-3780) to nullify the short term uptrend = ⚠️
Silver Futures (Front month, back-adjusted) COMEX
%20COMEX%20chart_6%20Oct.png)
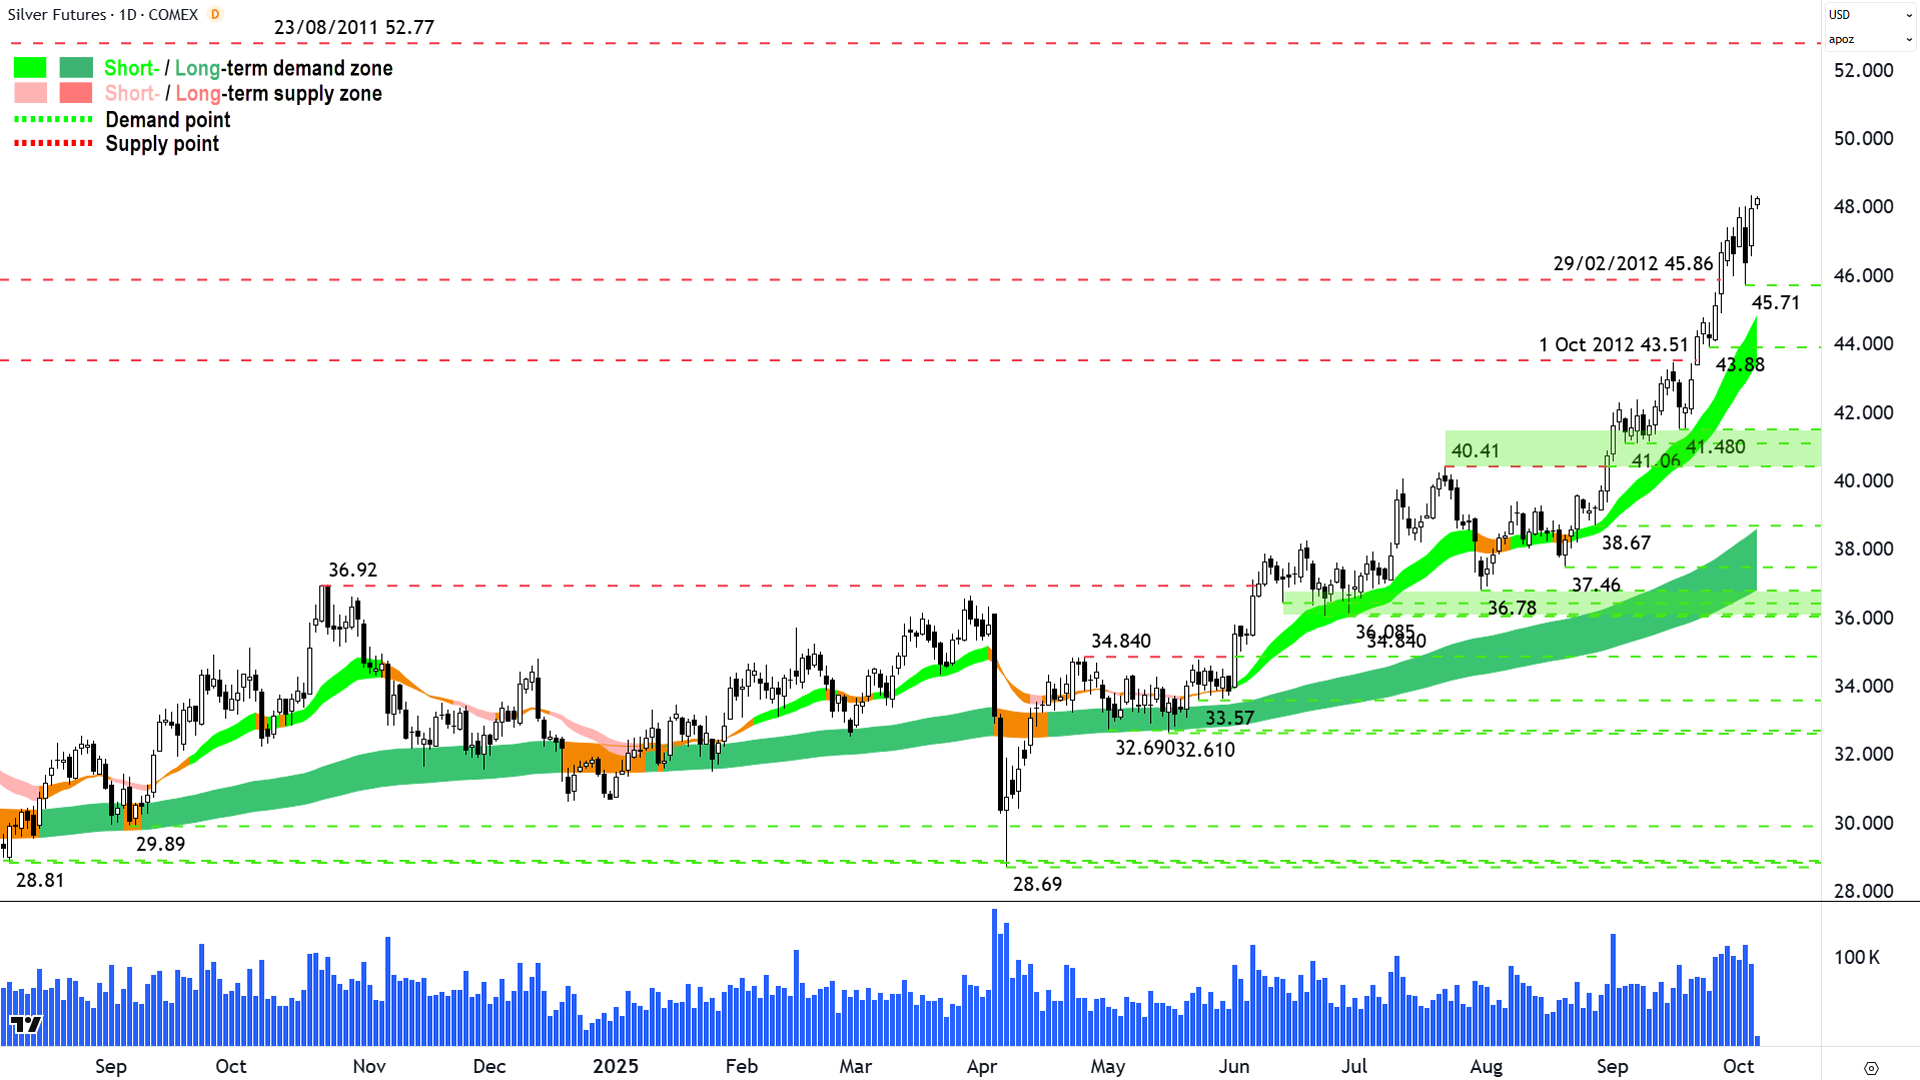
Remains a picture of unanimous demand-side control (click here for full size image)
The last time we covered silver was in ChartWatch Markets on 30-Sep.
In that update, we noted it was a “picture of unanimous demand-side control 💯”.
I feel like I’m restating the obvious here (yes this is a copy and paste – this is deliberate!), but with silver's:
Trends:
ST trend = Up, well-established, steepening, acting as zone of dynamic demand = traders buy the dip = demand-side control ✅
LT trend = Up, well-established, steepening, acting as zone of dynamic demand = funds’ accumulating = demand-side control ✅
Price action: Rising peaks & rising troughs = buy the dip = demand-side control ✅
Candles: Predominance of demand-side candles (i.e. white bodied and or downward pointing shadows) = buy the dip, pervasive programmed buy orders = demand-side control ✅
…it remains a picture of unanimous demand-side control!
Ditto last last update: ✅✅✅ = I prefer to stay the course here (i.e., FRP).
Key levels: 45.71 is the closest point of demand, the price should not close below here if the demand-side is in control of silver's price; however, it would take a close below the next key point of demand at 43.88 / short term uptrend ribbon (presently 43.45-44.80) to nullify the short term uptrend = ⚠️
Platinum Futures (Front month, back-adjusted) COMEX
%20COMEX%20chart_6%20Oct.png)
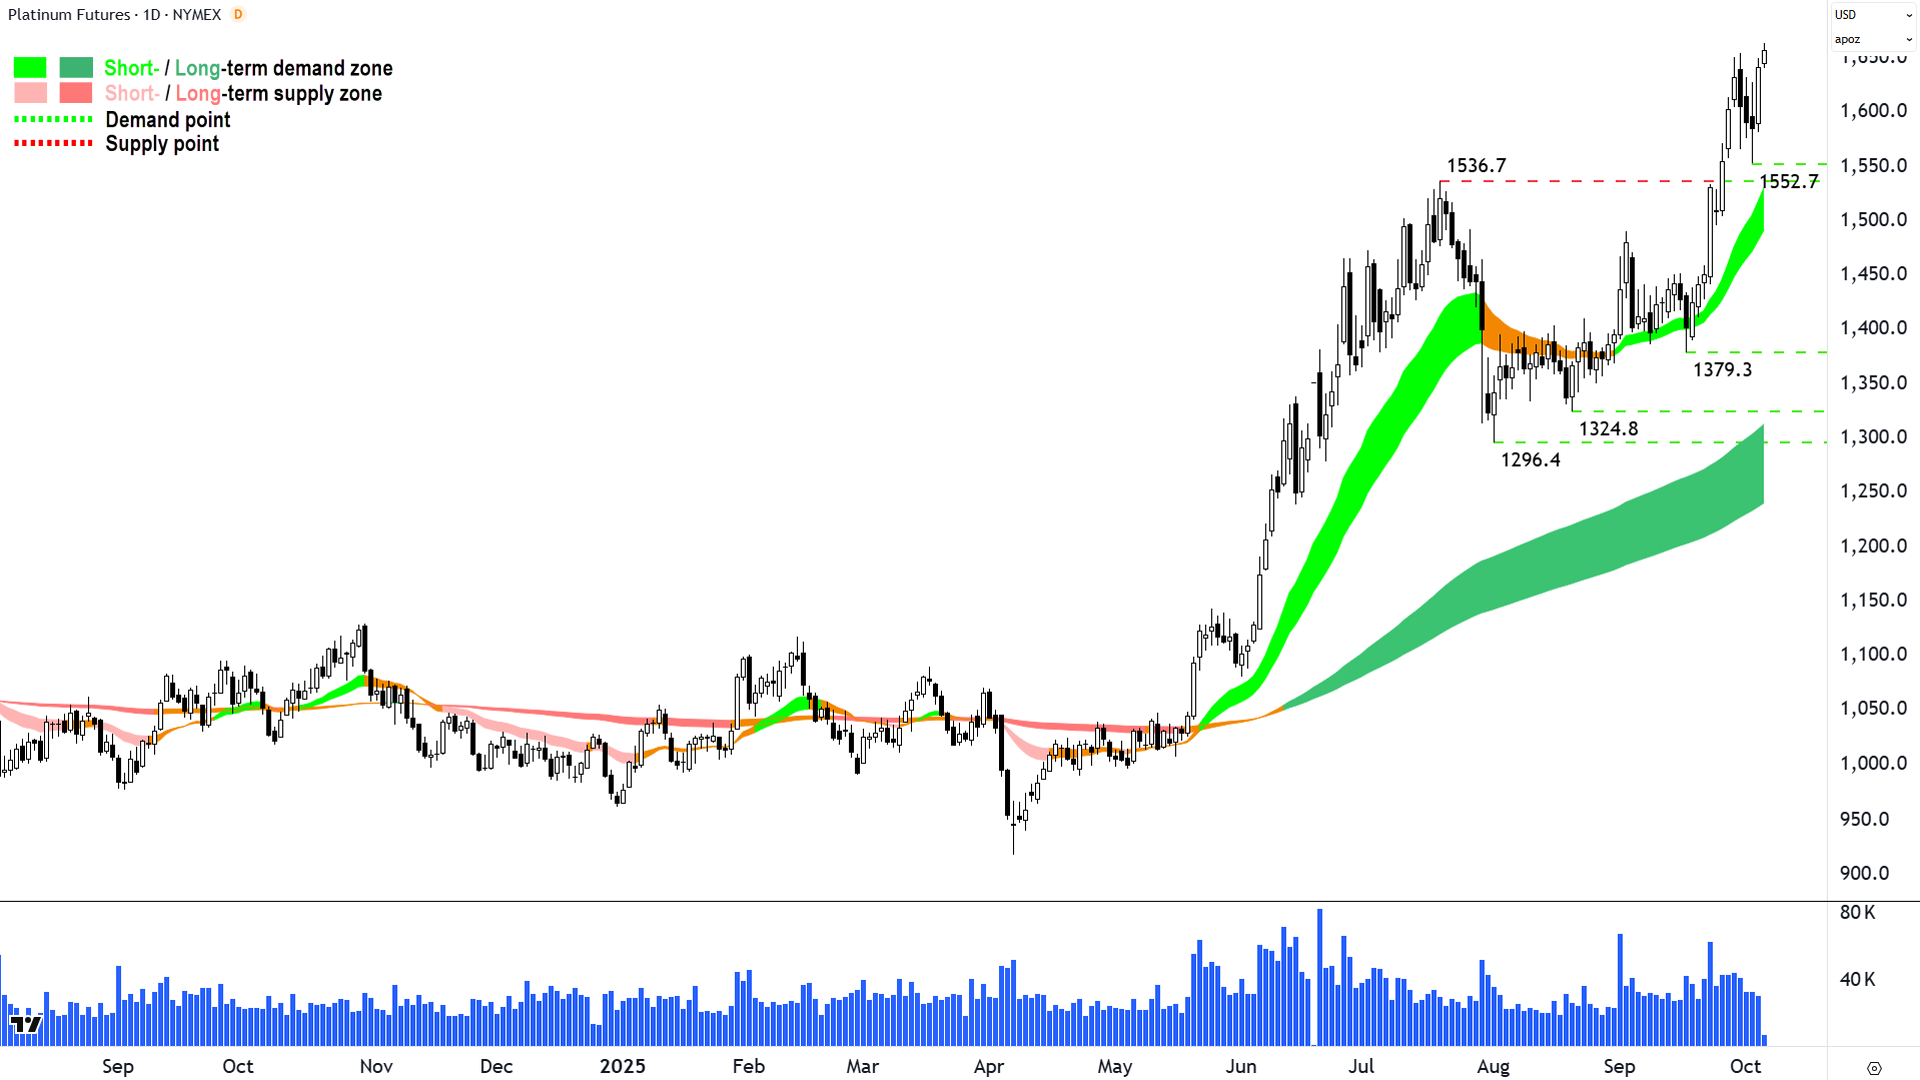
No changes (click here for full size image)
The last time we covered platinum was in ChartWatch Markets on 30-Sep.
Just a quickie here – don’t make me copy and paste a second time! 😉
No changes, trends, price action and candles all point to strong demand-side control.
Ditto last last update: ✅✅✅ = I prefer to stay the course here (i.e., FRP).
Key levels: Major overhead zone of supply 1975-2173. 1552 is the closest point of demand, the price should not close below here if the demand-side is in control of platinum's price; however, it would take a close below the next key point of demand at 1536 / short term uptrend ribbon (presently 1492-1531) to nullify the short term uptrend = ⚠️
ChartWatch *LIVE* Webinar
ChartWatch *LIVE* Webinars – WEEKLY Wednesday's @ 12pm AEDT
Learn more about technical analysis and trend following through real case studies on ASX stocks. Australia's premier technical analyst, Carl Capolingua, shares his unique insights on stocks as requested by viewers. Ask about a company in your portfolio or anything related to trading and investing and get Carl's expert opinion.
Places are limited so >REGISTER NOW!<
