ChartWatch Markets: Copper and iron ore rallies fade, stocks teeter, as investors weigh their next move
Technical analysis of the most important global stock indices, commodities, bonds, FX, and crypto impacting your ASX portfolio each day.


Source: Shutterstock
Mentioned
KEY POINTS
- US stocks are tentatively recovering from Friday’s sharp Trump vs China tariffs sell-off, but arguably their ultimate test is yet to come. This week’s closing sessions could define the stock market’s performance into year end.
- ASX copper and base metals stocks have been soaring, largely due to an improvement in the metal’s pricing on key international commodity markets. But copper prices took a sharp turn for the worse earlier this week and are struggling to recover.
- One could say the same thing for ASX iron ore stocks like BHP, RIO, and FMG – they appear to be growing in favour among investors again. But, like copper, iron ore stumbled this week. What’s in store for US stocks, copper, and iron ore? Read on!
In today's edition of ChartWatch Markets, we'll be covering the technicals for:
Nasdaq Composite
High Grade Copper Futures (Front month, back-adjusted) COMEX
Iron Ore 62% (Front month, back-adjusted) SGX
Nasdaq Composite Index

Nasdaq Composite Index chart (click here for full size image)
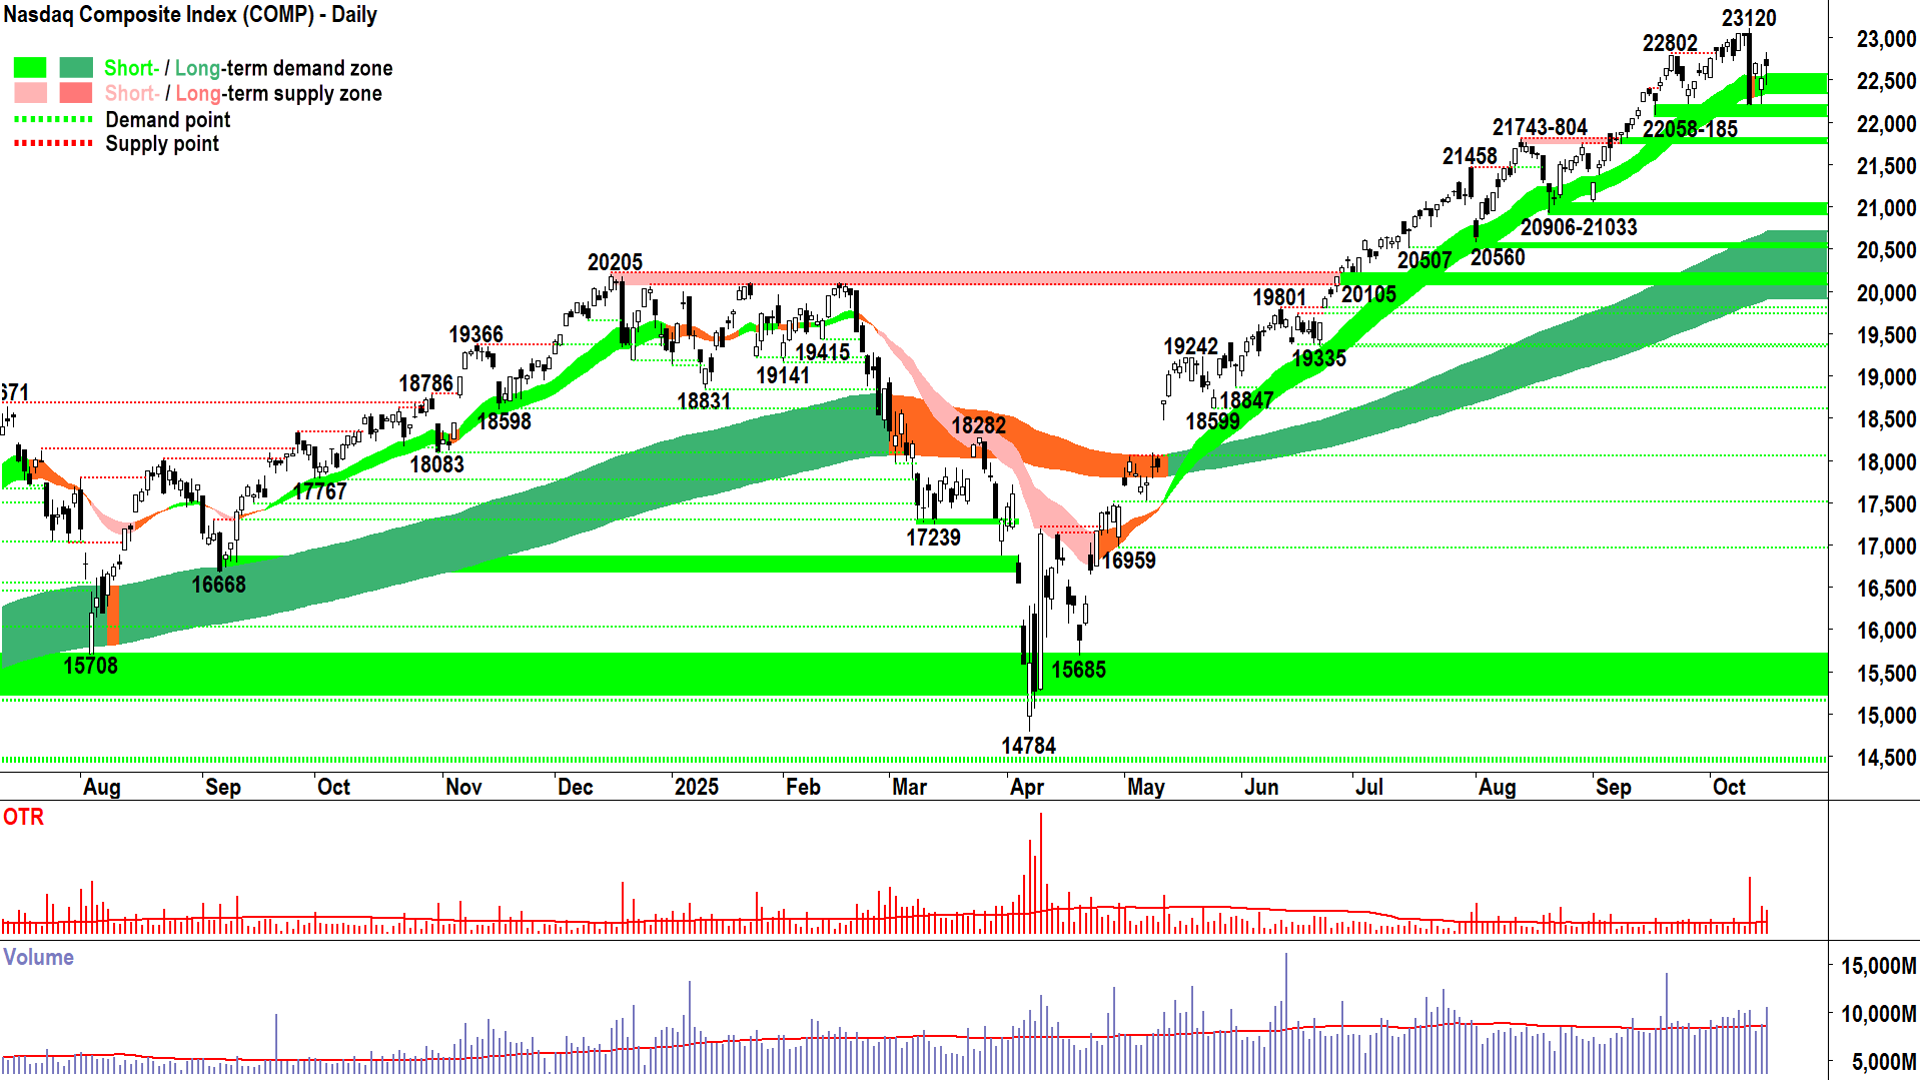
In yesterday's ChartWatch *LIVE* webinar, I noted that Tuesday’s candle was an “indecision” candle. That it had long upward and downward pointing shadows, and whilst the body of the candle was white, there was still a negative change in price versus Monday’s close.
The demand-side and supply-sides both took turns at controlling the price, beat each other up a bit – and then neither was able to retain decisive control by the end of the session.
Wednesday’s candle is similar – both upward and downward pointing shadows, a black body, but a positive shift from the previous close! Importantly though, the downward pointing shadow is substantially longer than its upward pointing counterpart, and the Comp did make some progress in terms of a positive close.
So, I propose we can conclude demand-side control of Wednesday’s trading session, and with very decent volume we can assume that the demand-side cleared out a decent whack of supply.
That’s a big positive when you’re trying to recoup a fall resulting from a major supply-side event like Friday’s 10-Oct candle. Events like that generally create latent supply in the market (e.g., from those who feel like they bought the top and wish to get out as close to breakeven if the price rallies back up there again).
We have to trade with them to get rid of them! So Wednesday’s price action is a positive development. It could have been more positive, of course, by closing right on the high. So, clearly there remains some trepidation among market participants.
Tonight’s candle could confirm one way or the other whether “that candle” on 10-Oct is the beginning of the end of this bull market, or simply the end of the beginning of its first phase that began in April. My hunch is that it will be the latter, but:
We want to see 👏:
A long demand-side candle (i.e., long white body and or downward pointing shadow)
A close near the high of the session, and preferably as close to-or-even-above 23120.
We don’t want to see 🙅:
A long supply-side candle (i.e., long white body and or downward pointing shadow)
A close near the low of the session, and preferably not close to-or-even-below 22058.
View: For now, Wednesday’s candle is a welcome development – yet I remain on heighted alert regardless, because 10-Oct was such a massive supply-side showing. Sill, until I see confirmation of further supply-side control, I will remain FRP (Full Risk Position corresponds to a 100% allowable capital allocation limit for US stocks based on my personal risk management model).
Key levels: 22058 is the closest point of demand, the price should not close below here if the demand-side is in control of the Comp's price; if the Comp's price closes below 22058 the short term uptrend is nullified = ⚠️.
High Grade Copper Futures (Front month, back-adjusted) COMEX
%20COMEX%20chart_16%20Oct.png)
An interesting chart (click here for full size image)
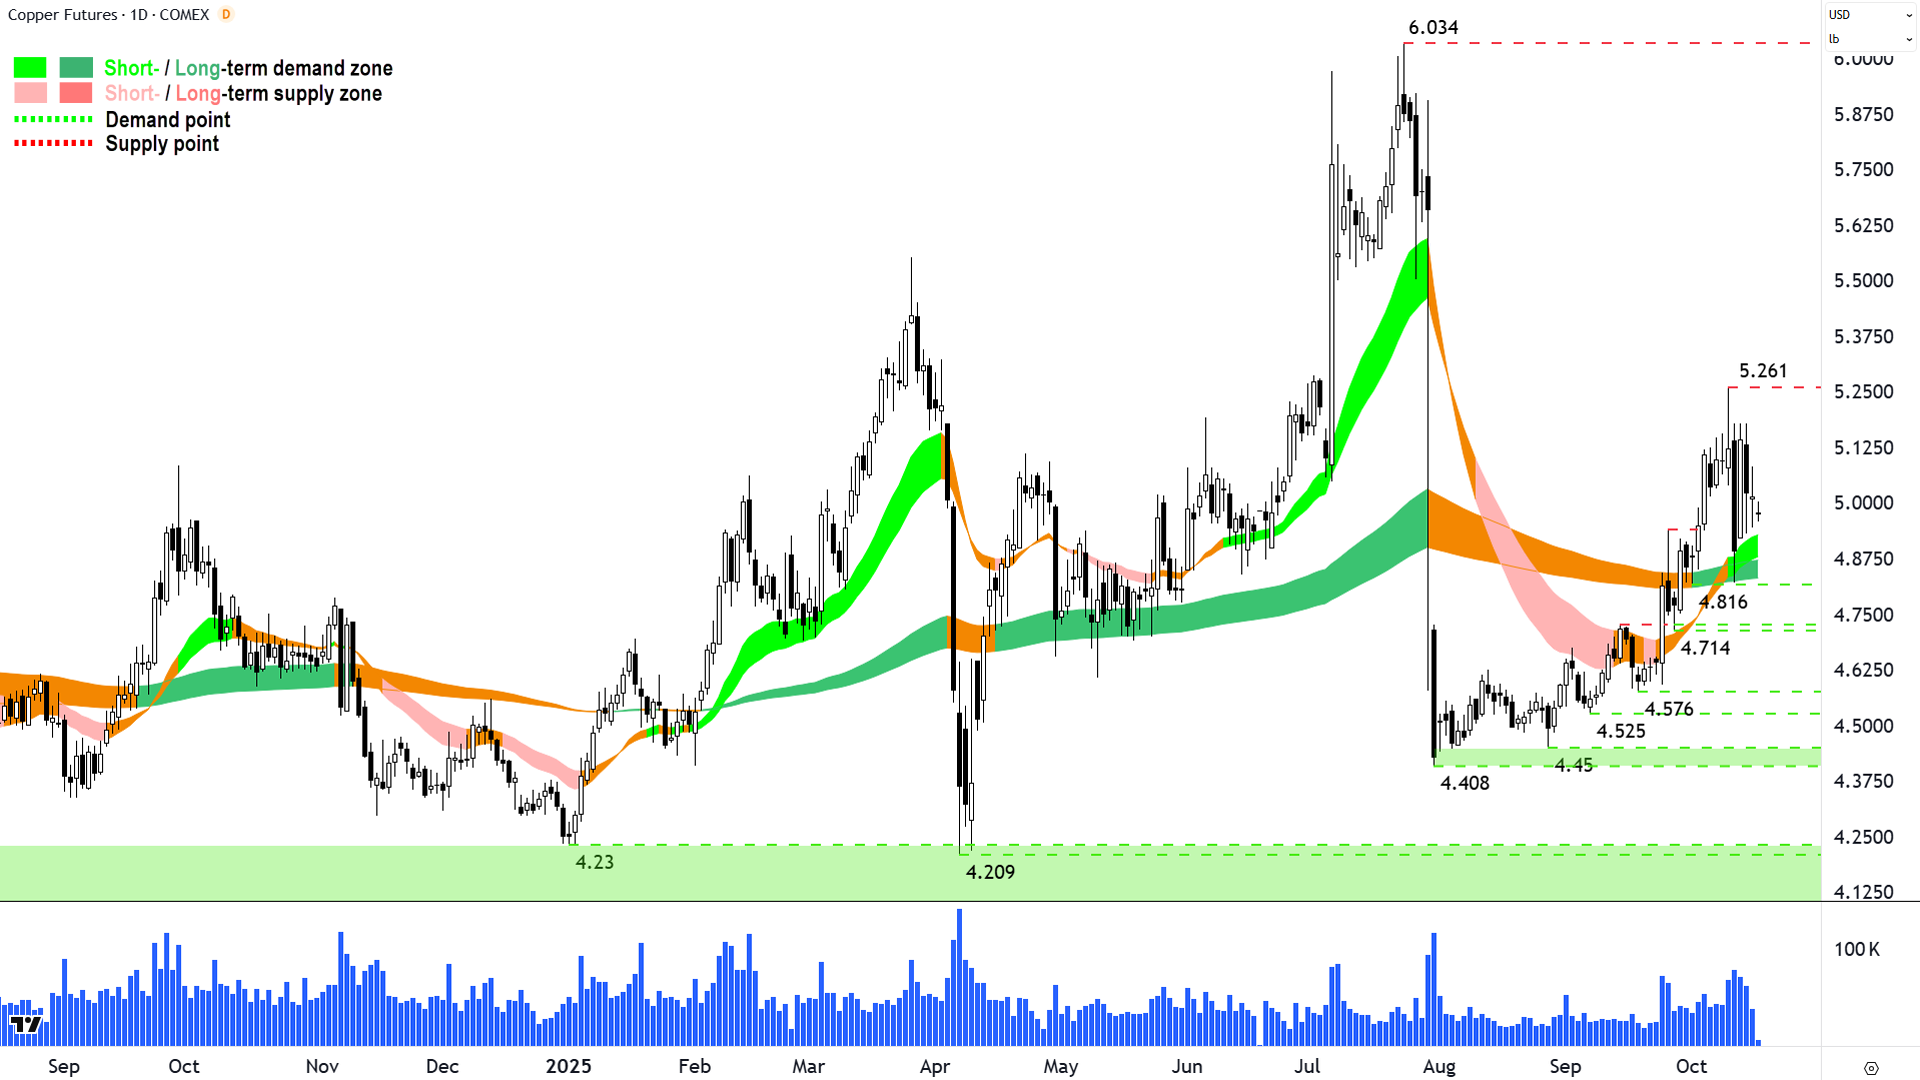
The last time we covered high grade copper was in ChartWatch Markets on 9-Oct.
In that update, we noted it had improved from the reclamation of the long term uptrend ribbon and had continued to travel with solid demand-side price action and candles.
Copper did extend its run from that point to 5.261 – only to be wiped out by last Friday’s latest Trump vs China tariff comments. Whilst the US President TACO’d away from those comments, copper has been unable to recoup its prior bullish momentum.
The chart above is punctuated by the 10-Oct supply-side candle, it locks in 5.261 as a major point of supply going forward. There has been a semblance of a recovery since – mostly the strong demand-side candle on 13-Oct, but candles since are far from decisive.
So, I propose we’re largely stuck in the middle of a new trading range between 4.816 and 5.261, albeit with a modest demand-side slant. “Slant” being the operative word! Because with price action and candles largely shot, I’ll defer to those slightly upwardly slanting short and long term uptrend ribbons and keep the faith on this fledgling copper bull market.
View: As long the copper price continues to close above both trend ribbons, there’s a better than decent chance copper can work through the latent supply created by Trump’s latest shenanigans, and challenge higher retracements of the definitive 6.034 point of supply down the track.
Key levels: 4.816 is the closest point of demand, the price should not close below here if the demand-side is in control of copper's price; this roughly coincides with the bottom of the long term uptrend ribbon (presently 4.831), a close below this level nullifies the short and long term uptrends = ⚠️.
Iron Ore 62% (Front month, back-adjusted) SGX
%20SGX%20chart_16%20Oct.png)
An interesting chart (click here for full size image)
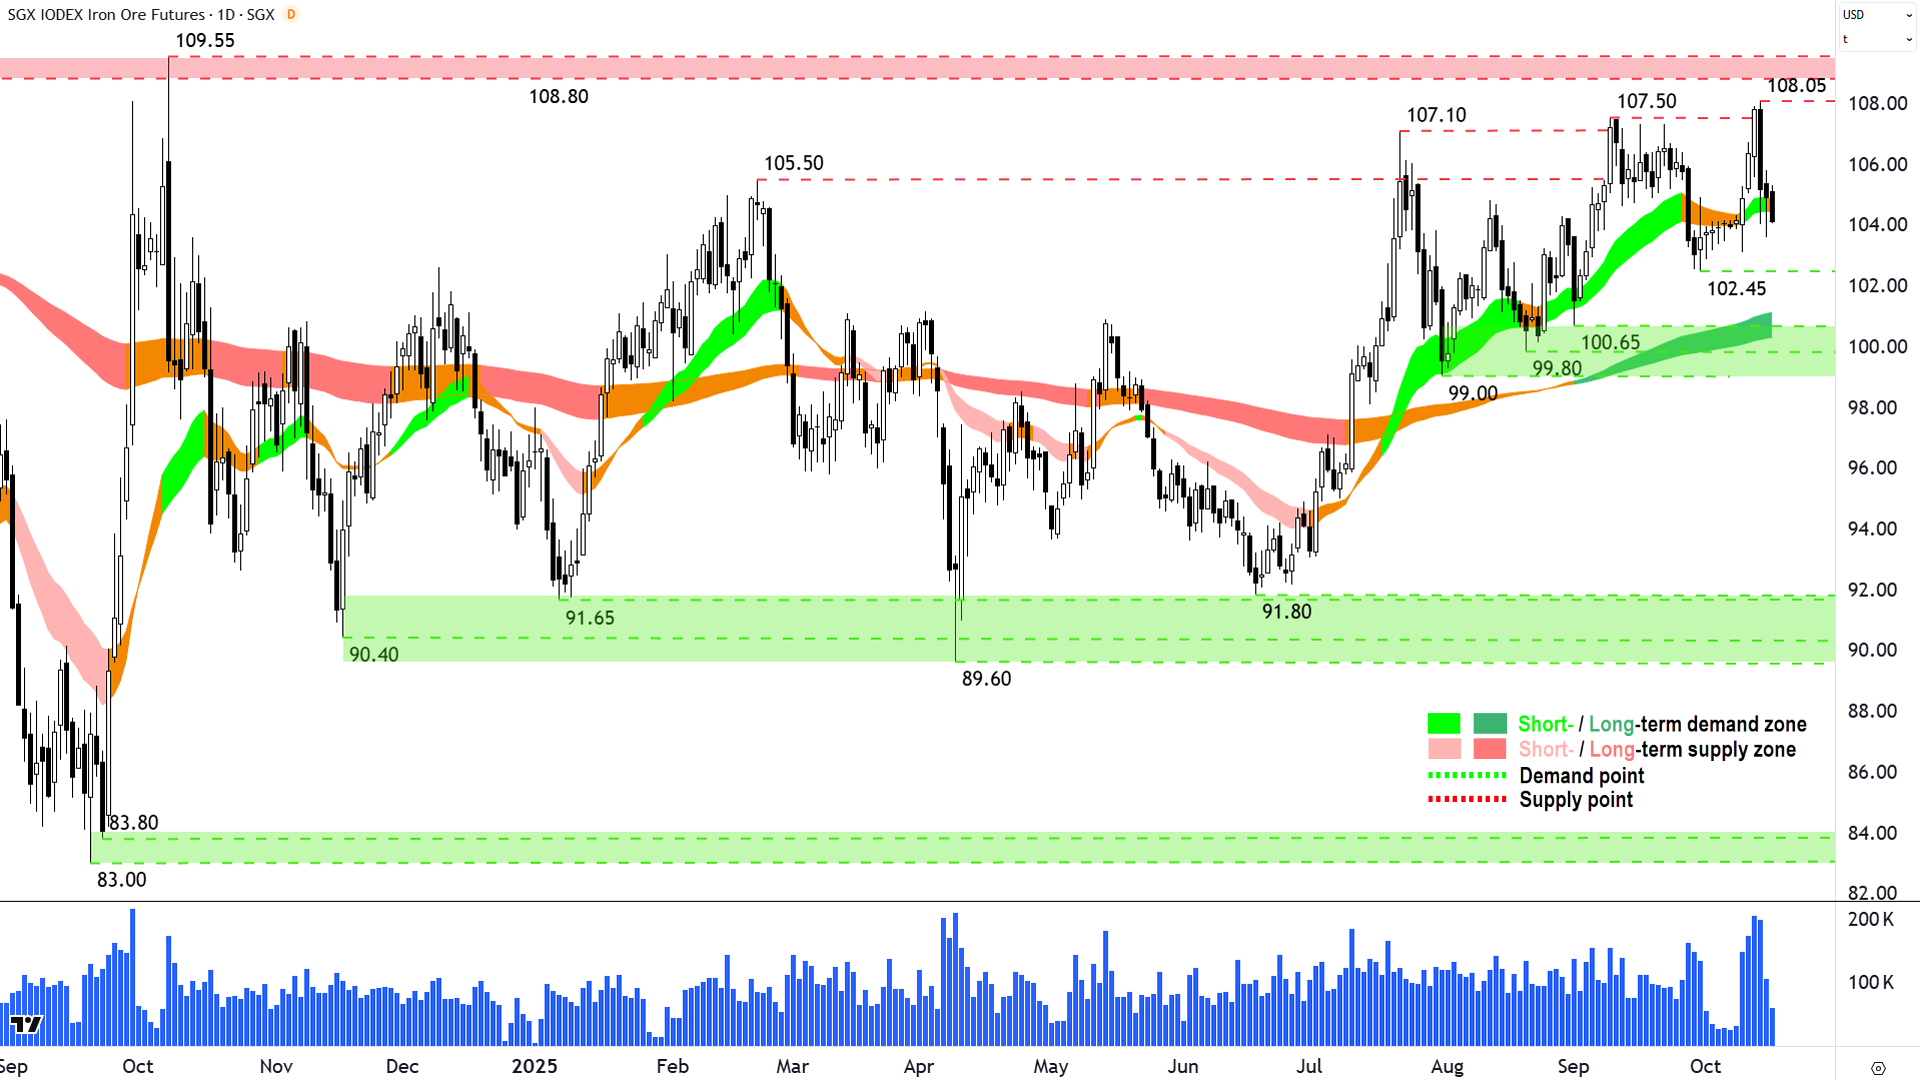
The last time we covered iron ore was also in ChartWatch Markets on 9-Oct.
In that update, we noted it was stuck in the middle of the trading range between excess supply at 108.80-109.55 and excess demand at 99.00-100.65. I tipped it would likely remain there…
Well, here we are a week later – and so far so good on that call!
But, to be fair, old iron ore was looking quite promising just prior to those latest Trump vs China tariff comments. Hey – we don’t get to pick the news that breaks – so we have to expect that some of it is going to mess with our desired chart outcomes! (We don’t get to pick the US President, either! 😭)
With that last promising drive towards the concrete 108.80-109.55 supply zone all but sapped – I have to go ditto on my last iron ore call. Stuck in the range, albeit with a modest upward "slant". There’s that word again!
View: Can I say, that while I can’t see iron ore going anywhere in a great hurry – I do believe that in the medium term it is more likely to challenge that 108.80-109.55 supply zone – and potentially even crack it. This would certainly put the cat among the pigeons! In the meantime, neutral here.
Key levels: 108.80-109.55 is the closest zone of supply. If the iron ore price closes above it, the demand-side has taken control of price. 99.00-100.65 is the closest zone of demand. If the price closes below it, the supply-side has taken control of price = ⚠️.
ChartWatch *LIVE* Webinar
ChartWatch *LIVE* Webinars – WEEKLY Wednesday's @ 12pm AEDT
Learn more about technical analysis and trend following through real case studies on ASX stocks. Australia's premier technical analyst, Carl Capolingua, shares his unique insights on stocks as requested by viewers. Ask about a company in your portfolio or anything related to trading and investing and get Carl's expert opinion.
Places are limited so >REGISTER NOW!<
