ChartWatch Markets: BHP, RIO, FMG, SFR, CSC - bumper ASX iron ore and copper sectors review
Technical analysis of the most important global stock indices, commodities, bonds, FX, and crypto impacting your ASX portfolio each day.


Source: Shutterstock
Mentioned
KEY POINTS
- In today's edition of ChartWatch Markets, we investigate the technical outlook for commodities iron ore and copper as well as those for the ASX's biggest iron ore and copper stocks.
- Keep reading for detailed analysis on BHP, RIO, FMG, SFR, CSC, 29M, and AIS.
- But, as always, we'll kick off with our usual coverage of the irrepressible Nasdaq Composite!
In today's edition of ChartWatch Markets, we'll be covering the technicals for:
Nasdaq Composite
Iron Ore 62% (Front month, back-adjusted) SGX
High Grade Copper Futures (Front month, back-adjusted) COMEX
ASX Iron Ore & Copper Majors: BHP, RIO, FMG, SFR, CSC, 29M, AIS
Nasdaq Composite Index

Nasdaq Composite Index chart (click here for full size image)
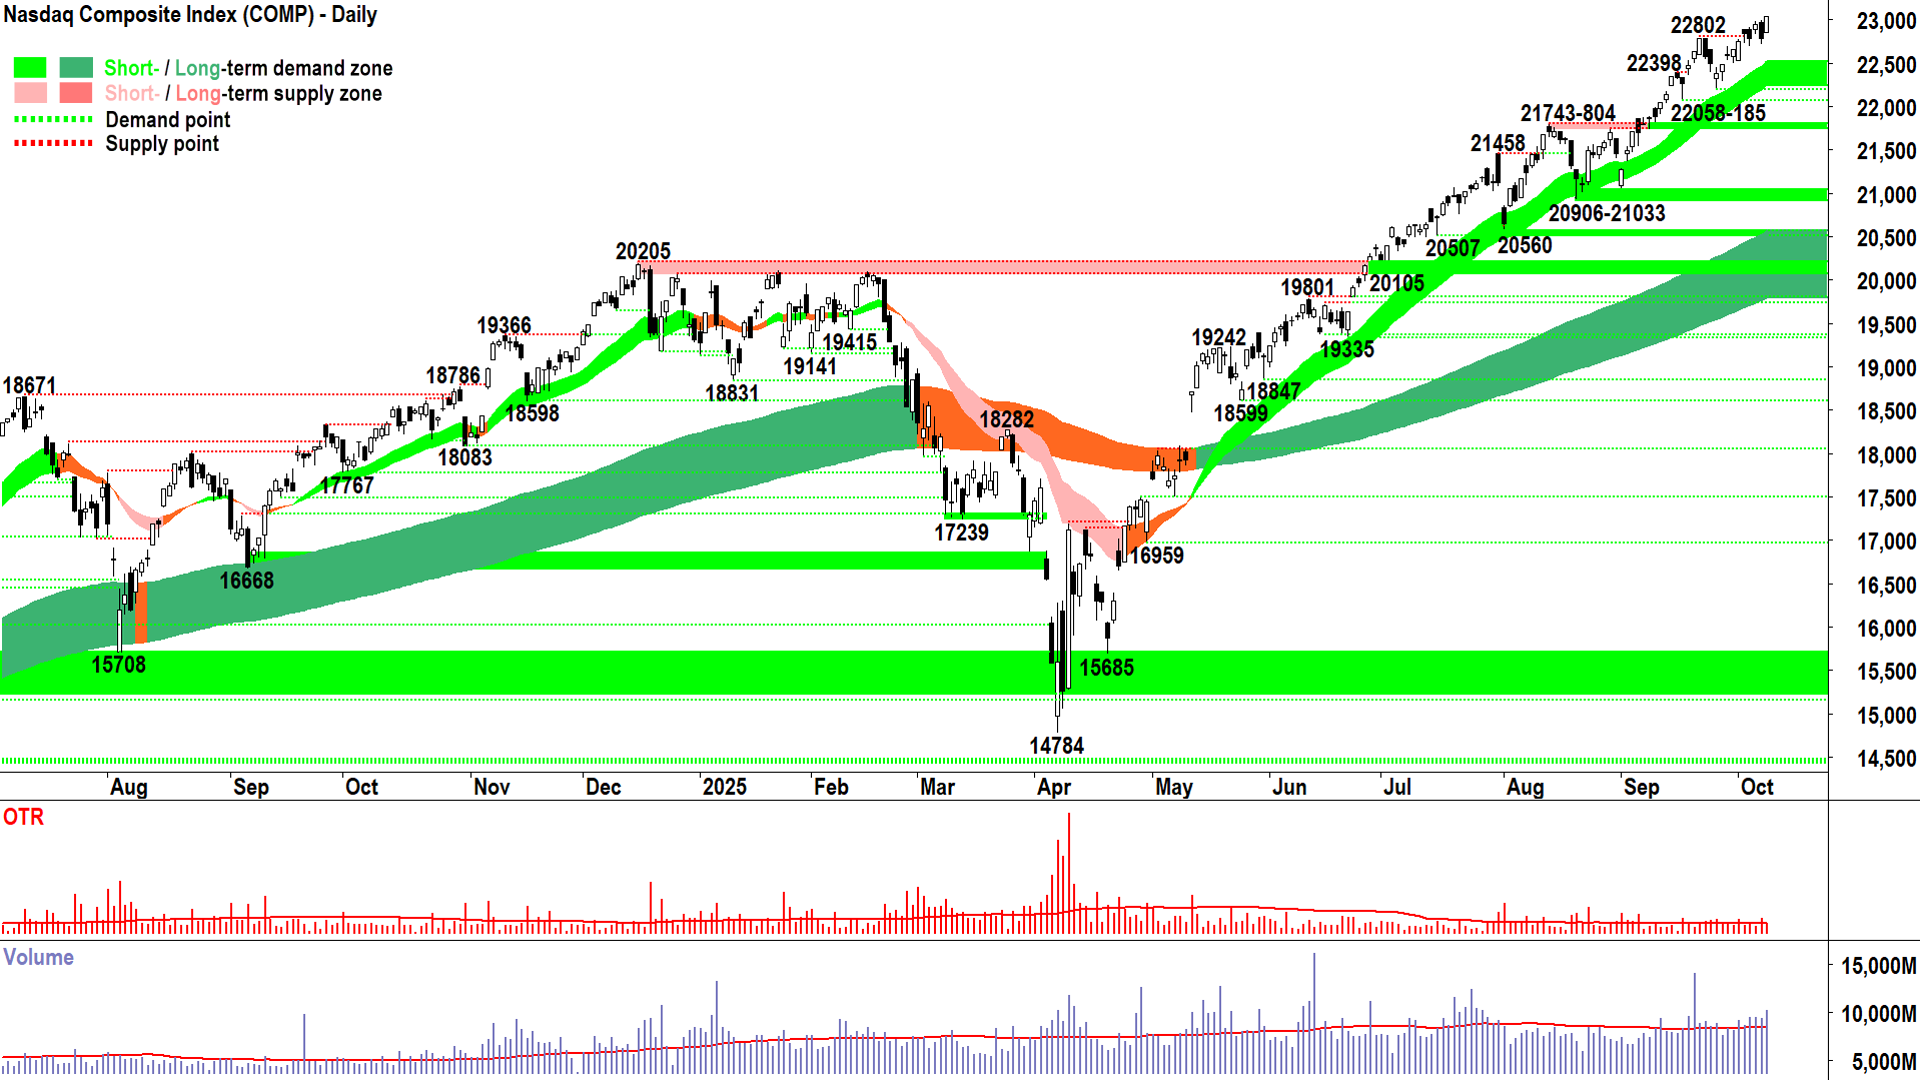
If I hadn’t explained to you my technical analysis model, and if you’d had no experience with my trend ribbons, price action, or candles, you might confuse me with some sort of genius for having predicted the path of the Comp so accurately for as long as… well… as long as you’ve been reading my stuff.
But I have explained to you my model. And I have taught you how to read trends, price action, and candles – and what each means with respect to what’s happening in the demand-supply environment.
So, you can see that I am no genius at all. I have no magic formula for predicting the future path of markets (yet I probably do so more accurately than most value-based or fundamentals-driven analysts! 😉). Heck, even I tell you that I refuse to predict (because prediction is futile!).
Nope, there’s nothing particularly special about my approach at all – nor is it something that the next person can't do with exactly the same success.
Because it’s based on the most basic premise of economics (since economics was metred in skins and salt): Demand vs Supply = Price 💯.
So, for every clickbait headline you’ve seen in the financial media decrying this bull market and predicting its impending demise, and for every 'expert' that’s quoted a Buffett-ism about how we’ll all be “caught swimming naked when the tide goes out” (because the market P/E Ratio or the Shiller Ratio is a zillion!)… ladies and gentlemen… I give you the Nasdaq Composite chart for 8 October 2025.
The Comp's chart is a picture of excess demand. Of total and utter demand-side control. Of a supply-side that is as complicit in its movement – or unwilling or powerless to stop it.
I can’t tell you where it’s going next, because that would be a waste of both of our time (i.e., my time in making the prediction and your time in reading my arrogant-to-believe-I-can-predict-the-future drivel).
I can only tell you how the Comp got here:
Short and long term trend ribbons: ⬆️ / ⬆️, widening (strengthening), each is acting as a zone of dynamic excess demand = Consistent with demand-side control ✅.
Price action: Rising peaks and rising troughs (i.e., supply removal and demand reinforcement) = Consistent with demand-side control ✅.
Candles: Predominantly demand-side in nature (i.e., white-bodied candles and or downward pointing shadows) = Consistent with demand-side control ✅.
✅✅✅ = I prefer to stay the course here at FRP (Full Risk Position = My personal allowable capital allocation limit for my investments in US stocks is 100%).
That's it, that's all I need to know. For now. Because we both know this trend is going to change at some point. And, meh – we'll deal with that then... because when it does change, we'll see it in how demand and supply manifest themselves in the trends, price action, and candles 💪.
Key levels: 22058-185 is the closest zone of demand, the price should not close below here if the demand-side is in control of the Comp's price; alternatively, a close below the short term uptrend ribbon (presently 22240-22515) will also nullify the short term uptrend = ⚠️
Iron Ore 62% (Front month, back-adjusted) SGX
%20SGX%20chart_9%20Oct.png)
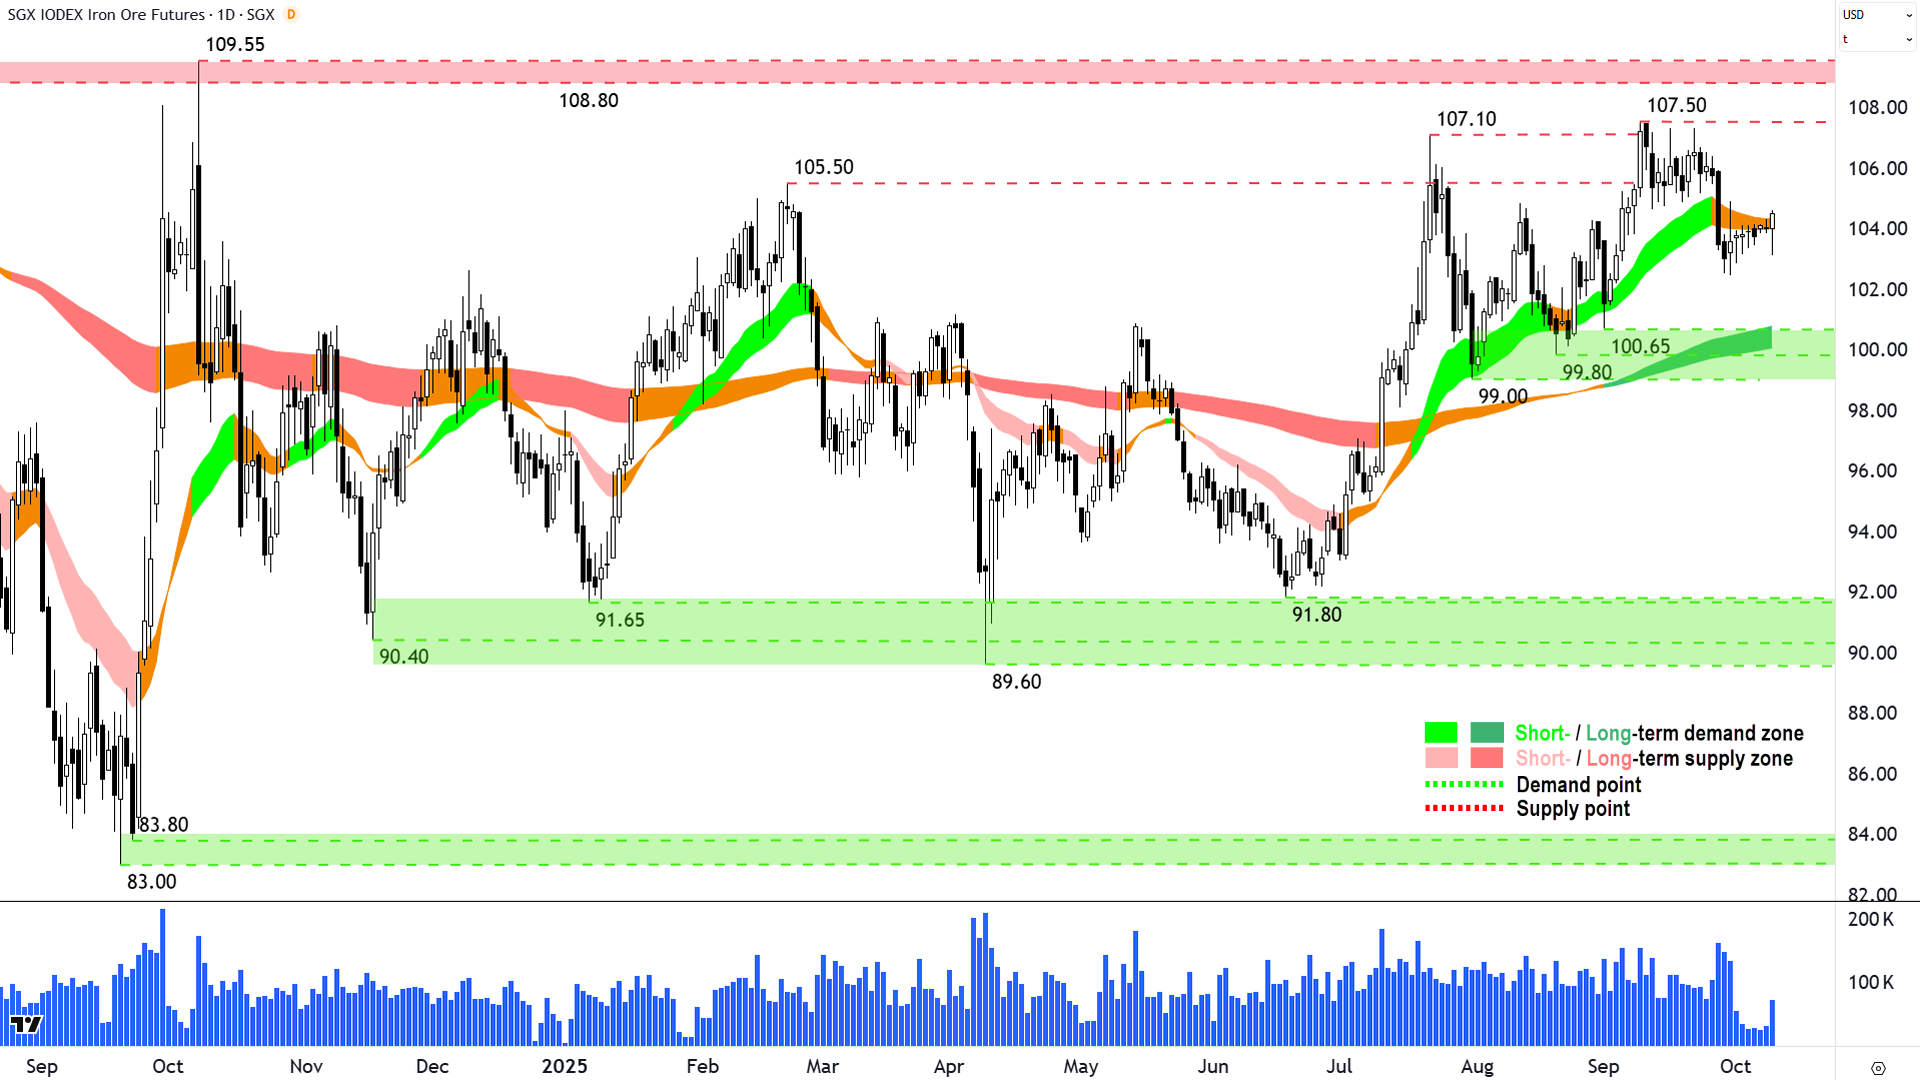
An interesting chart (click here for full size image)
The last time we covered iron ore was in ChartWatch Markets on 2-Oct.
In that update, we noted decade-plus strength in Chinese stock markets (including a key mainland property index) had not yet rubbed off here.
I’ll cover those markets again in tomorrow’s update, they’re breaking higher again upon their return from Golden Week holidays – but with candles still live – it’s best to leave that analysis until after this session’s close.
If there’s a link between rampaging Chinese stock markets and iron ore, it’s no here yet (historically, there is somewhat of a delayed reaction…but it can be many months delay).
Iron ore remains stuck in the middle between excess supply at 108.80-109.55 and excess demand at 99.00-100.65.
The short term trend is faltering, and the price action has broken down on an at least short term return to a predominance of supply-side candles (i.e., those with black bodies and or upward pointing shadows).
I’m not going to read too much (anything) into those moderately bearish developments whilst 99.00-100.65 holds. My tip: Iron ore to remain stuck in the middle of the trading range… No risk exposure required here in my opinion.
Key levels: 108.80-109.55 is the closest zone of supply. If the iron ore price closes above it, the demand-side has taken control of price. 99.00-100.65 is the closest zone of supply. If the price closes below it, the supply-side has taken control of price = ⚠️.
High Grade Copper Futures (Front month, back-adjusted) COMEX
%20COMEX%20chart_9%20Oct.png)
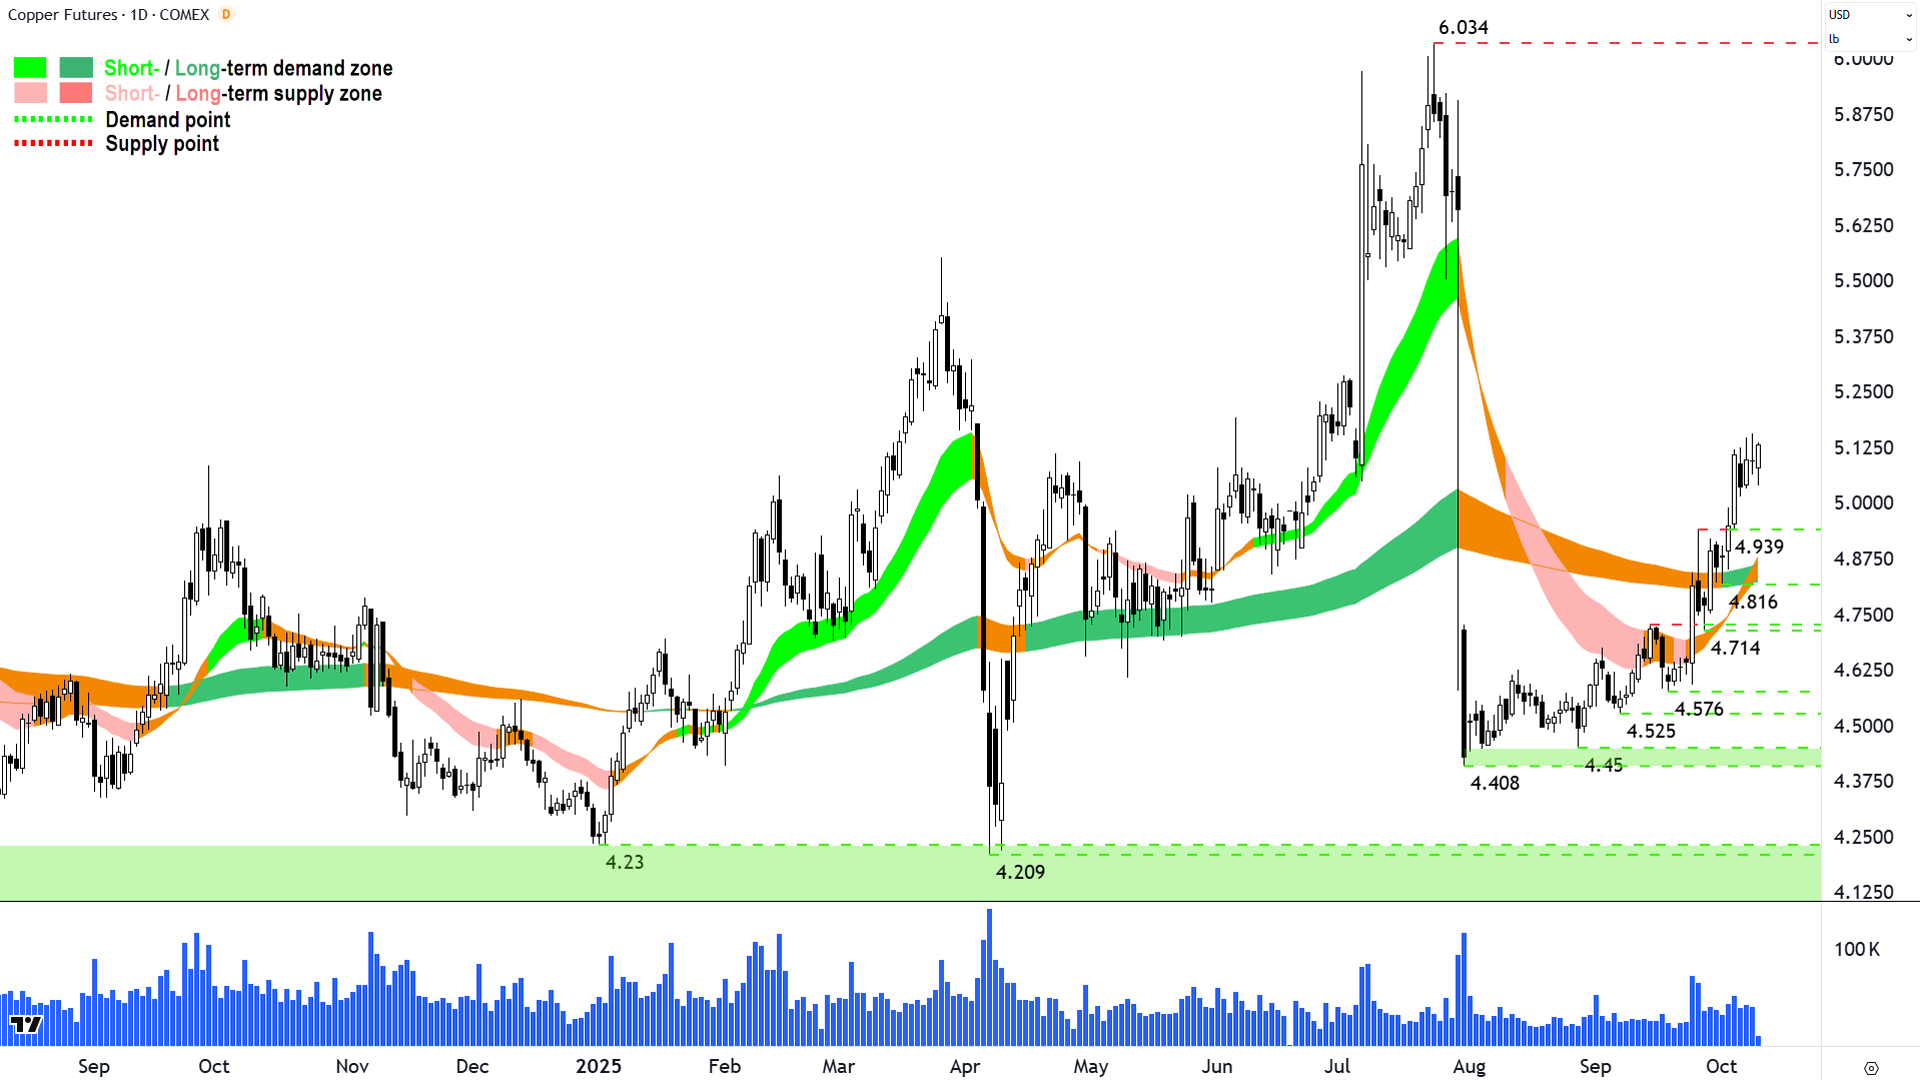
An interesting chart (click here for full size image)
The last time we covered high grade copper was in ChartWatch Markets on 3-Oct.
In that update, we noted the start of a new long term demand-side market with the price reclaiming the long term uptrend ribbon and that ribbon seemingly transitioned to a zone of dynamic demand (this is fancy talk for the price is bouncing up off the long term trend ribbon!).
This is a critical turning point in the demand-side environment for me – it green lights the addition of risk (last week I confirmed “a more risk seeking stance” on copper).
Since that update, copper has continued higher under its new regime of demand-side control, logging a dominant demand-side candle (long white body) on 3-Oct. The supply-side’s response since that move (there’s always going to be a degree of supply-side response after any rapid price increase) has been muted – nothing more than a few mixed candles.
Which means, there’s not much of a supply-side response at all! Read this as, there’s not a great deal of resistance to the demand-side's motived push higher.
Today’s candle is still live – so we must discount it. However, should it close as good as it looks right now (downward pointing shadow, white body, close near high) – then it likely serves as a signal the disequilibrium between demand and supply is reestablished, and prices are ready to again move higher.
View: With a new and developing short term uptrend, the long term trend ribbon transitioning back to up, rising peaks and rising troughs in the price action, and a predominance of demand-side candles: I remain comfortable continuing to add risk here.
Key levels: 4.939 is the closest point of demand, the price should not close below here if the demand-side is in control of high grade copper's price; alternatively, a close below the short term uptrend ribbon (presently 4.84-4.88) will also nullify the short term uptrend = ⚠️
ASX Iron Ore & Copper Majors
Given the two commodities I've chosen to to investigate today, it makes sense to check out the charts of the ASX's major iron ore and copper stocks – the first two: BHP Group (BHP) and Rio Tinto (RIO) – are essentially dual themed! I'll provide a quick technical reader on each, focussing on trends, price action, candles... and of course my personal preference towards adding, maintaining or reducing risk 🧐.
BHP Group (ASX: BHP)
%20daily%20chart%209%20October%202025.png)
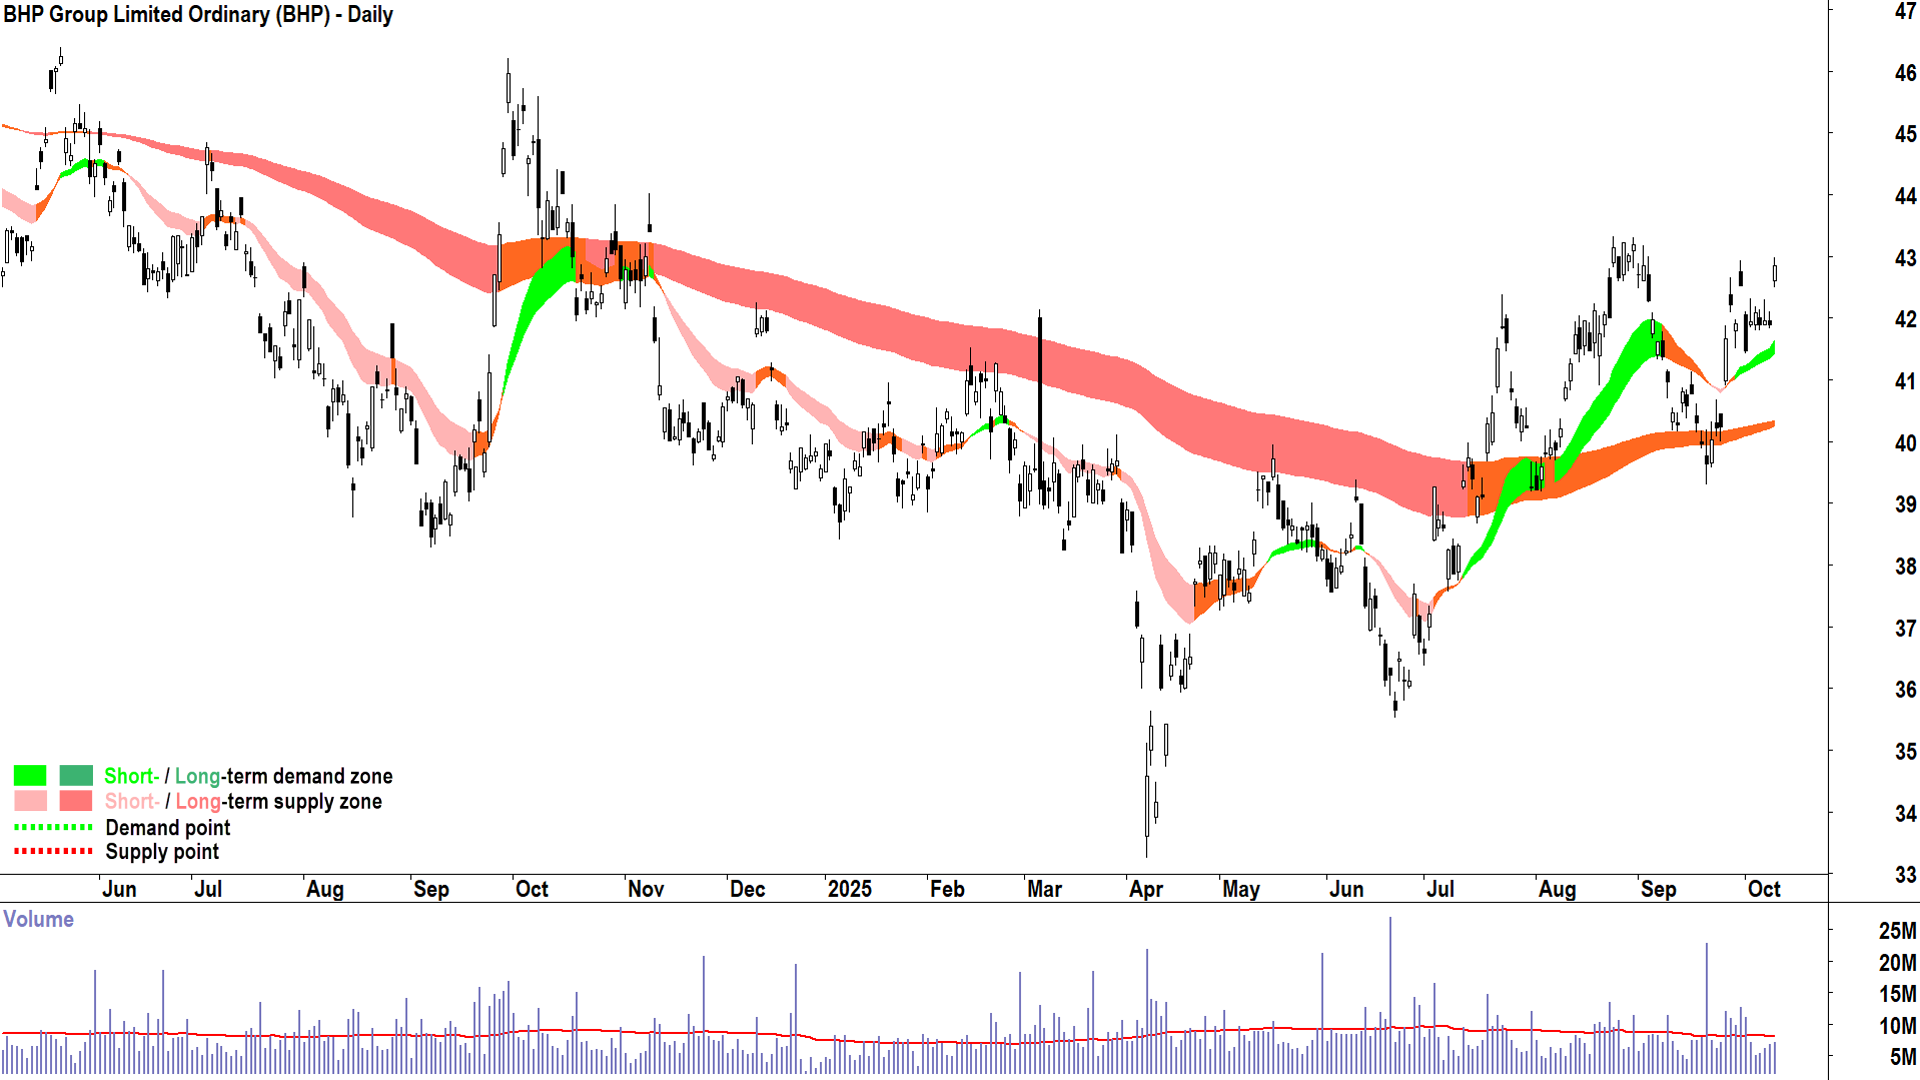
BHP Group chart (click here for full size image)
ST/ LT Trends: ⬆️ / ↔️
Price Action: Mixed, rising peaks and falling troughs, but let's call this a "consolidation" below the 25-Aug 43.34 point of supply – and therefore constructive. The sharp rally / bounce off the long term uptrend ribbon is a positive. I can go a "pass mark" here.
Candles: I think predominantly demand-side in nature since that last bounce off the long term trend ribbon ✅.
View: Better than half-decent, but is that enough? 🤔 Is it enough to go for "the one that hasn't run yet"? Why hasn't it run? There are bigger and better shows in this space... and I'm always reluctant to play the laggard for laggard's sake! Still, no objections to maintaining/adding risk here.
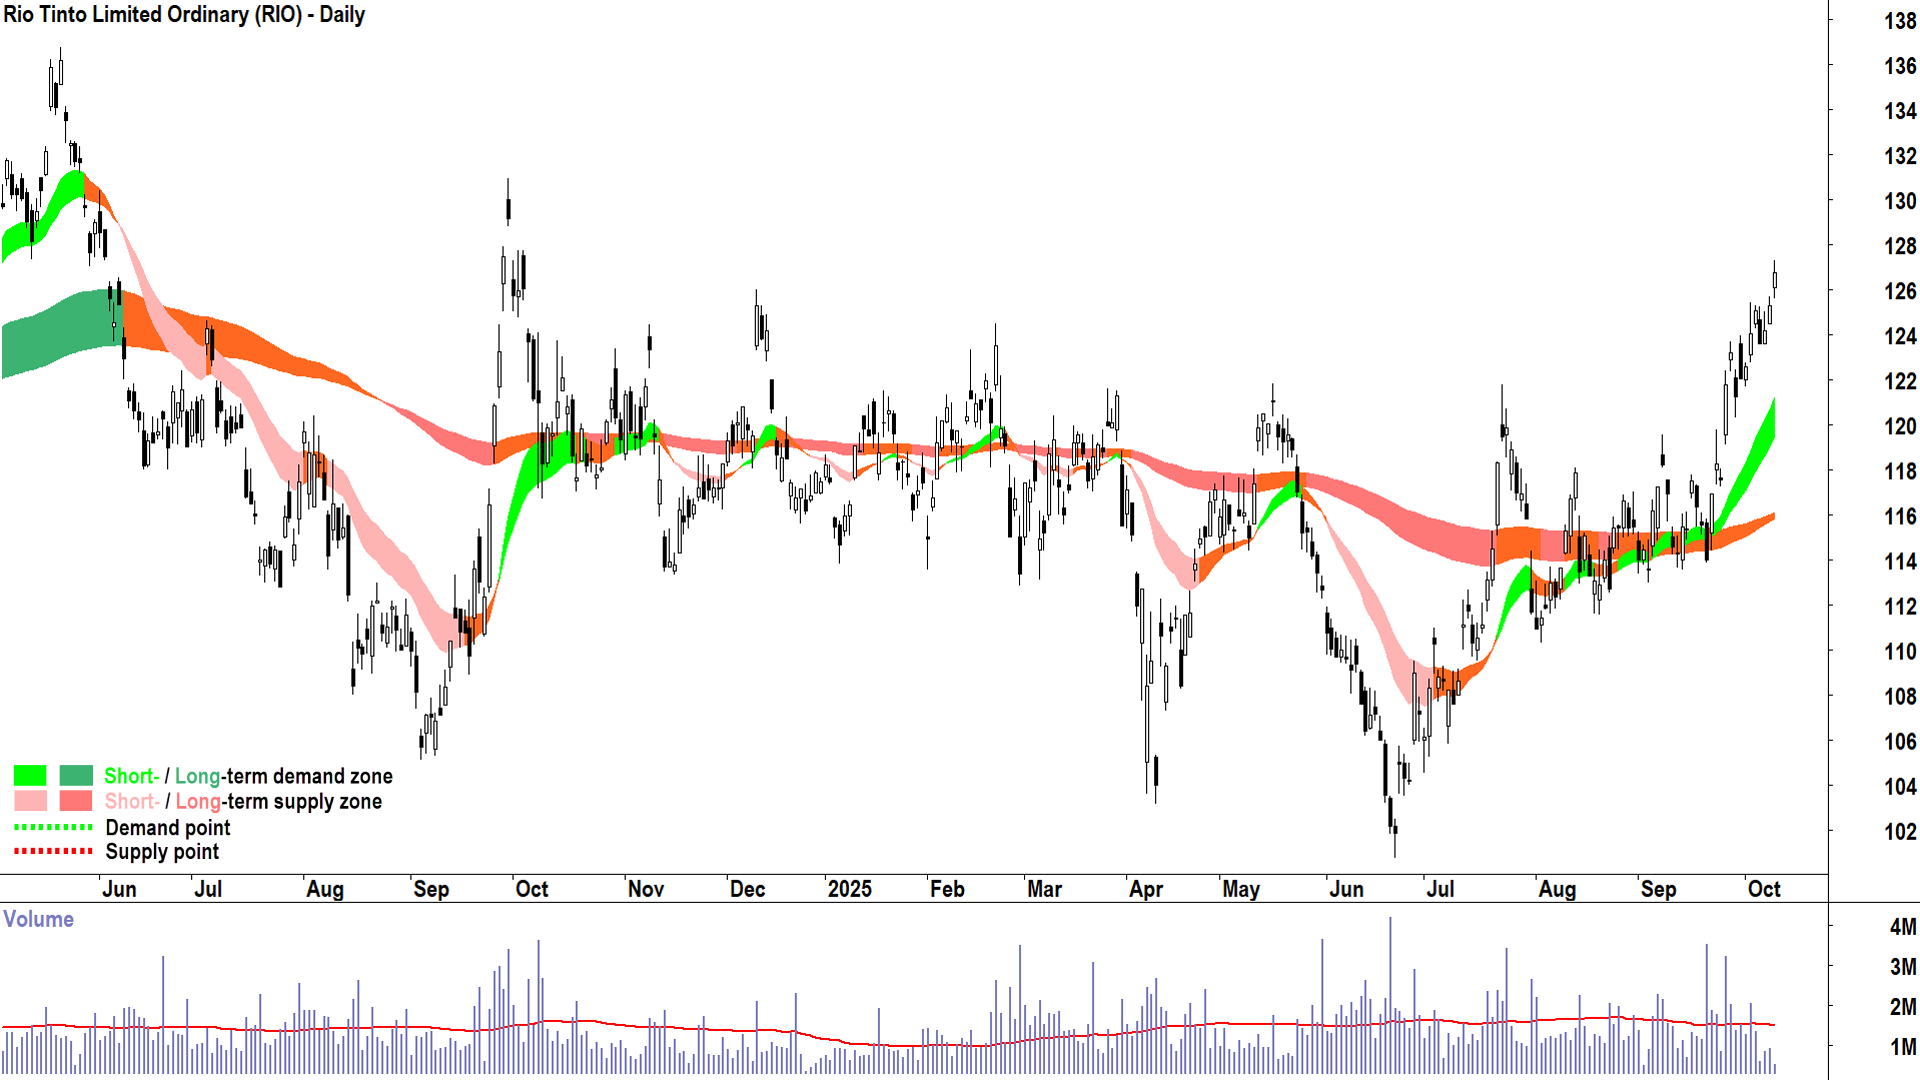
Rio Tinto (ASX: RIO)
%20daily%20chart%209%20October%202025.png)
Rio Tinto chart (click here for full size image)
ST/ LT Trends: ⬆️ / ⬆️ ✅
Price Action: Rising peaks and rising troughs 📈. The sharp rally / bounce off the long term uptrend ribbon is a positive ✅.
Candles: I think predominantly demand-side in nature since that last bounce off the long term trend ribbon ✅.
View: Has appeared in ChartWatch ASX Scans Uptrends Scan List a few times over the last couple of weeks, so clearly back to meeting my criteria for maintaining/adding risk.
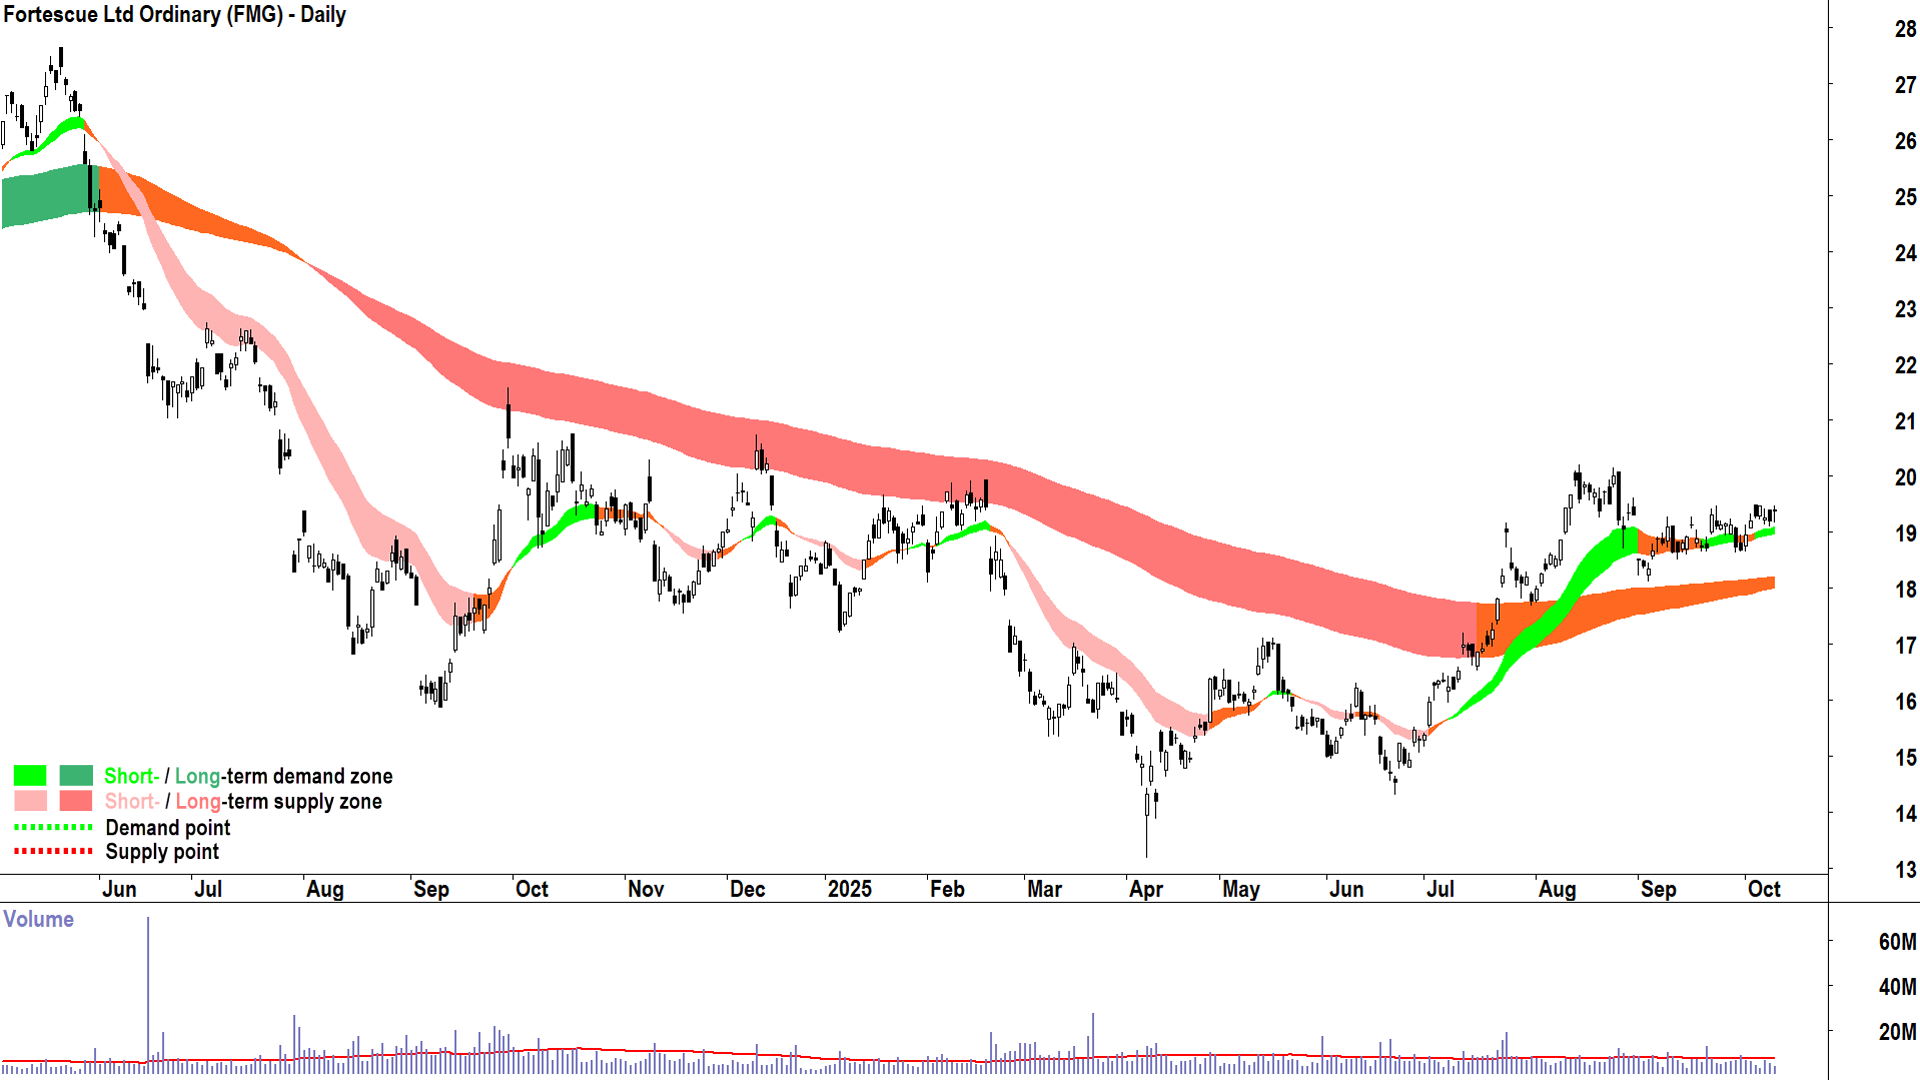
Fortescue (ASX: FMG)
%20daily%20chart%209%20October%202025.png)
Fortescue chart (click here for full size image)
ST/ LT Trends: ⬆️ / ↔️
Price Action: Mixed, slight upwards bias. I can give this one a pass mark as well, but it's hardly knocking my socks off...compare to BHP and RIO – there's a notable lack of a sharp move over the last couple of weeks – suggests substantially less urgency amongst the demand-side here...
Candles: Mixed. Zebra stuff ⬜⬛⬜⬛.
View: I can see a path to maintaining one's risk position here – but there's little reason to be adding risk in my opinion.
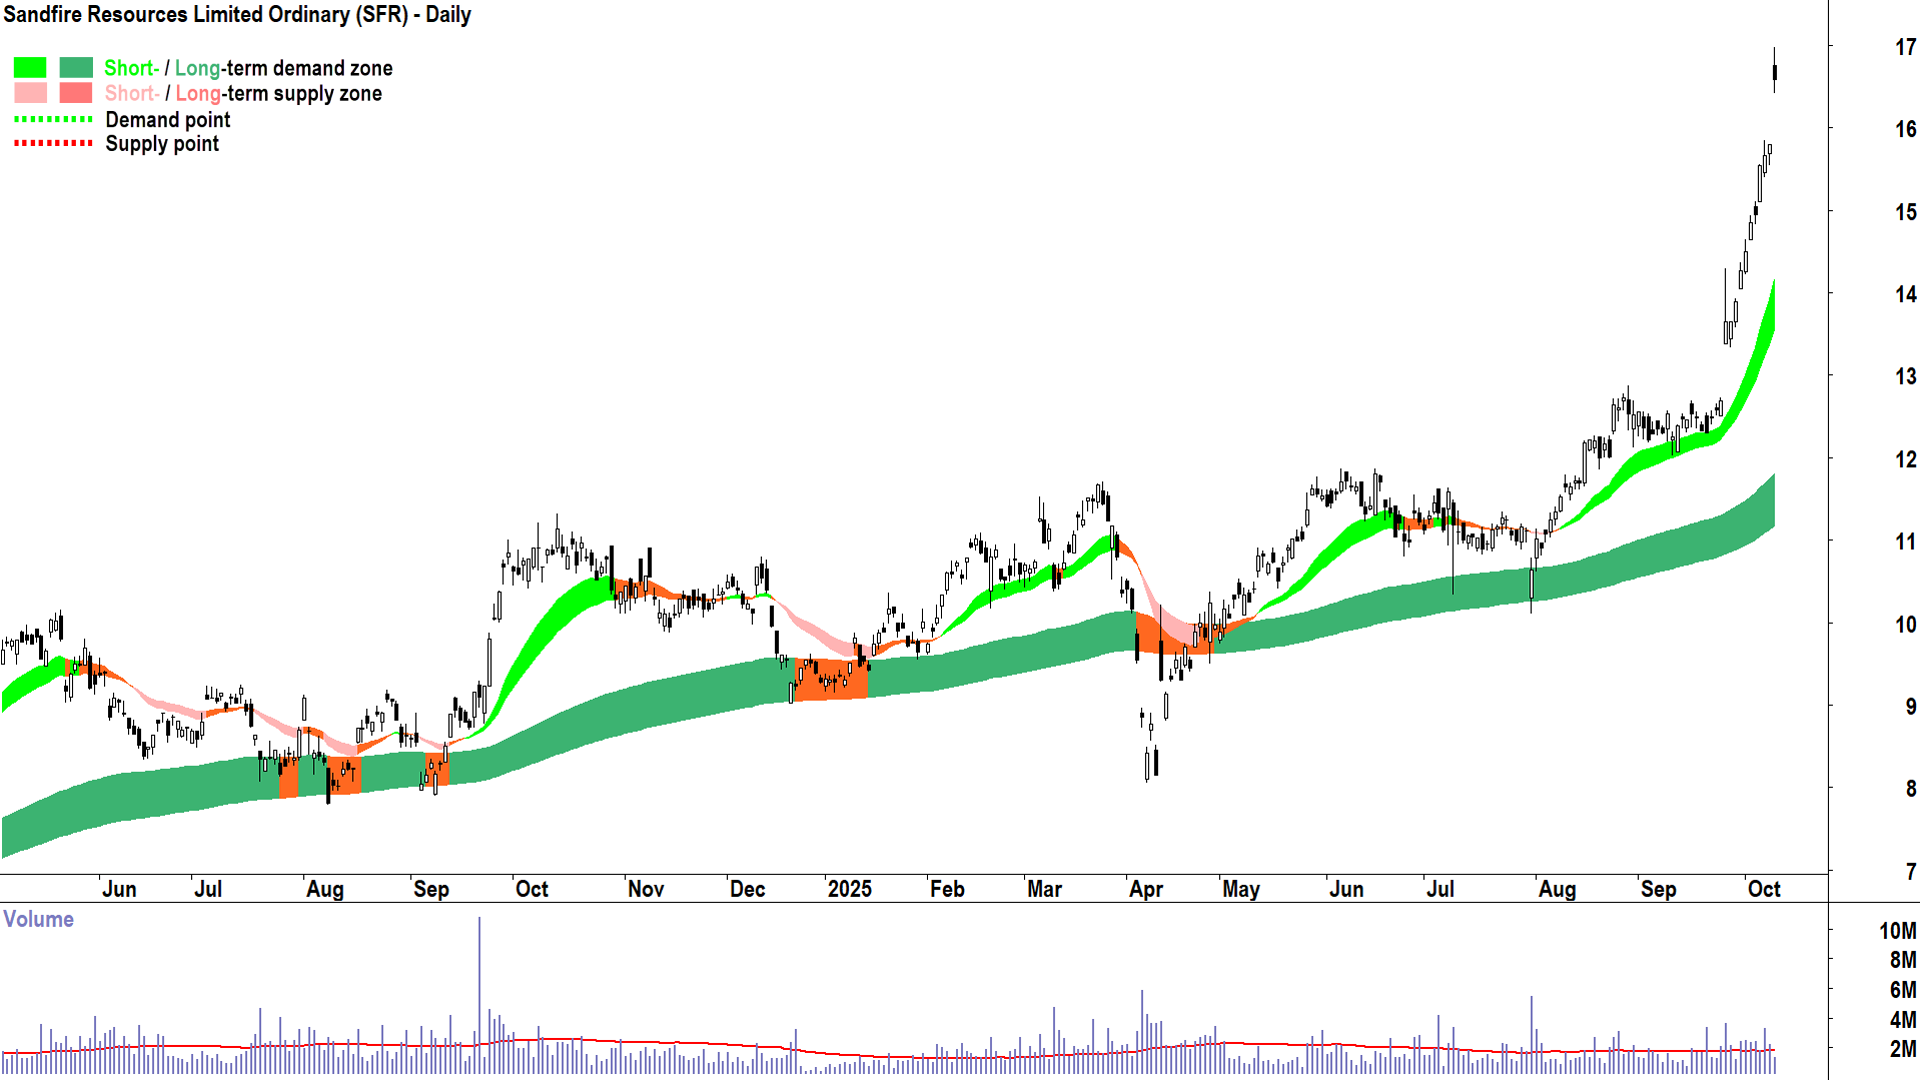
Sandfire Resources (ASX: SFR)
%20daily%20chart%209%20October%202025.png)
Sandfire Resources chart (click here for full size image)
ST/ LT Trends: ⬆️ / ⬆️ ✅
Price Action: Rising peaks and rising troughs 📈. The steepness of the rally demonstrates strong excess demand ✅.
Candles: Predominantly demand-side in nature ✅.
View: Has appeared in ChartWatch ASX Scans as a Feature Uptrend (i.e., highest conviction) 9 times over the last several months, and as recently as today's edition. A picture of excess demand, and therefore clearly still meeting my criteria for maintaining/adding risk.
Capstone Copper Corp. (ASX: CSC)
%20daily%20chart%209%20October%202025.png)
Capstone Copper Corp. chart (click here for full size image)
ST/ LT Trends: ⬆️ / ⬆️ ✅
Price Action: Rising peaks and rising troughs 📈. The steepness of the rally demonstrates strong excess demand ✅.
Candles: Predominantly demand-side in nature ✅.
View: Has appeared in ChartWatch ASX Scans as a Feature Uptrend (i.e., highest conviction) 4 times over the last several months, and as recently as Monday's edition. A picture of excess demand, and therefore clearly still meeting my criteria for maintaining/adding risk.
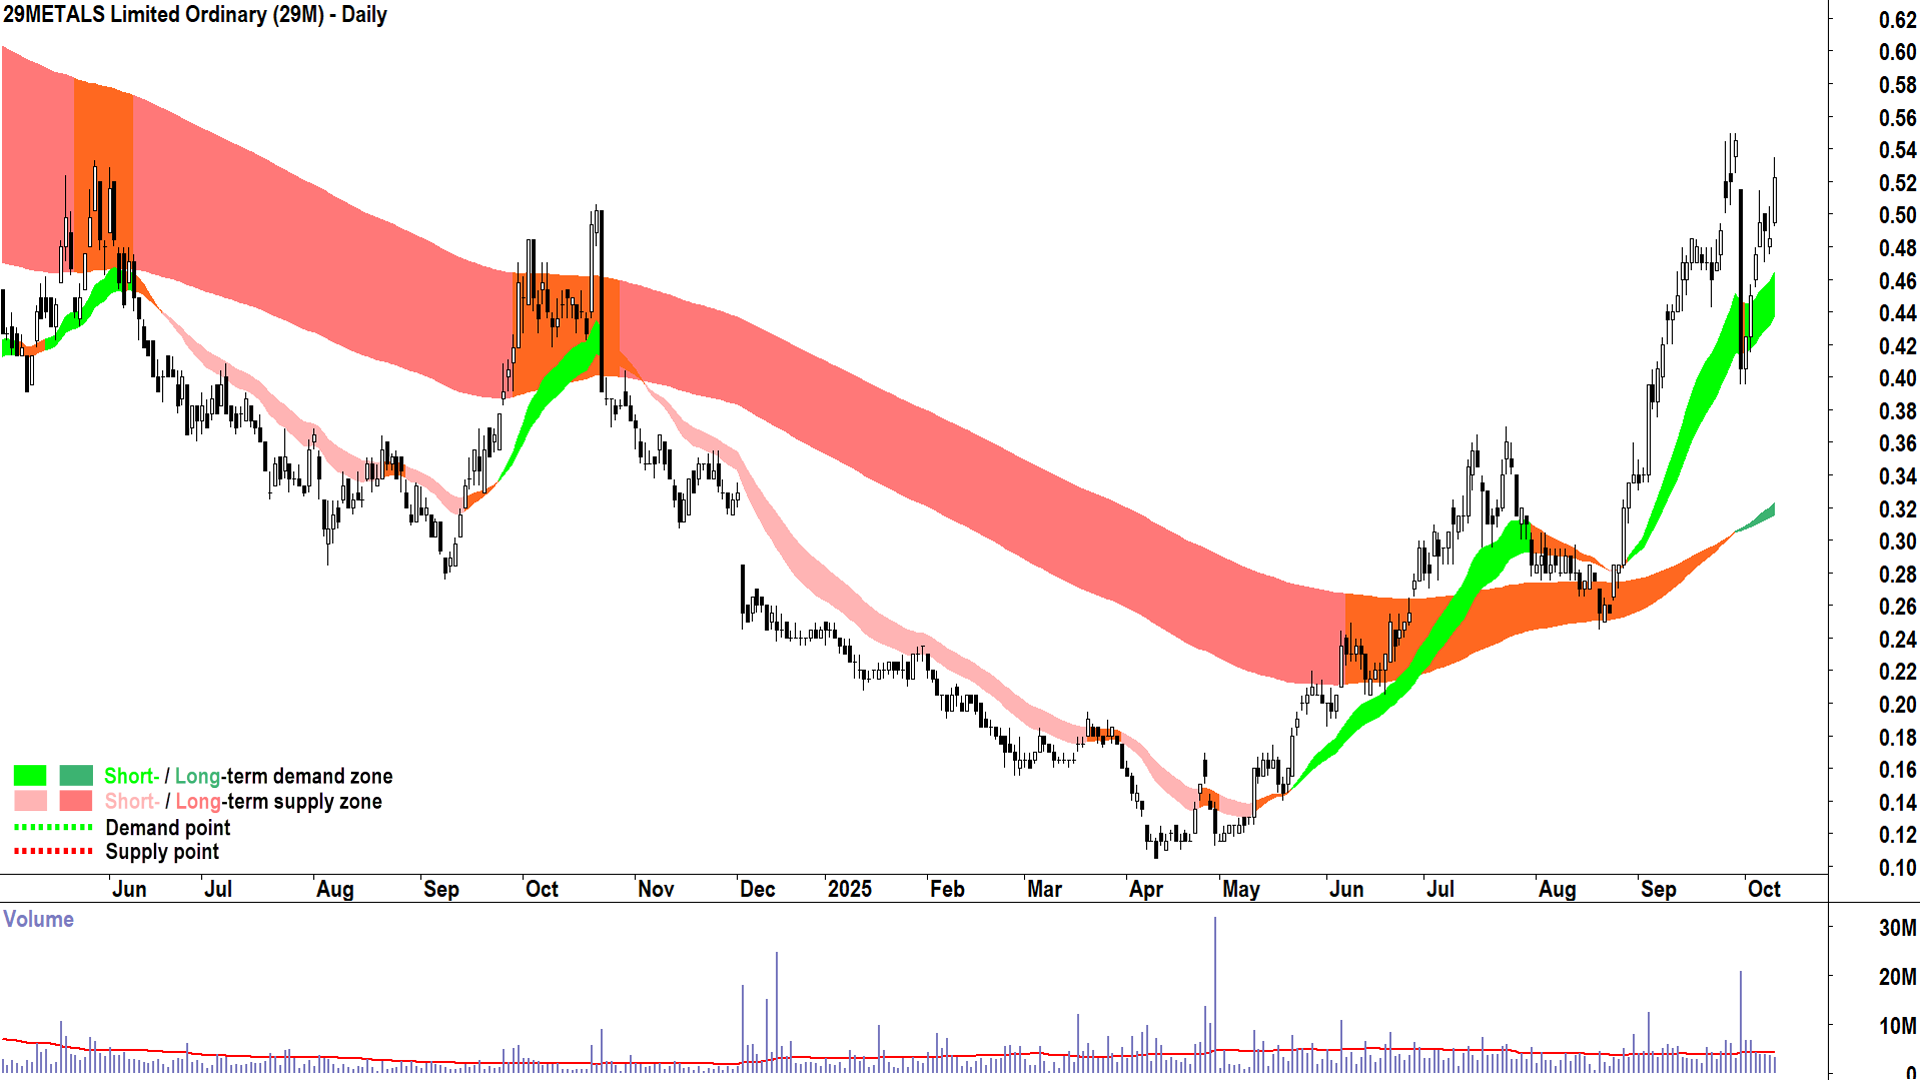
29 Metals (ASX: 29M)
%20daily%20chart%209%20October%202025.png)
29 Metals chart (click here for full size image)
ST/ LT Trends: ⬆️ / ⬆️ ✅
Price Action: Rising peaks and rising troughs 📈. The steepness of the rally demonstrates strong excess demand ✅.
Candles: Predominantly demand-side in nature (treating 30-Sep as an outlier for now) ✅.
View: Has appeared in ChartWatch ASX Scans as a Feature Uptrend (i.e., highest conviction) 3 times over the last couple of months. Save for that very odd 30-Sep candle... A picture of excess demand. Today's candle has it again meeting my criteria for maintaining/adding risk.
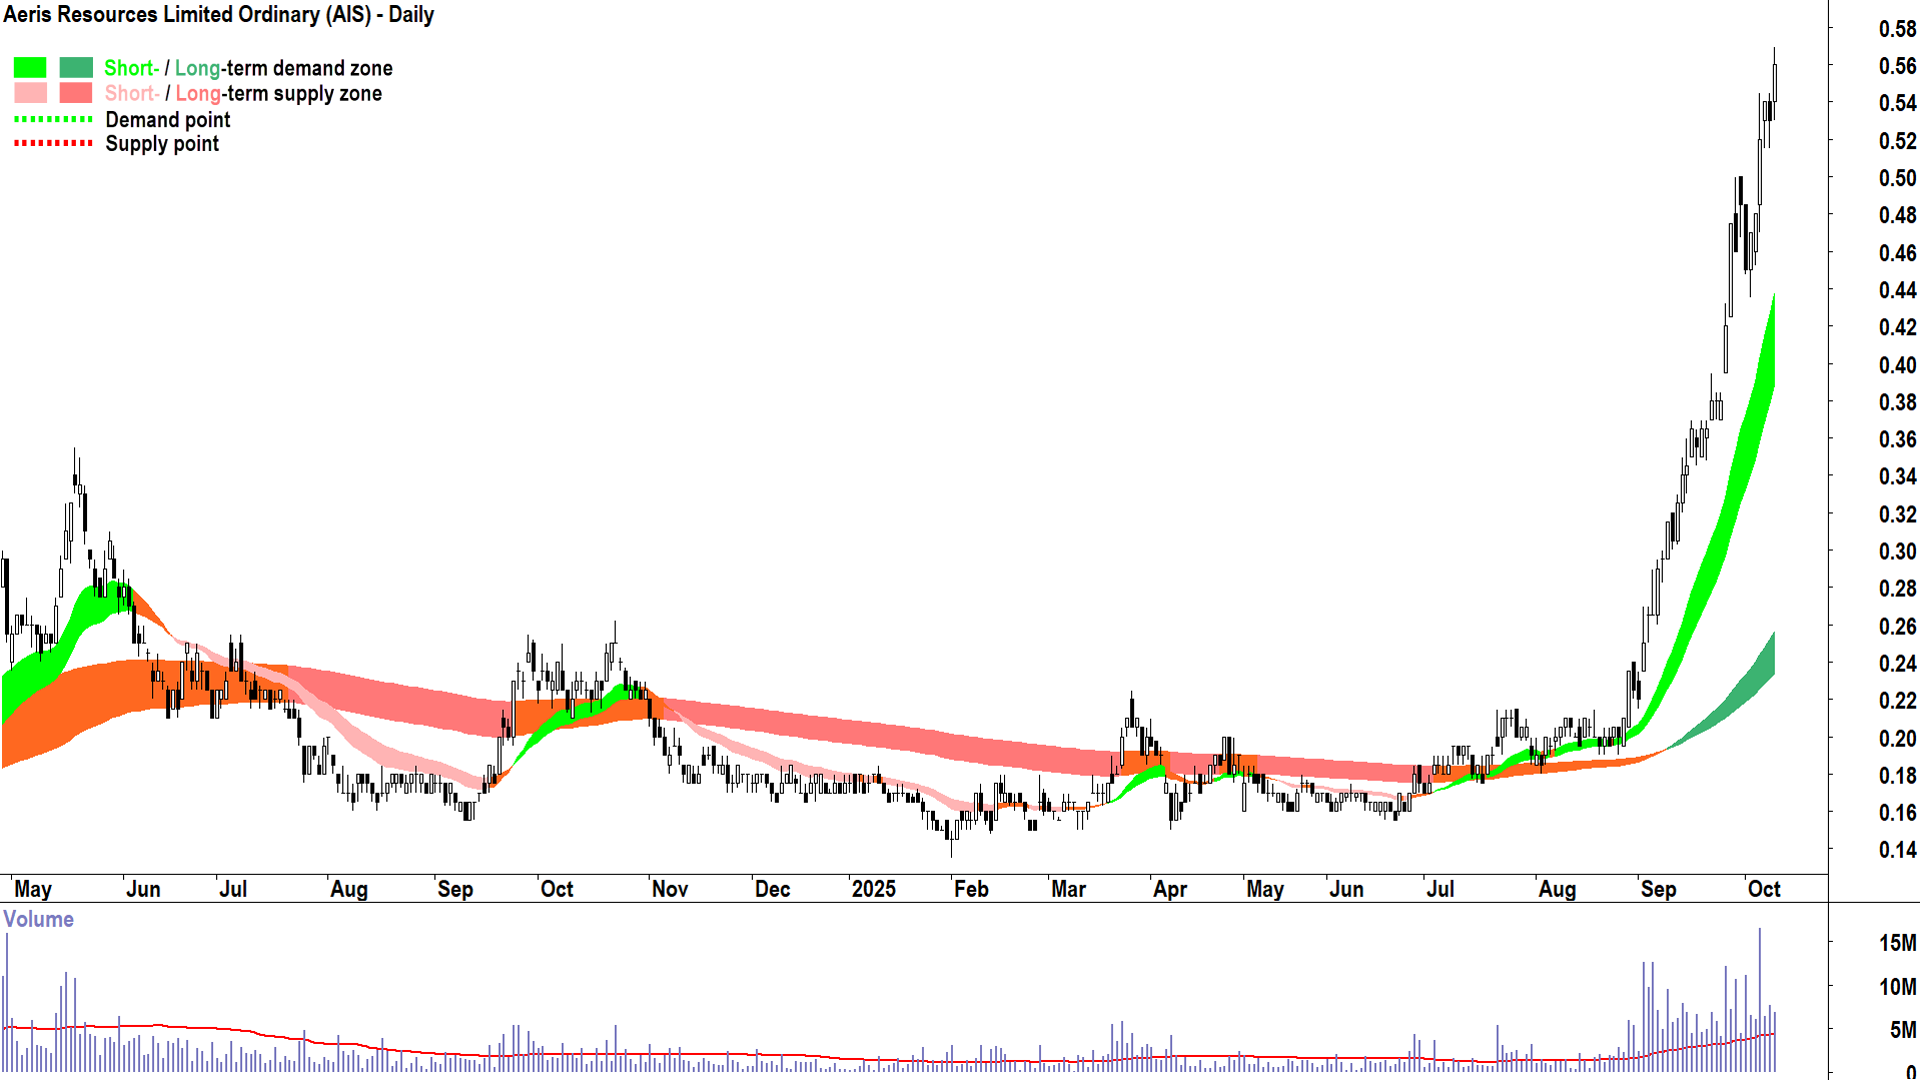
Aeris Resources (ASX: AIS)
%20daily%20chart%209%20October%202025.png)
Aeris Resources chart (click here for full size image)
ST/ LT Trends: ⬆️ / ⬆️ ✅
Price Action: Rising peaks and rising troughs 📈. The steepness of the rally demonstrates strong excess demand ✅.
Candles: Predominantly demand-side in nature ✅.
View: Has appeared in ChartWatch ASX Scans as a Feature Uptrend (i.e., highest conviction) 6 times over the last several months, and as recently as Tuesday's edition. A picture of excess demand, and therefore clearly still meeting my criteria for maintaining/adding risk.
ChartWatch *LIVE* Webinar
ChartWatch *LIVE* Webinars – WEEKLY Wednesday's @ 12pm AEDT
Learn more about technical analysis and trend following through real case studies on ASX stocks. Australia's premier technical analyst, Carl Capolingua, shares his unique insights on stocks as requested by viewers. Ask about a company in your portfolio or anything related to trading and investing and get Carl's expert opinion.
Places are limited so >REGISTER NOW!<
