
ChartWatch Markets: China's stock market is on the verge of its biggest bull market in a decade, can the ASX ride its coattails?
Technical analysis of the most important global stock indices, commodities, bonds, FX, and crypto impacting your ASX portfolio each day.


Source: Shutterstock
Mentioned
KEY POINTS
- The Nasdaq Composite's well-established bull market shows no sign of slowing down, which is fantastic news if you're a Trend Follower, less so if you're a Value Investor!
- The Chinese stock market is trading at its highest level in over 10-years, and the trends continue to look very constructive for potential gains.
- If Chinese stocks are a forward indicator of the Chinese economy, doesn't that then mean iron ore is worth watching closely? We think so!
In today's edition of ChartWatch Markets, we'll be covering the technicals for:
Nasdaq Composite
SSE Composite (SSEC) (China)
FTSE China A50 Index Futures
China Mainland Real Estate Index
Iron Ore 62% (Front month, back-adjusted) SGX
Nasdaq Composite Index

Nasdaq Composite Index (click here for full size image)
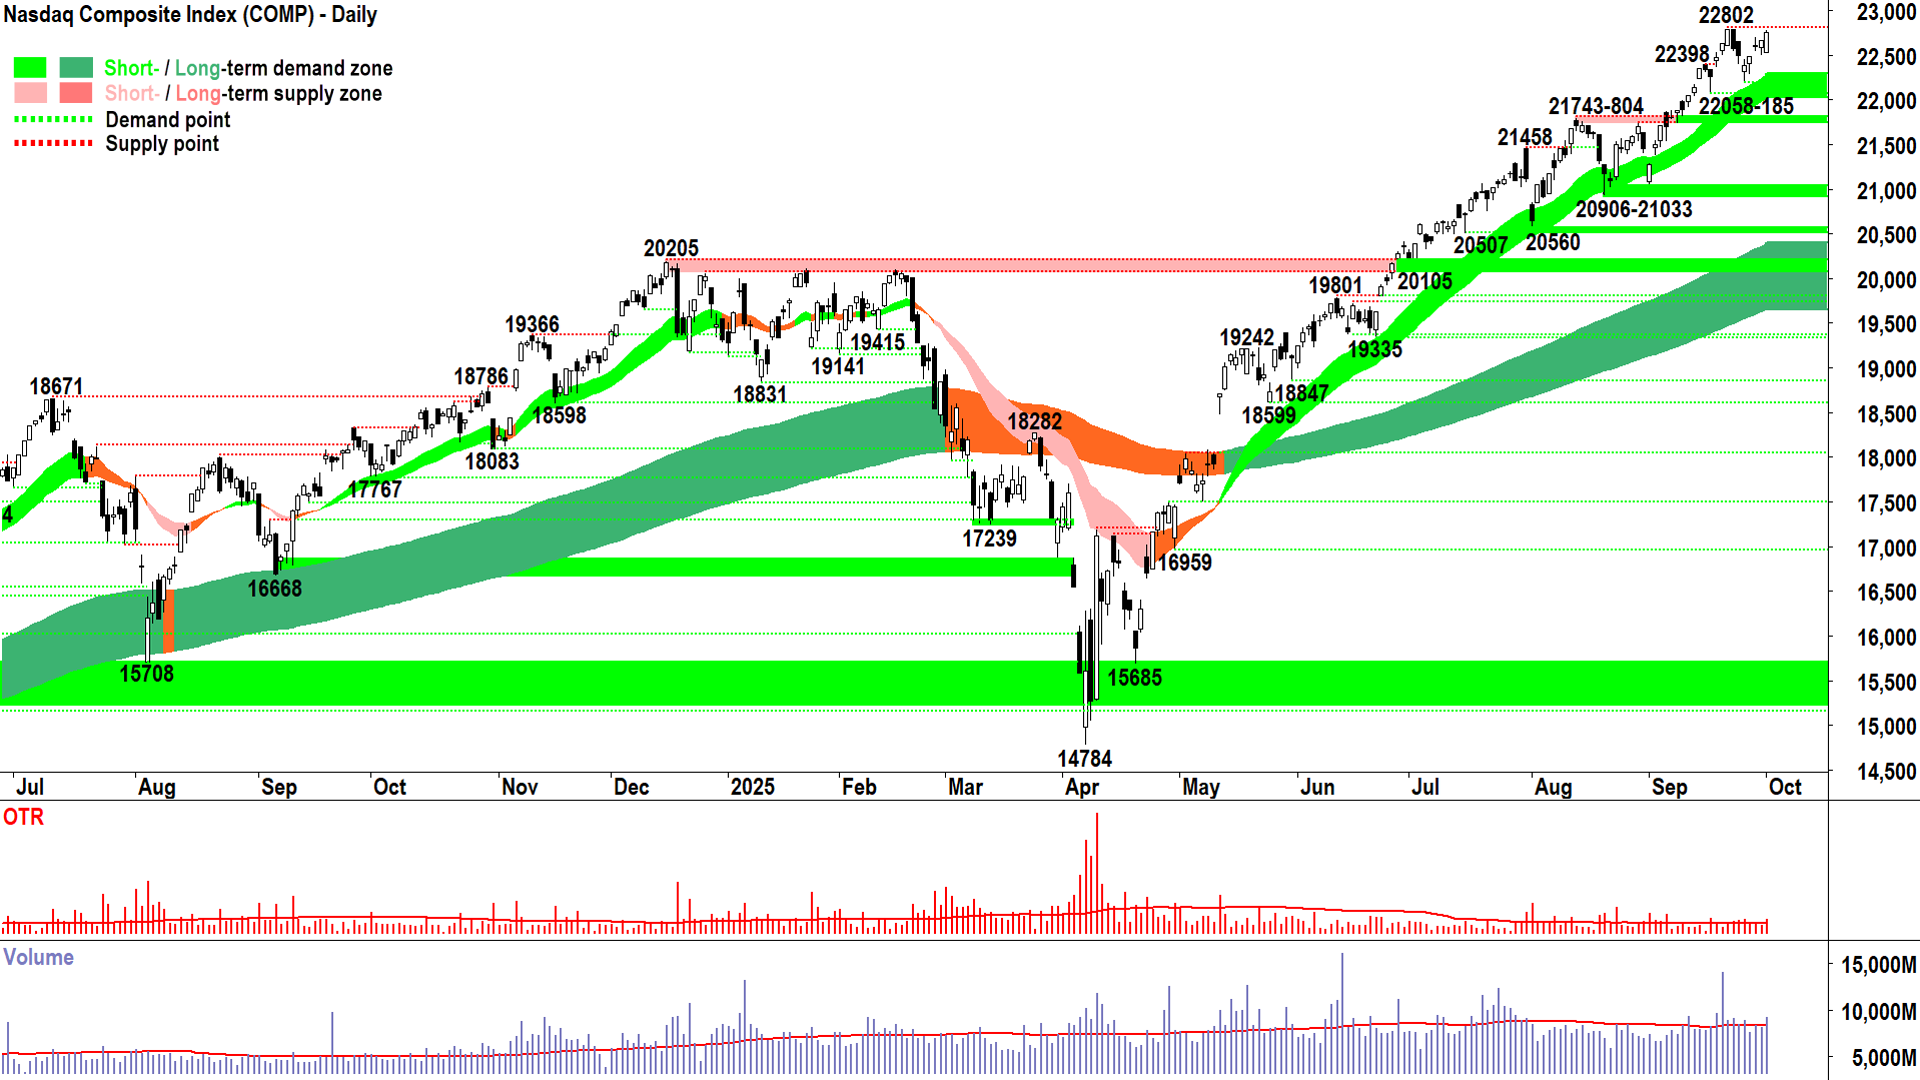
Q. When is a bull market boring? 🤔
A: Never!
If you’re a trend follower, that is.
Because if you’re a value investor, well… that’s probably another matter altogether (it’s overvalued, market has gone crazy, it will end in tears, but Buffett says… wah wah wah wah 😭)
Lucky for us, we’re trend followers. So, the white candle after white candle… i.e., the demonstration of unmitigated demand-side control is just fine with us 🥳!
We love consensus, i.e.: Those with cash (i.e., demand) wants to own stocks. Those with stocks (i.e., supply) want to own stocks. Both just as bad as the other… hence the price is going from the bottom left of the Comp chart above to the top right…
Who are we to argue? We’re no one. And that’s kind of the point… we can argue with what’s happening all we like… but guess who cares?
Yep, the market cares what you think less than your teenagers do when you start a sentence with… “When I was your age… “ 🥱
But, Mr. Smarty Pants Trend Follower… you seem to be getting it right for now… but don’t forget this will all tend in tears one day… and you’ll be crying on the wrong side of your trends then!!!
Well Mr. Stodgy Value Investor… you’re right that at some point this will all end in tears… it usually does… but I don’t fret that day of reckoning for 2 reasons:
1. It’s my job to make as much money as possible on the way up – when the trend is in its prime and it’s the easiest to do so; and
2. You’re right to think I won’t see the top – in fact you can guarantee I’ll be loaded up to the back teeth on the day it occurs… but I will see in my candles and price action pretty quickly something ain’t right… You’re also right noting that I’ll give back some of my profits on that day, no bigs… cracked eggs and the omelette stuff… but then I’ll reduce my risk very quickly and probably have very little invested (probably less than you!) all the way down…
Because I’m a trend follower, and trends change – which means I change… Duh! 😁
(Noting that I now appear to be having an imaginary conversation between myself and an imaginary value investor… I suggest I better do some technical analysis!)
As far as the 3 tent pegs of my technical model go, i.e., trends, price action and candles:
Short and long term trend ribbons: ⬆️/⬆️, widening/getting stronger, both acting as zones of dynamic excess demand, i.e., accumulation + buy the dip = Consistent with demand-side control ✅
Price action: Rising peaks and rising troughs 📈, i.e., supply removal and demand reinforcement + buy the dip = Consistent with demand-side control ✅
Candles: White-bodied candles and or downward pointing shadows i.e., pervasive programmed buy orders + buy the dip = Consistent with demand-side control ✅
✅✅✅ = I prefer to stay the course here at FRP (Full Risk Position = My personal allowable capital allocation limit for my investments in US stocks is 100%)
Key levels: 22058 is the closest point of demand, the price should not close below here if the demand-side is in control of the Comp's price; a close below the short term uptrend ribbon (presently 22020-22290) will nullify the short term uptrend = ⚠️
SSE Composite (SSEC) (China)
%20(China)%20chart_2%20Oct.png)
An interesting chart (click here for full size image)
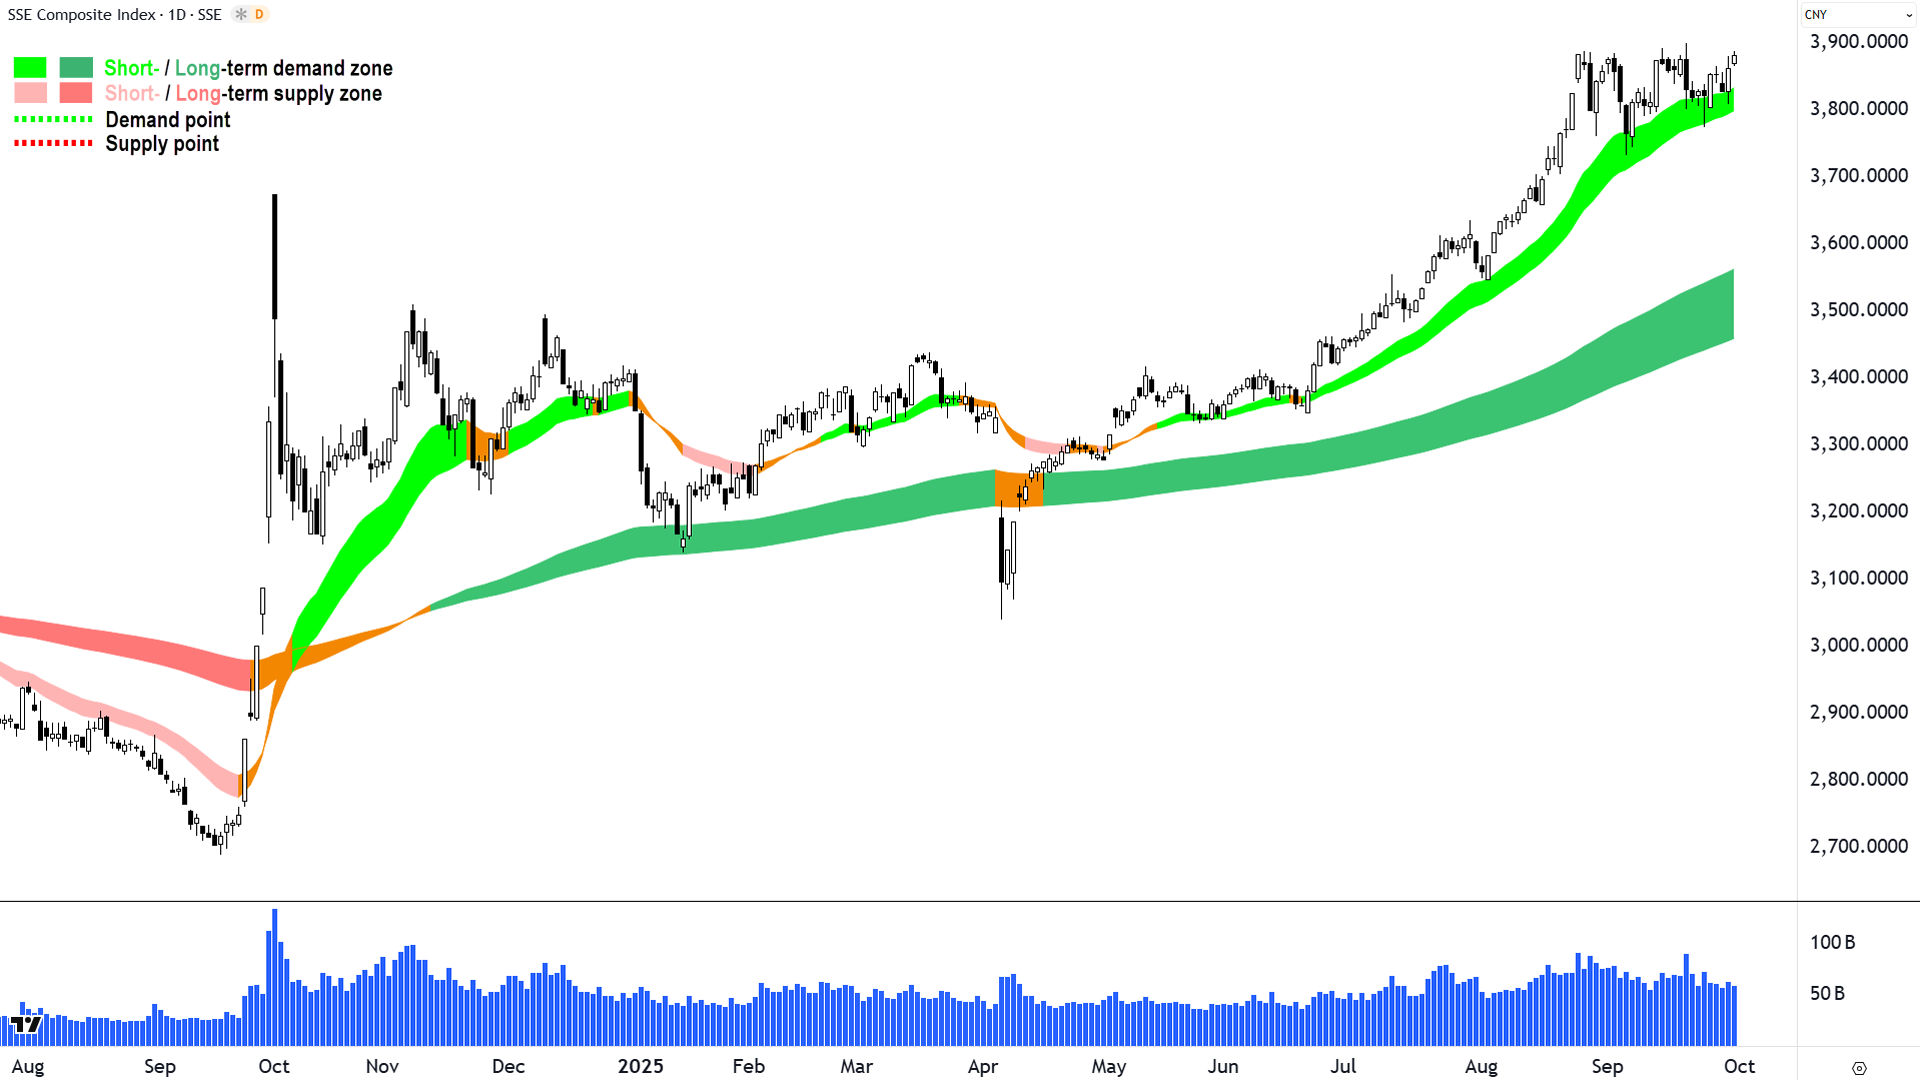
If the Comp is a mature bull market, then this looks like one that’s in the early stages of really ramping up. I brought this developing bull market to your attention a couple of months ago in ChartWatch in the Evening Wrap, but to be fair, far earlier in ChartWatch ASX Scans.
This is because the following ASX-listed China (and broader Asia) ETFs have been making regular appearances in my Uptrends Scan List since mid-June.
BetaShares Asia Technology Tigers ETF (ASX: ASIA)
iShares China Large-Cap ETF (ASX: IZZ)
iShares Asia 50 ETF (ASX: IAA)
Global X China Tech ETF (ASX: DRGN)
Vaneck FTSE China A50 ETF (ASX: CETF)
Vaneck China New Economy ETF (ASX: CNEW)
Vanguard FTSE Asia EX Japan Shares Index ETF (ASX: VAE)
Can I say that DRGN is my favourite simply because of its ticker code!!! 🐉 Hey, it’s trend is also pretty good, and it’s been a Feature Uptrend (i.e., highest conviction) 5 times since 22-Aug (that candle's close $12.20 to current $14.20 is a tidy +16% in 6 weeks).
Back to the SSEC’s technicals, let’s again check the boxes (i.e., “Our Job”!):
Short and long term trend ribbons: ⬆️/⬆️, steady, both acting as zones of dynamic excess demand = Consistent with demand-side control ✅
Price action: Rising peaks and rising troughs 📈 vs most immediate, but more broadly, some consolidation last few weeks – healthy after a big move, and generally rising troughs indicates growing demand is chipping away at what may turn out to be only temporary "take profit" supply = Consistent with demand-side control ✅
Candles: A few supply-sides in the consolidation (i.e., black-bodied and or upward pointing shadows), but nothing too sinister – we can still say a general predominance of demand-side candles = Consistent with demand-side control ✅
✅✅✅ = I prefer to stay the course here at FRP.
Key levels: The 23-Sep low of 3774 is the closest point of demand, the price should not close below here if the demand-side is in control of the Comp's price; a close below it and the short term uptrend ribbon (presently 3800-3832) will nullify the short term uptrend = ⚠️
These are not all-time highs for the SSEC – far from it – so let’s zoom out and see what might be in store… or at least, where the next major point of historical supply might lie.
%20(China)%20weekly%20chart_2%20Oct.png)
SSE Composite (SSEC) (click here for full size image)
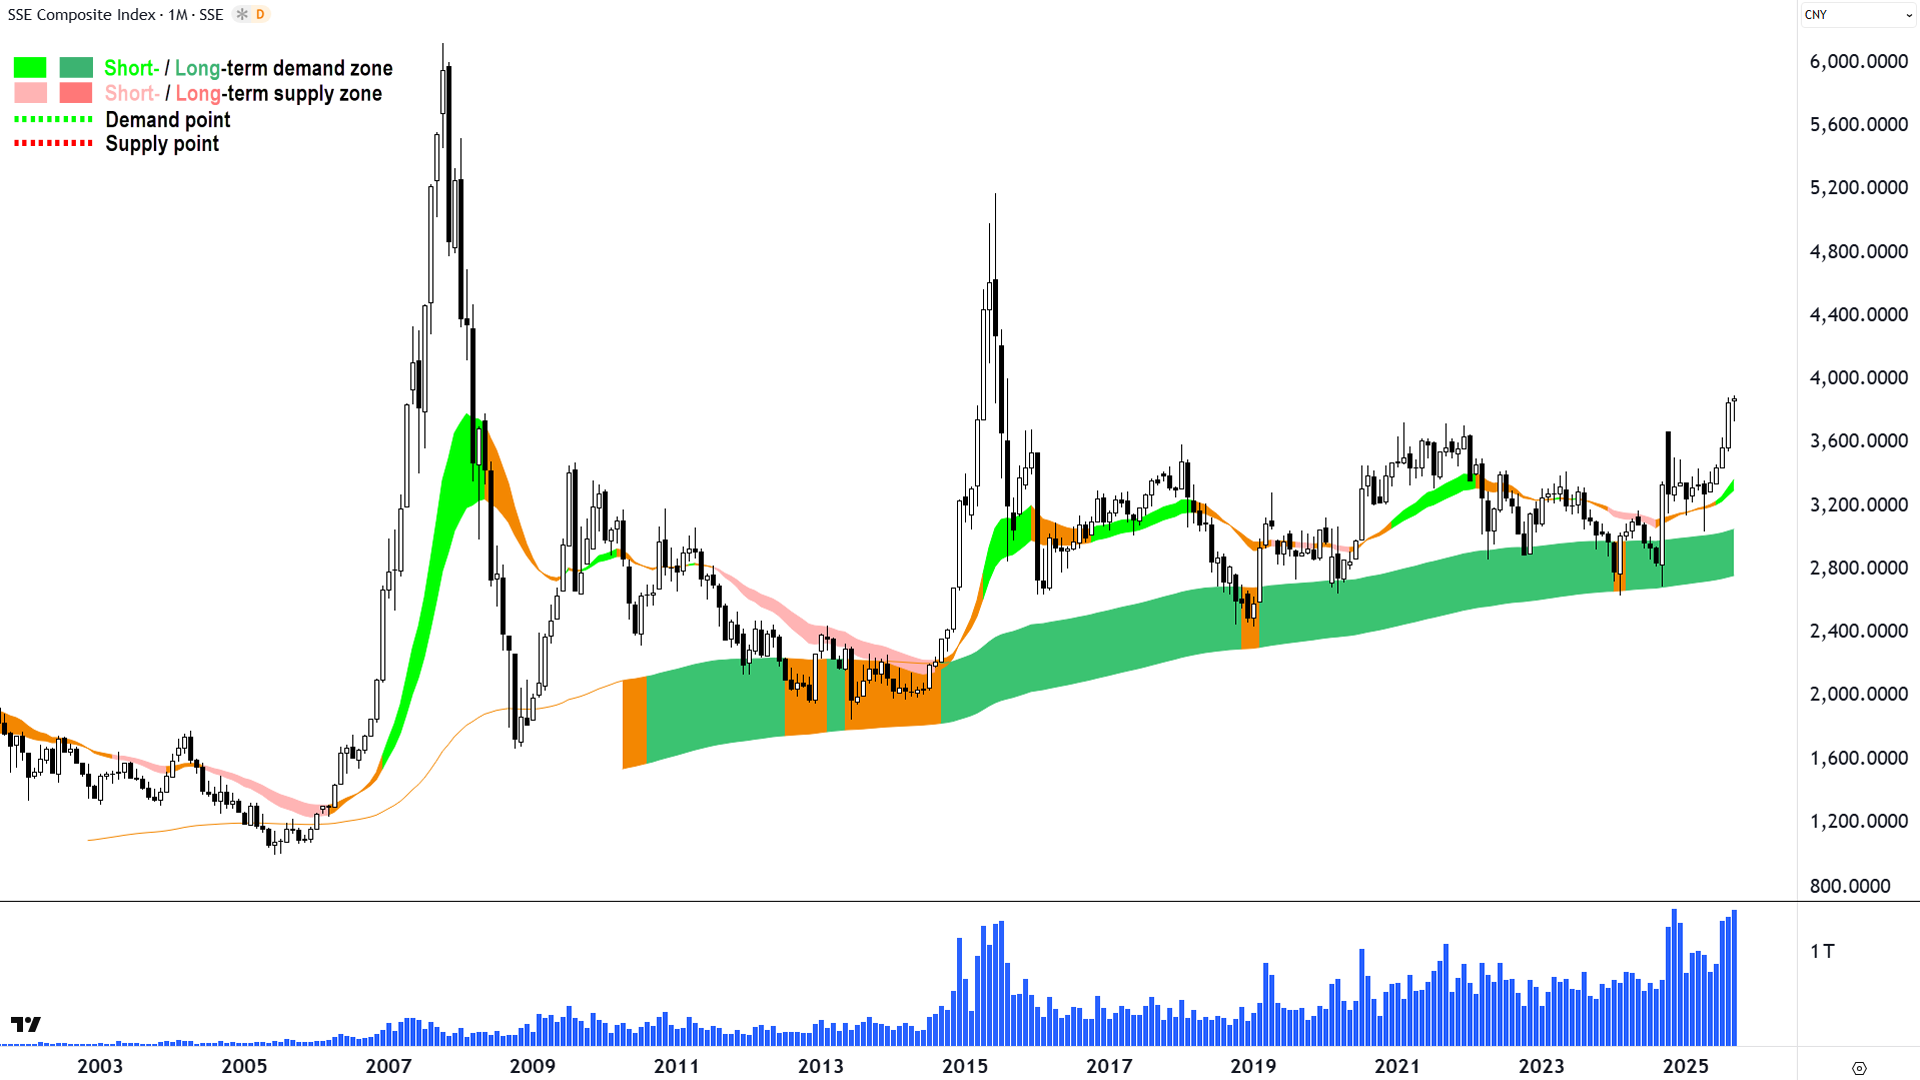
This chart shows the SSEC is trading at its highest level in just over 10-years. That's a long period of base building. If the trends can hold here, then there's very little in the way of major historical points of supply until the 2015 bull market peak of 5179.
Note the nature of that bull market (i.e. down as fast as it went up!) as well as that between 2005-07. That's just how Chinese stocks roll 🚀!
A wall of speculative fervour – building and building on itself – drawing in more and more hot money... Until BANG! 💥
Usually, its regulators that come in to try and cool things down (i.e., to stop the next arriving "greater fool" from losing their shirt) – but inevitably they cause the whole shebang to implode!
But, I cannot state this any more clearly: There's nothing like a Chinese stocks bull market when it gets going... So keep an eye on these charts closely! 🧐
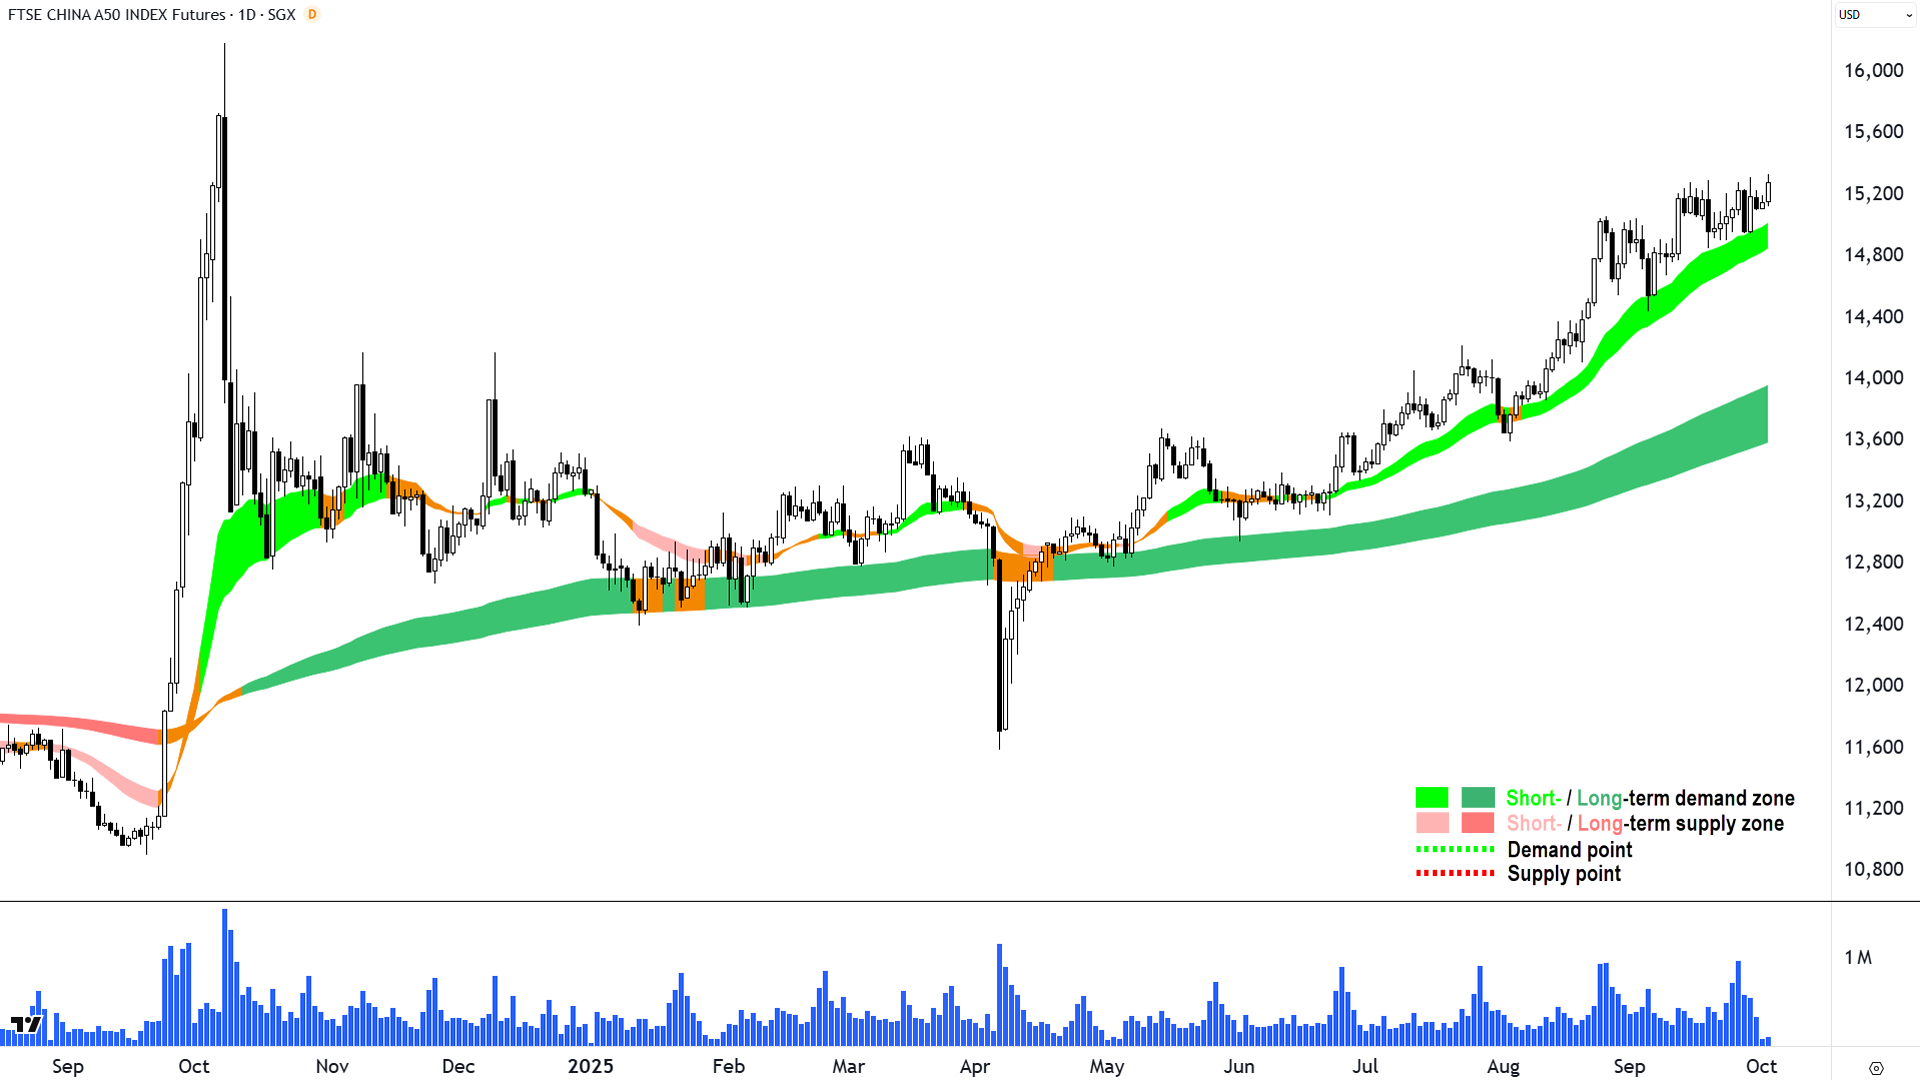
For your reference, the other major Chinese stocks barometer, the China A 50 Shares Index, is also looking very solid.

China A 50 Shares Index (click here for full size image)
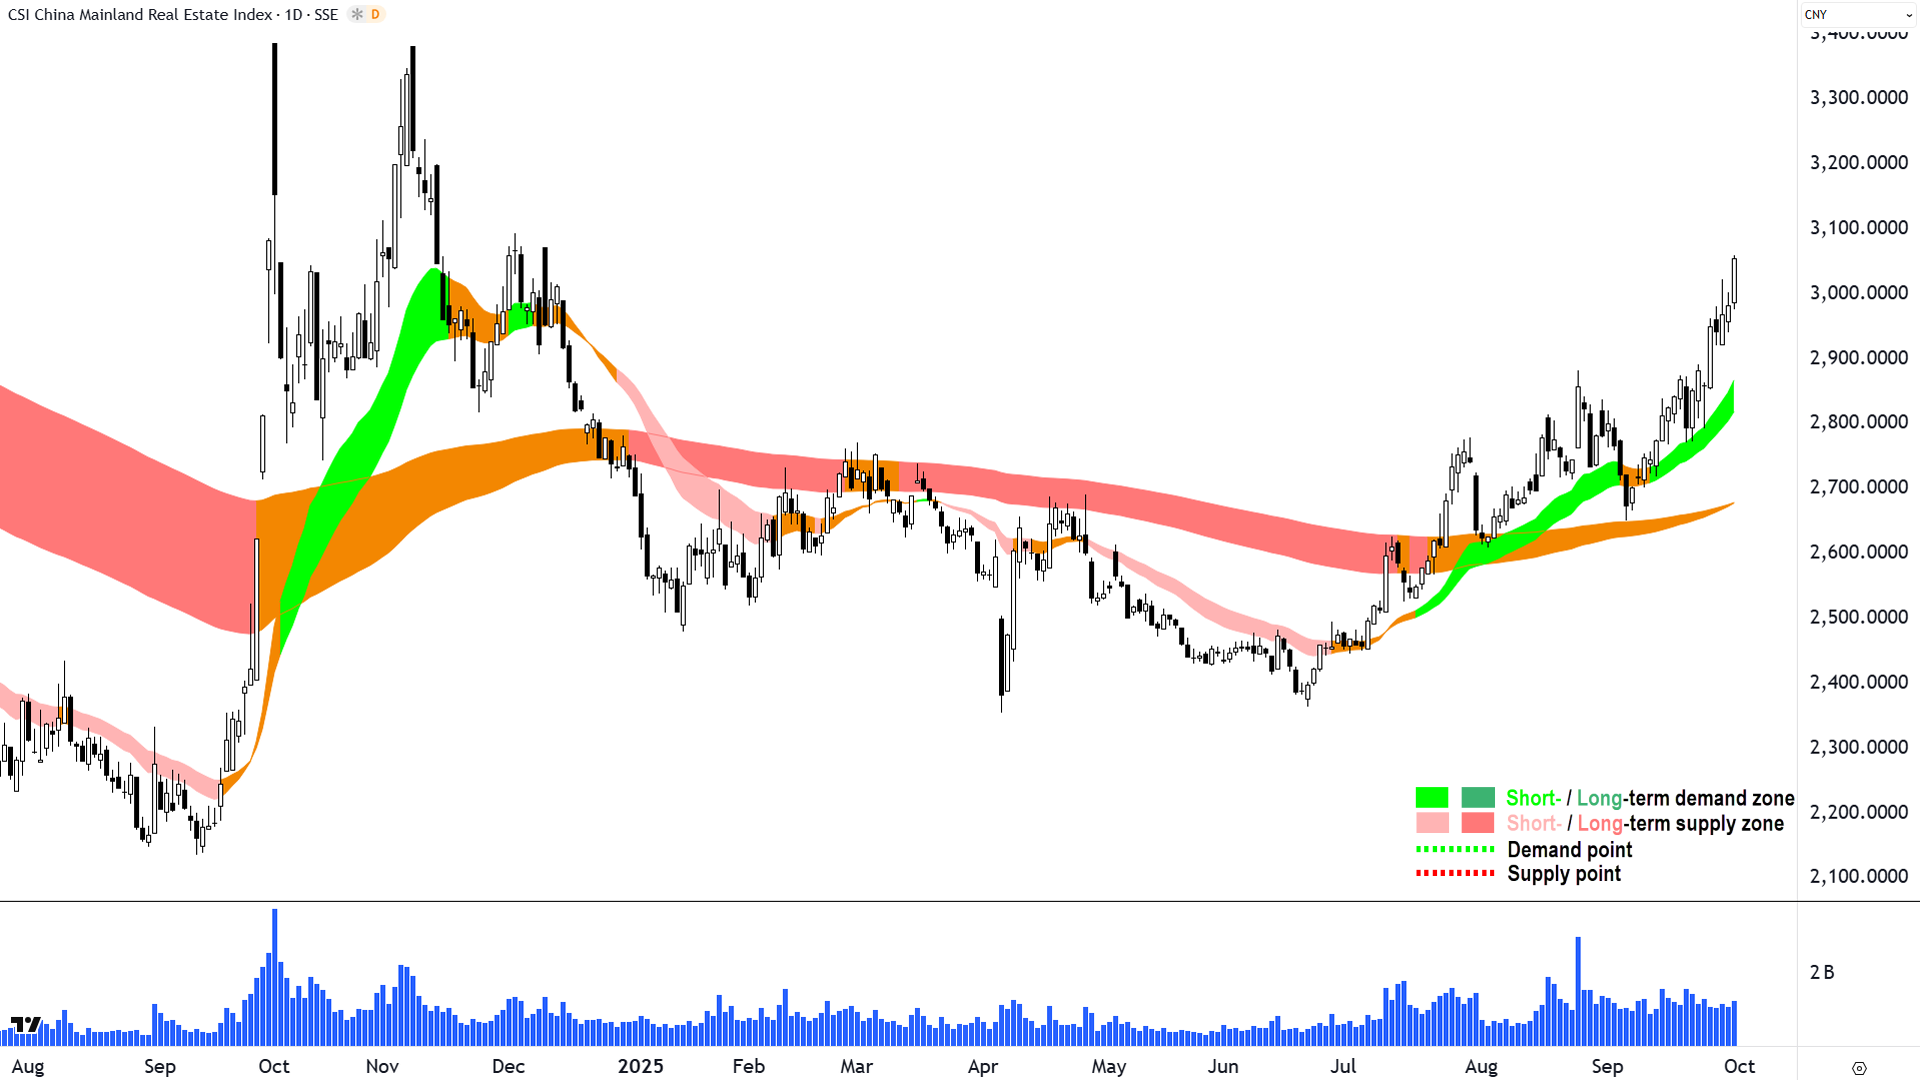
And here's the ace in the hole. The China Mainland Real Estate Index. We've all heard about how the Chinese property market is in the toilet... how prices keep going down and down each month 🚽. Well, that last part is still true, i.e., as of August's house price data... But if the stock market is a leading indicator of the economy, then this is the most interesting chart I will show you today.
%20(China)%20chart_2%20Oct.png)
China Mainland Real Estate Index (click here for full size image)
Iron Ore 62% (Front month, back-adjusted) SGX
%20SGX%20chart_2%20Oct.png)
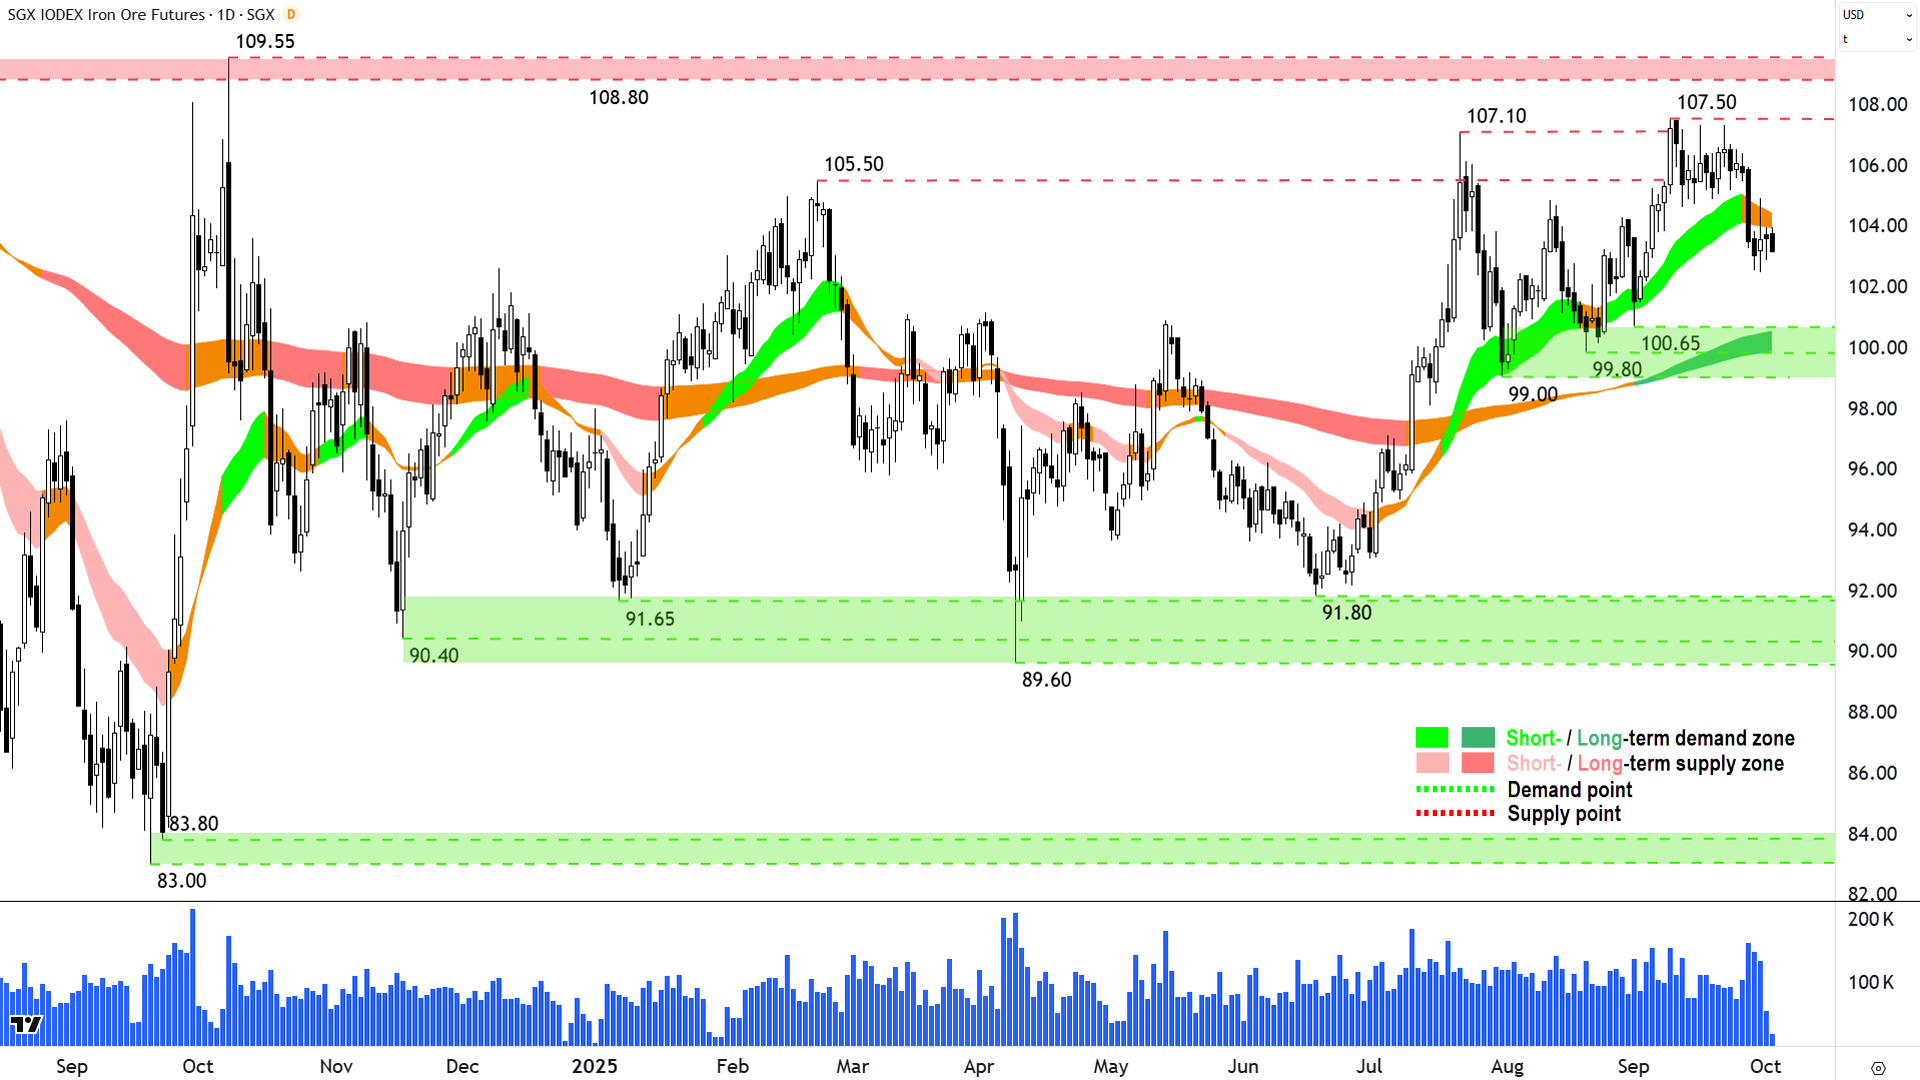
Iron Ore 62% (Front month, back-adjusted) SGX (click here for full size image)
Can we draw a line between the previous charts and iron ore? 🤔
The recent price action would suggest not. Well, the really recent price action – where it has once again failed at the major 108.80-109.55 supply zone. But that will not surprise anyone who's been reading ChartWatch for any length of time – we knew / know that zone will be a particularly hard nut to crack 🥜.
But the iron ore price has been improving more generally since the middle of June – roughly when Chinese stocks really started to take off – and in defiance of most analysts expectations (none of them have a 12-month target above US$100/t).
So, I do think this is a chart also worth keeping an eye on, but let's call it a casual glance every now and then to check if there's a $110/t handle. I would suggest if that occurs... well watch out BHP, RIO, FMG et al... In fact, you could say watch out ASX more generally!
ChartWatch *LIVE* Webinar
ChartWatch *LIVE* Webinars – WEEKLY Wednesday's @ 12pm AEDT
Learn more about technical analysis and trend following through real case studies on ASX stocks. Australia's premier technical analyst, Carl Capolingua, shares his unique insights on stocks as requested by viewers. Ask about a company in your portfolio or anything related to trading and investing and get Carl's expert opinion.
Places are limited so >REGISTER NOW!<
