ChartWatch Markets: As ASX uranium stocks tumble, a check on the latest uranium price dynamics – plus Nasdaq warning signs
Technical analysis of the most important global stock indices, commodities, bonds, FX, and crypto impacting your ASX portfolio each day.


Source: Shutterstock
Mentioned
KEY POINTS
- US government shutdown, slowing US economic growth, an erratic White House trade policy agenda, stocks at historic levels of overvaluation… There’s plenty of reasons to doubt whether US stocks can move higher, but one major reason they can (the trend!).
- ASX uranium stocks are coming in for some pretty nasty attention today, we investigate whether something has gone awry with the uranium price.
- In today’s edition of ChartWatch Markets we go to the charts to answer the difficult questions investors are grappling with: Stay the course or run a mile? Let’s dive in!
In today's edition of ChartWatch Markets, we'll be covering the technicals for:
Nasdaq Composite
Uranium Futures (Front month, back-adjusted) COMEX
Nasdaq Composite Index

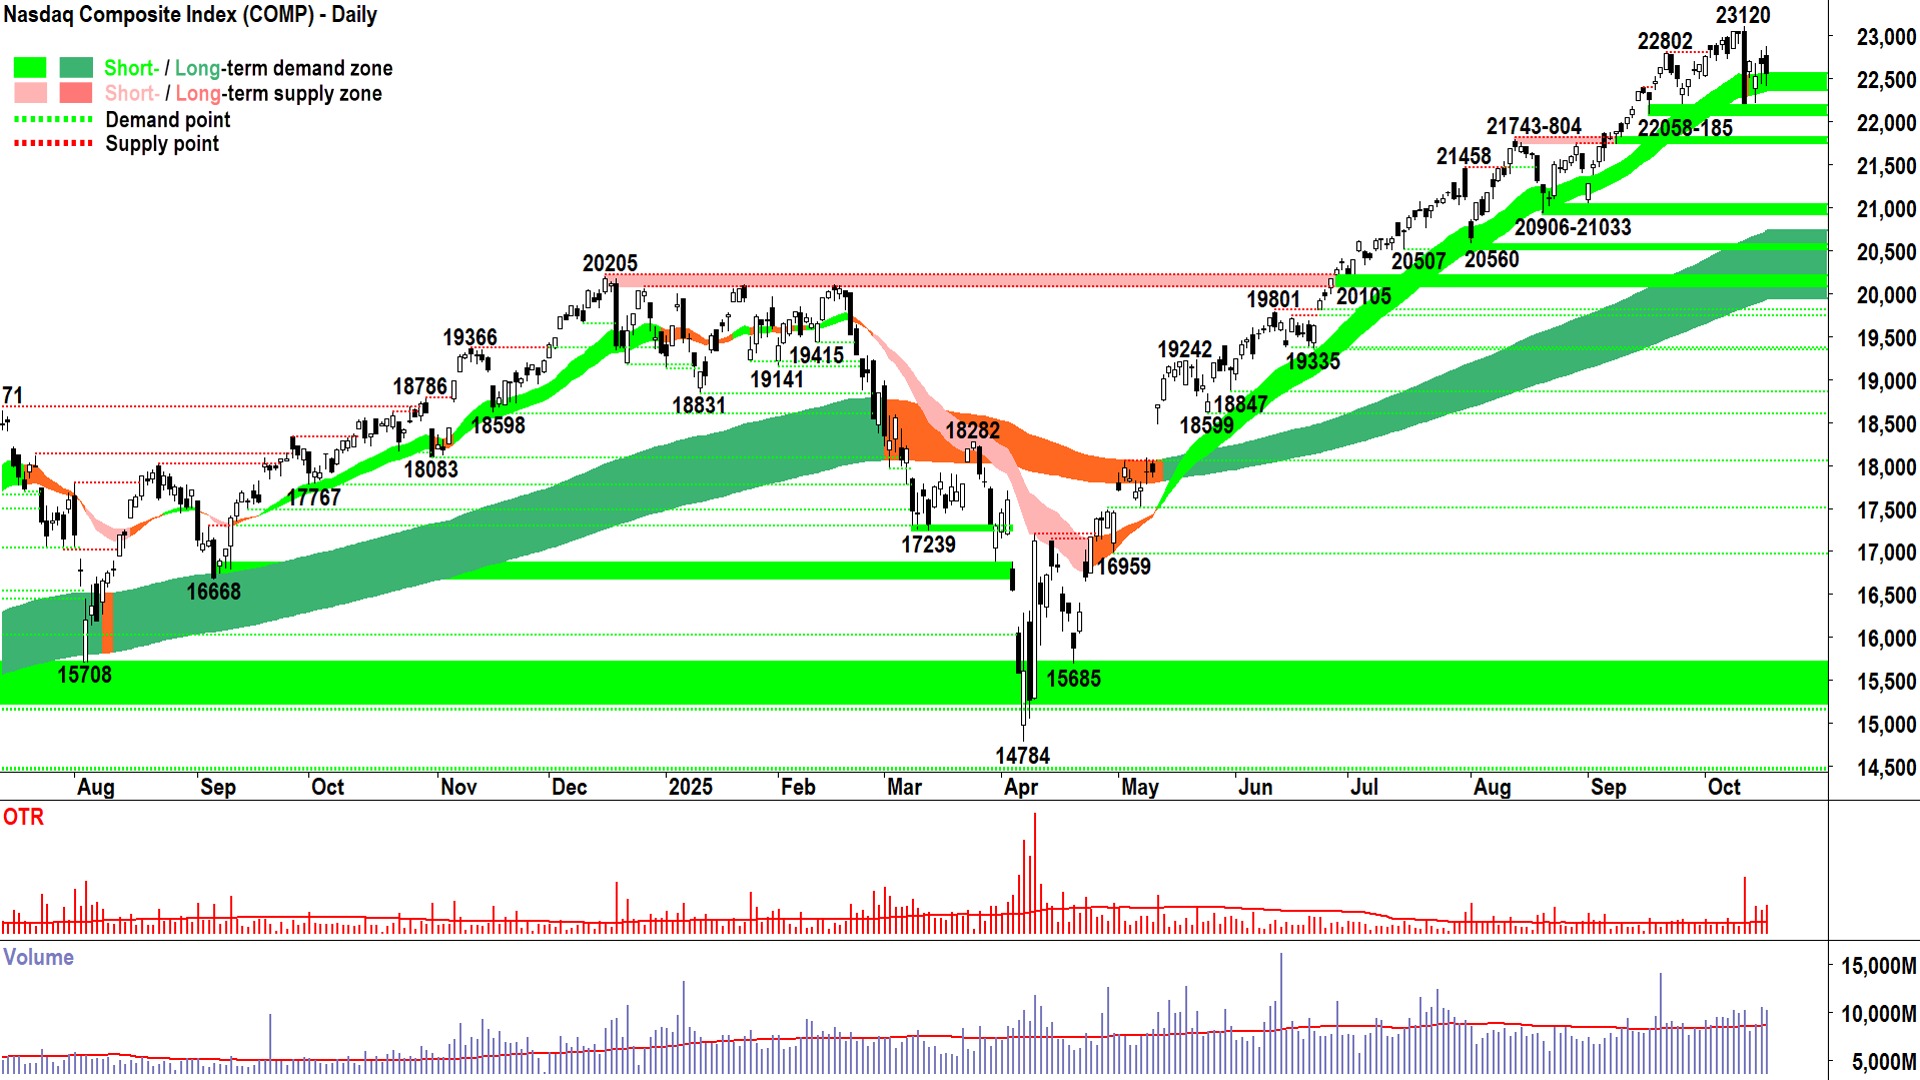
Nasdaq Composite Index chart (click here for full size image)
In yesterday’s update, I noted Wednesday’s improvement in the short term demand-supply dynamics for the Comp, with a moderate – but unconvincing – demand-side candle.
“heighted alert regardless” was my message. I also noted that for last night’s candle:
We want to see 👏:
A long demand-side candle (i.e., long white body and or downward pointing shadow)
A close near the high of the session, and preferably as close to-or-even-above 23120.
We don’t want to see 🙅:
A long supply-side candle (i.e., long white body and or downward pointing shadow)
A close near the low of the session, and preferably not close to-or-even-below 22058.
Looking up at Thursday’s candle, how would you classify it? (I’ll let you think for a bit! 🤔)
…
…
…
So, what do you reckon? Good, bad, ugly? ⚖️
This is what I think:
Black body, decent length overall, shadows out each side, downward pointing shadow longer than the top one – but a clear loss of ground versus Tuesday = Volatility (length), net-net supply-side control (black, loss on session), but clearly still a great deal of indecision (downward pointing shadow, respecting short term uptrend ribbon).
Above average volume indicates a decent whack of demand and supply went into battle, but by the close, a decent whack of demand was consumed (i.e., cash converted to shares = cash converted to latent supply).
Put in context with the 10-Oct “that candle”, i.e., the defining candle of the last 6-months – unequivocally a major supply event – I suggest Thursday’s price action is concerning. It demonstrates supply reinforcement.
Supply reinforcement is the opposite of what’s required to consume the latent supply created by the 10-Oct candle – we want supply removal! Last night’s price action also shows that supply is likely growing more active the closer to 23120 we get.
Okay Carl, enough scrutinising the minutiae of every bloody candle on the chart – just tell me what to do mate! 😁
Yeah, yeah, I’m getting to that! But here’s the deal: I’m not sure 🤷.
Yep, that will shock you and annoy you… but that’s it! I can’t say what the MOTN (More Often Than Not) outcome is here because there’s no clear signs of either demand-side or supply-side control.
The market is indecisive: Therefore, so am I.
And really, that’s the only conclusion a trend follower should draw here – no conclusion at all.
We either wait for more confirmation of which side is in control, or we just reduce our risk on the basis that there is already some nasty stuff going on and it’s better to be safe than sorry.
Me? I’m going to go with the "wait for confirmation" option. The everything else is still too strong to do anything but, in my opinion. However, as stated in the update immediately following “that candle” – I noted that I’m in no hurry to add back any risk that might have usurped on that day.
View: It’s a close call, there’s some stuff in that recent price action and volume that warns of growing supply-side control. If you prefer to pare some risk back here, you’ll get hear no objections from me, however, I remain at FRP (Full Risk Position corresponds to a 100% allowable capital allocation limit for US stocks based on my personal risk management model).
Key levels: the short term uptrend ribbon (presently 21765-21935) 22058) is the closest zone of demand, the price should not close below here if the demand-side is in control of the Comp's price; 22058 is the critical point of demand – a close below it will nullify the short term uptrend = ⚠️
Uranium Futures (Front month, back-adjusted) COMEX
%20COMEX_16%20Oct.png)
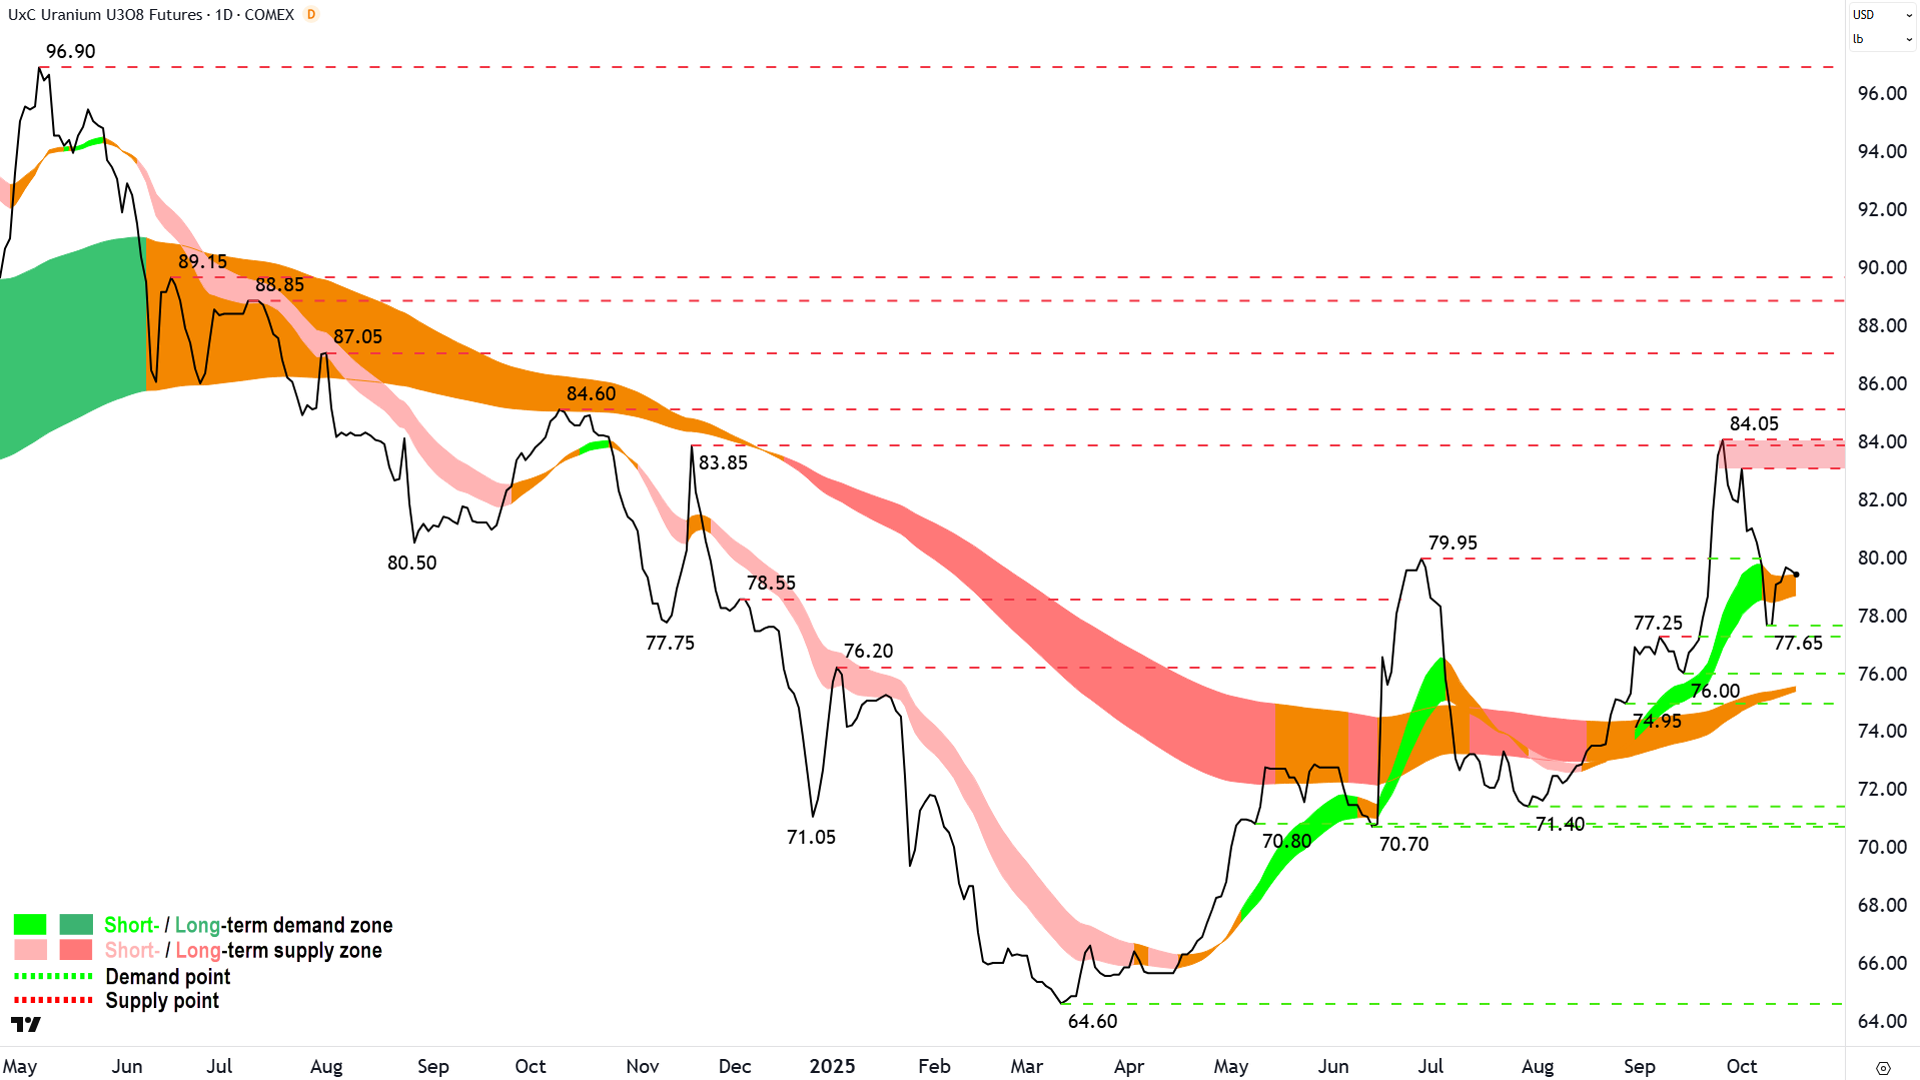
An interesting chart (click here for full size image)
ASX uranium stocks are coming in for some pretty nasty attention today, so I thought it prudent to check up on the uranium price, particularly as we haven’t covered it for a while (last update on 3-Oct).
There’s nothing dramatically sinister here to explain the demise of u-stocks today, but the u-price is likely approaching a bit of a make-or-break moment:
The last major peak at 84.05 confirmed 83.85-84.60 as a major zone of supply. The price action since then is falling peaks and falling troughs, indicating short term supply reinforcement and demand removal.
The price sliced straight through what should have been a zone of dynamic demand at the short term uptrend ribbon – which has since neutralised.
Last night’s price action shows another lower peak.
That’s all the bad stuff. There’s still some good stuff:
More broadly, major peaks and major troughs are still rising, so 84.05>77.25 and 77.65>71.40.
The long term trend ribbon is contracting towards a new uptrend, and it appears to be acting as a zone of dynamic demand.
The last major peak of 77.25 so far appears to be acting as a point of demand.
Basically, there’s still plenty of evidence of medium-to-longer term buy the dip – even if the short term demand-side control narrative is under some pressure.
View / Key levels: I can continue to back the uranium short and developing long term uptrends. A close below 77.25-77.65 nullifies the short term uptrend completely, versus a close below the long term uptrend ribbon nullifies the long term uptrend. Ideally, we see a strong rally that moves the price action back to rising peaks and rising troughs, and little resistance to higher prices as the price pushes into 83.05-84.05.
ChartWatch *LIVE* Webinar
ChartWatch *LIVE* Webinars – WEEKLY Wednesday's @ 12pm AEDT
Learn more about technical analysis and trend following through real case studies on ASX stocks. Australia's premier technical analyst, Carl Capolingua, shares his unique insights on stocks as requested by viewers. Ask about a company in your portfolio or anything related to trading and investing and get Carl's expert opinion.
Places are limited so >REGISTER NOW!<
