ASX 200 Live Today - Thursday, 27th August
The S&P/ASX 200 dips as consumer-facing sectors, REITs and tech stocks tumble. Here are today's top stories.

Today’s ASX 200 Updates
Welcome to our live ASX coverage for Thursday, August 27. Expect a high volume of posts pre-market and more periodic updates throughout the day. We'll be wrapping the blog up around 2:00 pm AEST. Let us know how we can make it even better.
Reporting season is heating up and we've got you covered. Our reporting season calendar has over 250 stocks plus earnings and dividend estimates.
ASX 200 dips as yields returns to uncomfortable levels
[2:24 pm] That's a wrap! The S&P/ASX 200 is down 81 pts (-0.89%), taking its two-session decline to 1.30% and dragging the index slightly lower for the week. Yesterday's hotter-than-expected CPI print (July trimmed mean at 3.6% vs. estimates of 3.5%) has pushed yields sharply higher, with the Aussie 2-year and 10-year both at their highest since May and the 30-year at multi-year highs. Analysts are now split roughly 50-50 on whether the RBA hikes 25 bps next month, and markets have fully priced a hike by November. Rate-sensitive and consumer-facing sectors are wearing the brunt, with Discretionary, Staples, Tech and Real Estate all down more than 1.5%. A pullback in miners and persistent weakness across the banks are adding to the drag.
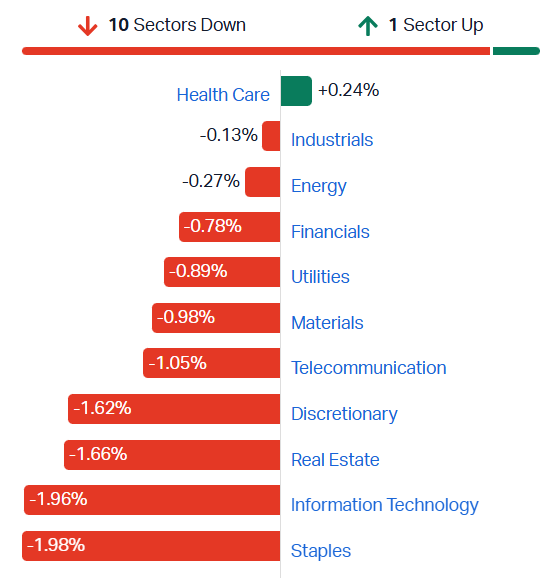
S&P/ASX 200 sectors (Source: Market Index)
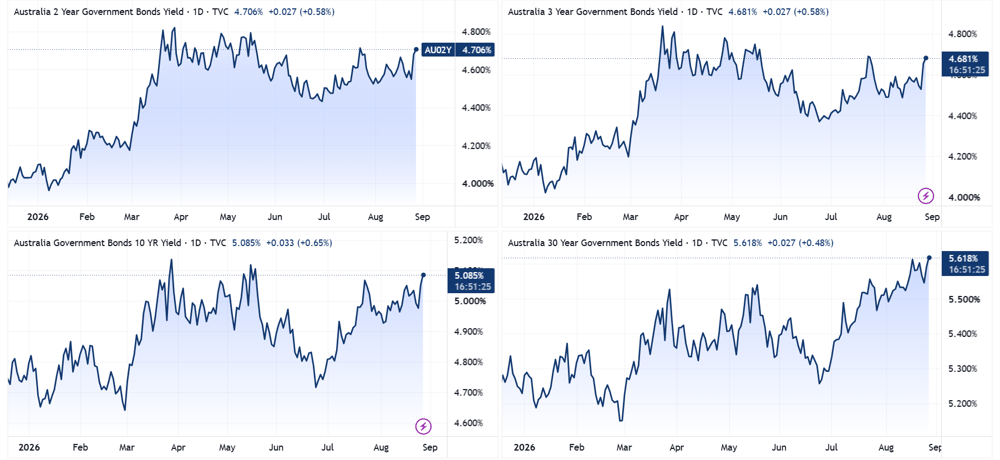
Aussie 2, 3, 10 and 30-year bond yields (Source: TradingView)
Qantas FY26 earnings call highlights
[2:00 pm] Management fielded questions on demand across leisure and corporate, how much of the fuel cost it can recapture through fares, and the fleet transition behind Project Sunrise.
On leisure demand: "Still in our research, we see that travel intention high and the prioritization of travel high. I think there genuinely has been a structural change in the desire for travel and experience in the last few years, and we are seeing that hold and in some ways strengthen... Jetstar had a record week last week, in fact, but very strong intakes across both domestic and international"
On corporate and government: "The trickle-down effect of the higher energy prices, moves in interest rates, has actually impacted business confidence. What we saw in quarter 4, that there was some non-corporate and also government just actually reduce some travel demand or travel spend in reaction to that. But we have not seen that deteriorate. In actual fact, we've seen that stabilize"
On recapturing fuel through fares: "As you saw in the fourth quarter, it was around 30%, so we would expect to be able to capture more of that... We are very conscious of the elasticity, and we continue to monitor that on a weekly basis"
On whether fares fall back if fuel does: "I believe that some of our RASK performance will become structural. It needs to in some regard because we're seeing a certain amount of escalation in costs in other categories, industry cost, airport cost, government cost... we would not expect that RASK would normalize in line with fuel"
On network shifts since the conflict: "That has been really successful for the UK, for Paris, for Rome. But also in the short term, the U.S.A., we actually developed some connecting traffic after the war started... Africa, which we serve with an A330 from Perth and an A380 from Sydney, is emerging as another connecting way to get to the U.K. and Europe"
On the Project Sunrise economics: "By FY31, Sunrise is expected to deliver the $400 million in earnings uplift that we have mentioned in previous results... Qantas International EBIT margin is expected to go from 4% in FY26 to 10% by FY31"
On retiring the A380: "The A380 retirement unlocks approximately $300 million of net cash flow benefit from FY28 to FY31, primarily through lower capitalized maintenance cost... it is an aircraft which has been out of production since 2021"
Staples down after two-day rally
[1:56 pm] The S&P/ASX 200 Staples Index is down 2.0% after a 4% gain in the prior two sessions, with Woolworths and Coles giving back some of their results-driven gains,
Ticker | Company | % Chg | Price | 1 Week | YTD |
|---|---|---|---|---|---|
WOW | Woolworths Group | -2.9% | $39.02 | -1.8% | 32.9% |
A2M | A2 Milk Company | -2.5% | $6.93 | 1.9% | -24.7% |
MTS | Metcash | -1.8% | $2.97 | -4.0% | -10.4% |
TWE | Treasury Wine Estates | -1.5% | $5.60 | -0.6% | 6.6% |
COL | Coles Group | -1.4% | $23.71 | 2.8% | 10.3% |
EDV | Endeavour Group | -0.5% | $3.05 | -11.7% | -17.0% |
RIC | Ridley Corporation | -0.4% | $2.58 | -15.4% | -2.6% |
BGA | Bega Cheese | -0.2% | $6.19 | 0.0% | 3.2% |
CBO | Cobram Estate Olives | 0.4% | $3.37 | -3.9% | -16.7% |
ELD | Elders | 1.1% | $5.93 | 2.0% | -13.5% |
GNC | Graincorp Class | 5.9% | $6.14 | 8.5% | -14.8% |
Sigma Healthcare FY26 earnings call highlights
[12:49 pm] Management fielded questions on consumer conditions, the GLP-1 tailwind, the international rollout and today's escrow expiry.
On the consumer: "I cannot really say we are feeling the impact of the consumer pressure at the moment. Certainly categories like vitamins or ladies' fragrances, which tend to be a little bit more discretionary, we can probably see a little bit of impact there. Then we are picking it up in haircare, in healthcare, and a whole lot of other categories"
On the sustainable growth rate: "It's not normal to expect us to be growing at 16%, right? On an ongoing basis. What we aim for on a consistent basis in the company is double-digit like-for-like sales growth. Now, that gets harder over time, right? The laws of gravity start to catch up with you as the base gets bigger"
On the oral GLP-1 dose: "If the government puts it onto the PBS, which is obviously still being negotiated, and the oral dose comes into Australia, I think the market size starts to grow materially. If you look then the cross-sell opportunities, that lifts our front shop"
On the UK: "The UK, of course, will be loss-making, right? You're opening two new stores. We'll probably open another three in the second half of FY27. So we expect that business to be loss-making for a period of time as we grow scale in that market"
On why the UK model appeals: "If you look at the density of footfall in pharmacy in the UK, it's actually double that of Australia... If you have a JV partnership and effectively you're opening a store and moving a license, you're opening day one essentially with the script volume and the people coming into your stores"
On the escrow expiry: "Mario's made it very clear that he's holding on to his stock, and Jack and Sam have said they would potentially sell up to 20%... Although the escrow arrangements end today, our trading policy only allows for that to end tomorrow evening. If there's anything that's probably going to happen, it's probably going to happen next week that the market would see"
Mineral Resources FY26 earnings call highlights
[12:46 pm] Management used the call to press the case for mining services as an infrastructure-like earnings stream, while fielding questions on margins, the POSCO proceeds and the return to dividends.
On mining services earnings quality: "Around 70% of our mining services order book runs on more than 15 years. These are long-term build-own-operate contracts with rates indexed every year and very low sustaining capital. It is an infrastructure earnings stream that sits inside a resource company, and it does not move with the commodity cycle"
On the mining services outlook: "I think the results in FY26 are just the start of what we can expect to see going forward. We see a good pipeline of opportunity. A lot of that's external"
On Onslow: "We are really focused there on just sweating the assets really. We got plenty of capacity inland, plenty of capacity on the haul road. We start pulling up when we get around the port, around the load out"
On lithium growth: "Around lithium, I think we are fairly set of where we are. We are just basically focused on brownfields projects. That is the low-hanging fruit, low CapEx, and we are going to get a lot more product to market fairly quick"
On the POSCO sell-down: "We're not really backing off tonnes. Within about 12 to 18 months, I mean, the Mineral Resources share of tonnes coming out of those mines will be pretty much what it is today"
On the debt position: "Net debt reduced by around AUD 1.1 billion to AUD 4.3 billion, with net debt to underlying EBITDA falling sharply from 5.9 times to 1.7 times at year-end. That de-leveraging has been driven by organic cash flow generation, not asset sales"
On use of the POSCO cash: "The cash will predominantly be used for paying down debt. We've got a bond due in 2028, for US$750 million"
On the dividend: "Balance sheet first, disciplined growth second, and shareholder returns from excess cash once those conditions are met"
On sizing the payout: "We think that the dividend that has been sized this time around, which is about 20% of underlying NPAT, is an appropriate balance for where the company is today. I think it is a prudent distribution, as we weigh up the growth opportunities for the future"
On the dividend policy: "We will contemplate dividends when we have line of sight to the balance sheet metrics being in line with our financial policies, effectively less than 2 times leverage, within a 12 to 18-month window"
On where growth goes next: "We are really focused on copper as our next commodity, and we really do not want to grow too much more in the lithium and the iron ore"
On replicating the model offshore: "The one thing we are looking at trying to do is seeing if we can replicate our model in another geographical part of the world. That is something we have been looking at for the last sort of 12 or 18 months, and we think we are going to make some progress over that over the next 12 to 18 months"
Household spending blows past forecasts and stiffens the hike case
[12:39 pm] July household spending came in almost four times the expected pace, landing a day after the inflation surprise and giving the RBA another reason to worry about domestic demand.
Household spending up 1.1% month on month vs a 0.3% forecast, and up 7% year on year vs 5.7% expected
Recreation and culture spending up 1.5% on gambling, major sporting events and cinema attendance
Health spending up 1.2% led by pharmaceuticals, general healthcare, eye care and dental
Nominal fuel spending up 2.2% following a partial removal of fuel tax relief that lifted prices
Oxford Economics Australia's Harry McAuley said the strength in spending will concern the RBA, though the bank will be hoping falling house prices and the threat of further hikes take some wind out of households' sails
Source: Bloomberg
China industrial profit growth slows to the weakest pace this year
[12:38 pm] A third straight month of deceleration in industrial profits points to fading pricing power as the oil-driven boost unwinds and domestic demand stays soft.
Industrial profits up 11.2% year on year in July, down from 15.1% in June and the slowest growth so far this year
Profits up 17.6% across the first seven months, short of a Bloomberg Economics forecast of 18.1%
Factory-gate price growth weakened for the first time since November and consumer inflation also softened, making it harder for companies to lift revenue and margins
Production, consumption and investment all missed expectations in July, with some economists estimating GDP growth has slipped further below Beijing's 4.5–5% annual target after a weaker second quarter
The earlier profit rebound leaned on the commodity price surge from the Iran war and AI-related demand, and the fading oil tailwind is now outweighing the AI benefit
Source: Bloomberg
Economists swing to September as the RBA hike call hardens
[11:20 am] Wednesday's hot inflation print has pushed a run of major bank economists to abandon their no-change calls and pencil in another RBA hike, with some now pointing at September rather than November.
Traders have fully priced a quarter-point hike at the November meeting, up from roughly a 48% chance earlier in the week, and put the odds of a September move at about 50-50
CBA now expects a quarter-point rise to 4.6% in November with risk of a September move, with Belinda Allen saying tighter policy is needed and that the data would cause the RBA to lose patience
ANZ and Goldman Sachs also sit at November with September risk, while Deutsche Bank's Phil Odonaghoe has gone to September, describing underlying inflation as intolerably high, and NAB's Sally Auld has switched to September with risk of a follow-up in November
The RBA hiked at its first three meetings of the year, fully unwinding the brief 2025 easing cycle and returning the cash rate to 4.35%
Westpac is holding its no-change base case while flagging November as a risk, and HSBC's Paul Bloxham notes the monthly CPI is still only a partial signal for the RBA, with weak growth and falling house prices expected to weigh on inflation over the forecast horizon
Source: Bloomberg
Tech stocks tumble for a second day
[11:13 pm] The S&P/ASX 200 Tech Index is down 2.2%, taking declines to 5.6% over the last two sessions. Wisetech was the main drag yesterday, down 10.0% on a soft FY26 result (and a further 4.2% today).
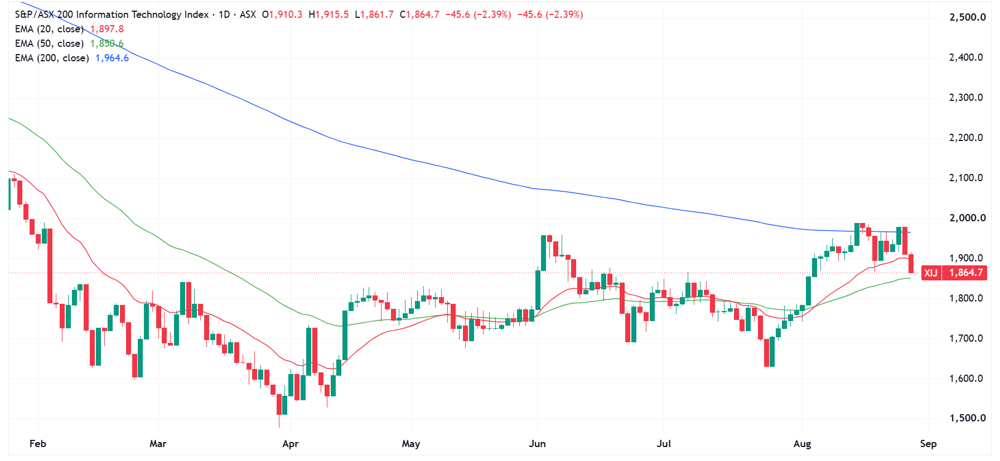
S&P/ASX 200 Tech Index daily chart (Source: TradingView)
Objective Corp is trading sharply lower off the back of its FY26 result, while the rest are broadly lower.
Ticker | Company | % Chg | Price | 1 Week | YTD |
|---|---|---|---|---|---|
OCL | Objective Corporation | -19.8% | $5.98 | -14.6% | -63.9% |
NXL | Nuix | -6.1% | $2.00 | 39.9% | 10.5% |
WTC | Wisetech Global | -4.2% | $39.19 | -2.7% | -42.8% |
PPS | Praemium | -4.1% | $0.71 | 0.0% | -10.7% |
WBT | Weebit Nano | -4.0% | $3.82 | -9.5% | -23.6% |
NXT | NextDC | -3.6% | $13.30 | -5.0% | 8.0% |
SDR | Siteminder | -2.9% | $3.02 | -21.8% | -50.7% |
XRO | Xero | -2.8% | $81.60 | -3.8% | -28.3% |
360 | Life360 | -2.7% | $19.93 | -3.1% | -38.1% |
ZIP | Zip Co | -1.9% | $2.57 | -10.8% | -21.4% |
BVS | Bravura Solutions | -1.8% | $3.05 | -3.9% | 18.5% |
IFT | Infratil | -1.5% | $12.09 | -2.8% | 26.2% |
DTL | Data#3 | -1.4% | $10.94 | 15.2% | 22.0% |
IRE | Iress | -1.3% | $6.06 | -2.6% | -27.7% |
PME | Pro Medicus | -1.3% | $182.23 | -8.2% | -17.4% |
TNE | Technology One | -1.1% | $32.19 | -2.8% | 16.8% |
CDA | Codan | -0.9% | $48.89 | 2.6% | 72.0% |
CAT | Catapult Sports | -0.9% | $3.43 | -6.0% | -17.5% |
DDR | Dicker Data | -0.8% | $12.80 | -0.8% | 24.4% |
HSN | Hansen Technologies | -0.7% | $3.48 | 3.1% | -34.2% |
MP1 | Megaport | -0.6% | $17.40 | -21.9% | 53.3% |
DGT | Digico Infrastructure REIT | -0.4% | $2.56 | -9.5% | -8.2% |
AD8 | Audinate Group | 0.8% | $2.58 | 6.2% | -36.5% |
MAQ | Macquarie Technology Group | 0.9% | $61.11 | 0.3% | -8.8% |
Top ASX 200 gainers
[10:28 am] Ramsay rallies on a better-than-expected FY26 result, Domino's bounces after yesterday's ~6% results-driven dip and MinRes higher on a dividend surprise.
Ticker | Company | % Chg | Price |
|---|---|---|---|
RHC | Ramsay Health Care | 12.79% | $49.65 |
EOS | Electro Optic Systems | 6.05% | $11.92 |
DMP | Domino's Pizza | 4.84% | $19.71 |
TAH | Tabcorp | 4.07% | $0.95 |
GNC | Graincorp Class | 3.79% | $6.02 |
MIN | Mineral Resources | 3.74% | $69.39 |
MSB | Mesoblast | 3.18% | $2.44 |
IGO | IGO | 2.93% | $8.43 |
DRO | Droneshield | 2.59% | $1.78 |
WOR | Worley | 2.53% | $10.15 |
QAN | Qantas Airways | 2.39% | $9.44 |
4DX | 4Dmedical | 2.23% | $3.90 |
LYC | Lynas Rare Earths | 1.94% | $16.25 |
XYZ | Block | 1.54% | $115.95 |
RMD | Resmed | 1.52% | $32.79 |
ANN | Ansell | 1.35% | $40.14 |
CWY | Cleanaway | 1.18% | $2.58 |
LNW | Light & Wonder | 1.13% | $131.02 |
AMC | Amcor | 1.04% | $65.94 |
ELD | Elders | 1.02% | $5.92 |
Top ASX 200 losers
[10:28 am] GDG, Magellan and Sigma Healthcare tumble on FY26 results, while copper, gold and uranium stocks experience a broad pullback.
Ticker | Company | % Chg | Price |
|---|---|---|---|
GDG | Generation Development Group | -13.54% | $3.32 |
MFG | Magellan Financial Group | -10.14% | $9.93 |
NEC | Nine Entertainment Co | -7.66% | $0.97 |
SIG | Sigma Healthcare | -6.16% | $2.67 |
OBM | Ora Banda Mining | -4.64% | $1.54 |
FFM | Firefly Metals | -4.43% | $1.84 |
DYL | Deep Yellow | -4.17% | $1.73 |
PDN | Paladin Energy | -3.78% | $12.10 |
CNI | Centuria Capital Group | -3.38% | $1.29 |
IPX | Iperionx | -3.10% | $2.97 |
CYL | Catalyst Metals | -3.04% | $6.70 |
ALK | Alkane Resources | -3.03% | $1.92 |
PPT | Perpetual | -3.01% | $18.99 |
PNR | Pantoro Gold | -2.90% | $2.68 |
NWL | Netwealth Group | -2.83% | $21.64 |
TPG | TPG Telecom | -2.73% | $3.74 |
MI6 | Minerals 260 | -2.65% | $0.92 |
EVN | Evolution Mining | -2.64% | $15.48 |
INA | Ingenia Communities Group | -2.51% | $3.89 |
ARB | ARB Corp | -2.48% | $20.05 |
Ramsay lifts underlying NPAT 23% in constant currency with all regions growing EBIT
[10:22 am] Ramsay's FY26 came in ahead on earnings as the Australian transformation gained traction, with a step-up in the dividend and the Ramsay Santé separation heading to a November shareholder vote. The stock is up 13.2% to $49.83 in early trade.
Revenue not disclosed in the release
Consolidated Group underlying EBIT up 11.5% to $1,162.2m vs $1,082m ests (7% beat)
Australia underlying EBIT up 11.2% to $639.8m with margin up 30bps, on activity growth of 3.3%, visiting medical officers up 3.3% and theatre utilisation up about 90bps
UK region underlying EBIT up 13.2% to $191.6m, with Ramsay UK up 9.0% to $160.5m despite an 8% decline in NHS activity and Elysium up 41.4% to $31.1m
Underlying PBT up 26.8% to $570.4m and underlying NPAT up 20.6% to $365.4m
EPS of about 158cps vs 142.3cps ests (11% beat)
Fully franked final dividend up 21.3% to 48.5cps takes the full-year payout to 91cps vs 85cps ests (7% beat), up 13.8%
Group capex came in below the revised range at $729m in constant currency, with Funding Group ROCE up 150bps to 14.8% and leverage below 2x
FY27 guidance is for Funding Group EBIT growth and margin improvement across Australia and both UK businesses, with capex of $480–520m, net financing expense of $280–300m, a roughly 30% effective tax rate and a 60–70% payout ratio
Company page: Ramsay Health Care (RHC)
Generation Development beats on revenue and profit as net inflows hit a record
[9:45 am] GDG's first full year with the integrated Evidentia platform delivered revenue and underlying profit ahead of expectations, though the dividend came in below where the market had it.
Group revenue up 23% to $178.7m vs $170.1m ests (5% beat)
Group FUM up 37% to $46.5bn on record net inflows of $9.7bn, up 19%
Investment Bonds FUM up 35% to $5.95bn with annual gross sales above $1.5bn, while managed account FUM rose 37% to $40.5bn on $8.4bn of net inflows
Lonsec research coverage up 9% to 2,001 products and iRate subscribers up 13% to 5,629
Underlying NPAT up 21% to $40.7m vs $38.0m ests (7% beat)
Final fully franked dividend of 1.0cps takes the full-year payout to 2.0cps vs 2.5cps ests (20% miss)
Cash and cash equivalents up 8% to $97.5m, excluding $17.3m of client monies held in trust
FY27 guidance is qualitative, with strong FUM growth expected, product revenue margins broadly stable and underlying operating expense growth broadly in line with FY26
Company page: Generation Development Group (GDG)
Capricorn declares 5c final dividend on record FY26
[9:44 am] A record year for the gold producer on a A$6,241/oz average realised price, with FY27 guidance pointing to a step change in production as the Karlawinda expansion completes commissioning this quarter.
Note: estimates are Macquarie rather than consensus.
Sales revenue up 46% to $769.3m vs $735m ests (5% beat), on 123,096oz sold at an average price of $6,241/oz
Underlying EBITDA up 63% to $483.6m vs $481m ests (in line), at a 63% margin
Underlying NPAT up 59% to $327.2m vs $324.6m ests (1% beat)
Gold production of 123,589oz at an AISC of $1,629/oz, both in line with ests and meeting guidance
Operating cash flow up 81% to $470.2m vs $346m ests (36% beat), with net cash up $149.1m to $504.8m
Fully franked final dividend of 5c worth $22.8m, taking FY26 dividends to 10c in the company's first year of payouts
FY27 production guidance of 137,000–147,000oz, up 18.3% at the midpoint, but 2% below ests
FY27 AISC guidance of $1,900–2,100/oz, with the $2,000/oz midpoint 7% above ests, on reserve optimisation at a higher gold price pulling lower-grade ore into the plan
Company page: Capricorn Metals (CMM)
Sigma delivers 20.6% EBIT growth in its first full year with Chemist Warehouse
[9:38 am] Sigma's first complete post-merger year landed marginally short across the earnings lines, with international scaling fast off a small base and Ireland turning profitable for the first time.
Note: estimates are from Macquarie rather than consensus.
Revenue up 15.5% to $10.8bn vs $10,938m ests (1% miss)
Australian segment revenue up 14.9% to $10.4bn, with gross margin broadly held at 17.6% despite dilution from GLP-1 volumes
International segment revenue up 33.0% to $421.4m, with network sales to consumers up 23.3% to more than $1.6bn from 98 stores
CW branded network sales up 15.9% with like-for-like sales up 13.4% vs 13.7% ests, and network sales to consumers of around $10.2bn
Normalised EBIT up 20.6% to $1,090.0m vs $1,099.9m ests (1% miss), with margin up to 10.1% from 9.6% and in line with the 10.1% ests
Normalised NPAT up 22.3% to $732.3m vs $737.1m ests (1% miss)
Final fully franked dividend of 2.0cps takes the FY26 total to 4.0cps vs 3.8cps ests (5% beat), within the 50–70% payout policy
Net debt down to $663.2m at 0.57x normalised EBITDA vs 0.6x ests, with capex held at $56.7m and the debt facility reduced to $1.4bn
Integration synergies of $32.6m delivered against $25.9m of one-off costs, tracking towards the $100m annual target by FY29
FY27 rollout of 13 Chemist Warehouse stores in Australia and 19 internationally in 1H27 including UK entry, plus 42 Amcal and Discount Drug Stores openings, with a full trading update due at the October AGM
Company page: Sigma Healthcare (SIG)
Biome signs China distribution deal for Activated Probiotics
[9:34 am] Biome has signed a heads of agreement with H&S Global to take its Activated Probiotics range into China via cross-border e-commerce, with launch planned inside FY27.
Exclusive cross-border e-commerce distribution agreement covering mainland China, on a three-year initial term, with exclusivity binding for year one and continuation into years two and three subject to agreed purchase targets
H&S Global buys product from Biome for resale and operates the brand stores and channel presence, while Biome retains brand strategy, marketing investment and all rights to the Activated Probiotics and Activated Therapeutics brands and proprietary strains
No volumes, targets or launch date disclosed, with those to be confirmed on execution of a master distribution agreement later this year
China's probiotics category was worth about US$10.8bn in 2025 and is forecast to reach US$29.3bn by 2033, a 13.1% CAGR, with e-commerce accounting for an estimated 60–70% of dietary supplement retail sales
Company page: Biome Australia (BIO)
Aurelia beats on earnings and declares its first dividend
[9:32 am] Aurelia's FY26 came in ahead on revenue and well ahead on profit, with strong metal prices lifting margins enough to fund a maiden fully franked dividend the market had not modelled.
Note: Macquarie is pretty much the only major broker that covers Aurelia, the below ests refer to their forecasts and not consensus
Total revenue up 40% to $480.2m vs $469m ests (2% beat)
EBITDA up 55% to $189.2m vs $174m ests (9% beat)
Net profit after tax up 69% to $82.7m vs $60m ests (38% beat)
Operating cash flow up 10% to $142.8m vs $166m ests (14% miss)
Fully franked final dividend of 1.0cps totalling about $17.2m, against nil in ests
Cash of $143.9m with no drawn debt following completion of the balance sheet refinance
FY27 guidance of 50–60koz gold, 2.5–3.5kt copper, 26–34kt zinc and 17–25kt lead, with the gold, zinc and lead midpoints all sitting above ests and copper in line
FY27 cost guidance of $340–375m operating, $65–75m sustaining capital, $50–70m growth capital and $14–18m exploration, with the $357.5m operating midpoint running about 11% above ests
Company page: Aurelia Metals (AMI)
Appen swings to positive EBITDA as China more than doubles its contribution
[9:29 am] Appen's first half turned on China, where revenue jumped 80% and EBITDA quadrupled, while the Global business kept shrinking as it works through its turnaround.
Note: no broker estimates are available for Appen, so no beat/miss comparisons are shown. Figures are in US dollars unless stated.
Group revenue up 17% to US$119.9m
Appen China revenue up 80% to US$76.2m, with an annualised run rate above US$175m exiting June
Appen Global revenue down 27% to US$43.7m, though Q2 was up 20% on Q1 and up 65% excluding the largest client
Underlying EBITDA before FX of US$5.3m, a US$7.5m improvement on the prior corresponding period
Appen China underlying EBITDA before FX up 316% to US$12.1m, against an Appen Global loss of US$4.5m, itself 25% narrower
Cash of US$44.7m (A$64.8m) at 30 June, with no dividend mentioned
FY26 guidance reaffirmed at revenue of US$270–300m and underlying EBITDA before FX margin of roughly 5–10%
Company page: Appen (APX)
Qantas absorbs a $610m fuel hit and still beats on underlying earnings
[9:27 am] Qantas delivered a lower result on every headline earnings line as jet fuel costs surged through the second half, though unit revenue ran well ahead of what the market had assumed.
Note: Ests refer to Morgan Stanley forecasts rather than consensus.
Group RASK up 4.6% against 2% ests, with TRASK up 3.6%, so the revenue quality was materially better than modelled
Total fuel cost hit $5.7bn including a $610m second-half impact, with Brent hedging worth $400m and jet refining margins spiking from US$20 a barrel in February to a peak near US$120
Group Domestic underlying EBIT of $1.44bn with Qantas Domestic revenue up 5% on 3% more capacity, and Jetstar Domestic earnings up 15% on 11% revenue growth
Group International underlying EBIT of $650m, with Qantas International revenue up 8% and premium cabin revenue up 15%, twice the rate of Economy
Qantas Loyalty underlying EBIT up 12% to $625m, with points earned and redeemed both up 9% and a record 5 million flight Reward Seats
Underlying profit before tax down 13.8% to $2,064m vs $1,968m ests (5% beat)
Underlying EPS down 12.7% to 96cps vs 91cps ests (5% beat)
Final fully franked base dividend of $300m (19.8cps) takes the FY26 total to 39.6cps vs 36cps ests (10% beat), though the $150m buyback flagged at the half will not proceed
Net debt up to $6.2bn, mid-range against the $5.5–6.9bn target, with net capex of $4.0bn and liquidity of $13.3bn
FY27 guidance is for Group Domestic and Group International TRASK both up 8–10% in 1H27, Loyalty underlying EBIT growth of 5–7%, net capex of $4.3–4.6bn, 1H27 fuel of about $3.6bn and around $475m of transformation
Company page: Qantas Airways (QAN)
Perpetual lifts UPAT 6% and beats on earnings despite softer revenue
[9:23 am] Perpetual's FY26 result came in ahead on underlying profit and the dividend, with Corporate Trust and the cost-out program offsetting a currency-affected Asset Management top line.
Note: estimates refer to Macquarie forecasts rather than consensus.
Operating revenue flat at $1,374.2m vs $1,388m ests (1% miss)
Asset Management revenue down 3% to $880.5m vs $900m ests (2% miss), with total AUM down 1% to $224.4bn vs $224.6bn ests (in line)
Corporate Trust FUA up 6% to $1,349.3bn and Digital and Markets AUA up 14% to $638.6bn, while Wealth Management FUA rose 3% to $22.1bn
UPBT up 6% to $295.8m vs $282m ests (5% beat),
Corporate Trust UPBT up 9% to $98.8m vs $96.7m ests (2% beat)
Asset Management UPBT up 3% to $207.5m and Wealth Management down 15% to $44.0m, with no like-for-like segment ests available on the same basis
UPAT up 6% to $217.0m vs $209m ests (4% beat)
Statutory NPAT of $88.9m against a $58.2m loss, well short of the $215m ests, which did not carry the $63.5m non-cash TSW goodwill impairment inside the $128.1m of post-tax significant items
Final unfranked dividend of 63cps takes the FY26 total to 122cps vs 109.5cps ests (11% beat), a 65% payout of UPAT
Company page: Perpetual (PPT)
Bapcor clears the top of EBITDA guidance but books a $431.6m statutory loss
[9:18 am] Bapcor's reset year ended with underlying EBITDA above the upper end of its May guidance and net debt cut sharply, though non-cash impairments dominated the statutory line and no dividend was declared.
Underlying revenue down 1.8% to $1,924.1m vs $1,925m ests (in line)
Underlying EBITDA down 34.6% to $152.5m vs $147m ests (4% beat), exceeding the top of the May 2026 guidance range
Underlying NPAT down 85.0% to $10.8m vs $10m ests (8% beat)
Statutory loss of $431.6m, against a restated $19.1m profit, including $442.4m of post-tax significant items that are primarily non-cash impairments, so the statutory and underlying lines are not comparable
No final dividend declared, with cash preserved for the turnaround, in line with ests of nil
Net debt down $229.8m to $135.0m, a 63.0% reduction, helped by the $200m February equity raising, with net leverage at 1.72x adjusted EBITDA against a 3.5x covenant
Working capital initiatives delivered $68.5m of cash flow in 2H26, within the $60–75m guided range, lifting cash conversion to 109.4% from 86.5%
FY27 guidance is for modest revenue growth with underlying NPAT materially weighted to the second half, capex and D&A in line with FY26, and turnaround benefits largely reinvested in technology and people
Company page: Bapcor (BAP)
IGO returns to profit with $145m NPAT and reinstates dividend at 5c
[9:15 am] A year of portfolio simplification for the miner, with TLEA swinging back to profit and Nova beating on costs ahead of divestment, though Kwinana again fell short of guidance.
Revenue down 12% to $462.9m vs $455m UBS (2% beat)
Reported EBITDA of $322.9m from a $709m loss vs $100m UBS, with underlying EBITDA of $285.9m from a $43m loss
Group NPAT of $145.3m vs $124m UBS (17% beat), against a $954.6m loss in FY25
Underlying NPAT of $109.1m against a $173.3m underlying loss, with the swing driven by IGO's $207.3m share of TLEA net profit from a $642m share of losses
Operating cash flow up 209% to $132.4m and underlying free cash flow up 176% to $134.0m
Cash of $386.5m up 38% and in line with UBS, with $99.1m of marketable securities and the $300m facility undrawn
Final fully franked dividend of 5.0 cps worth $37.9m vs nil UBS, at 30% of underlying free cash flow and the midpoint of the capital management guideline
FY27 Greenbushes guidance of 1,550-1,750kt spodumene, up 17% at the midpoint, at a cash cost of $380-440/t and capex of $250-300m
FY27 Kwinana guidance of 9,000-11,000t lithium hydroxide, unchanged after the FY26 miss, with conversion costs of $16,000-18,000/t
Nova divestment to Global Lithium for $7.0m expected to complete after mining ceases in the December quarter, subject to ACCC approval
Company page: IGO (IGO)
Ai-Media lifts ARR 50% to $36m and beats Morgans on revenue, but group sales fall 7%
[9:14 am] Ai-Media posted FY26 revenue of $60.2m, 9% ahead of Morgans, though the wind-down of legacy services left group revenue down 7% and full year EBITDA at a small loss.
ARR up 50% to $36.0m at an 85% gross margin, meeting guidance but implying only $6m of additions in 2H26 after ARR reached $30m at the half
Revenue down 7% to $60.2m vs $55.0m Morgans ests (9% beat), on the planned reduction in legacy services and lower hardware sales
SaaS revenue up 42% to $34.1m, with technology revenue up 9% to $44.8m and now 74% of group revenue from 63% in FY25
Gross profit of ~$44m vs $39.9m Morgans ests (10% beat), at a 73% group margin up 4ppts from 69%
Full year EBITDA loss of $0.3m vs a $0.3m loss Morgans ests (in line), with adjusted EBITDA of $2.1m before share-based payments and restructuring
Second half adjusted EBITDA of $2.5m against a $0.4m loss in 1H26
Operating cash flow of $2.4m with year-end cash of $15.9m and no external debt
All top 20 customers retained for a fifth consecutive year, with the footprint expanded to 46 countries after adding 9 markets in FY26
No FY27 ARR guidance until the AGM on 30 September
Company page: Ai-Media Technologies (AIM)
Wesfarmers delivers a clean in-line result with Bunnings and Kmart carrying the load
[9:11 am] Wesfarmers landed FY26 close to expectations across the board, with retail operating leverage offsetting a WesCEF earnings hit from Middle East-driven ammonia pricing.
Revenue up 3.4% to $47,274m vs $47,246m ests (in line)
EBIT (ex-items) up 7.3% to $4,493m vs $4,442m ests (1% beat), with reported EBIT up 0.6%
NPAT (ex-items) up 8.3% to $2,874m vs $2,833m ests (1% beat)
Operating cash flow down 6.5% to $4,272m on deliberate working capital investment in WesCEF spodumene and fertiliser inventory and Health contingency stock, with retail cash realisation at 99%
Final fully franked dividend of 120cps takes the full-year payout to 222cps vs 219.2cps ests (1% beat), up 7.8%, on top of the $1.50 per share capital management distribution paid in December totalling $1,703m
FY27 net capex guided to $1,300–1,500m including about $200m on the Mt Holland mine and concentrator expansion, with borrowing costs expected to be higher on increased net debt and cost of funds
Mt Holland spodumene production guided to nameplate of roughly 380kt in FY27 (WesCEF share about 190kt) after FY26 production of 209kt beat both guidance and nameplate, though refinery ramp-up was hampered by intermittent odour issues
On current trading through the first seven weeks of FY27, Bunnings sales growth was slightly stronger than 2H26 helped by dry July weather, Kmart Group was in line, and Officeworks stayed positive but slightly below. Blackwoods and Workwear Group moved into Bunnings from 1 July 2026.
Company page: Wesfarmers (WES)
Jumbo posts record EBITDA as Dream acquisitions carry the result
[9:10 am] Jumbo's first year owning the Dream Giveaways businesses delivered its highest ever EBITDA, masking a 10% decline in Australian earnings against a much weaker jackpot backdrop.
Note: estimates are from Macquarie rather than consensus.
TTV up 13.0% to $1,125.8m, with revenue margin up 2.6ppts to 17.2%
Lottery Retailing TTV down 8.2% against just 23 large jackpots and no $100m-plus draws, versus 31 and four respectively in FY25
SaaS TTV up 15.1%, or up 18.6% excluding Lotterywest, with revenue up 20.1% on that same basis
Revenue up 33.2% to $193.6m vs $201m ests (4% miss)
Underlying EBITDA up 24.8% to $85.2m vs $84m ests (1% beat), with margin down 3.8ppts to 43.2%
Australia underlying EBITDA down 10.1% to $55.0m vs $54m ests (2% beat), at a 47.7% margin
Managed Services EBITDA up 18.1% to $8.4m vs $8m ests (5% beat), and Dream Giveaways contributing $21.8m vs $22m ests (in line) from a partial-year hold
Underlying NPAT up 3.7% to $41.4m vs $41m ests (1% beat)
Underlying NPATA up 19.5% to $50.6m vs $52m ests (3% miss), the gap to NPAT reflecting amortisation on the Dream acquisitions
Final fully franked dividend of 15.0cps takes the full-year payout to 27.0cps vs 25.0cps ests (8% beat), a 49.5% payout under the revised 30–50% policy and down from 54.5cps in FY25
FY27 guidance for Australia underlying EBITDA margin of 46–50% and international underlying EBITDA of $36–40m, the $38m midpoint implying 25% growth on FY26's $30.3m
Company page: Jumbo Interactive (JIN)
Bubs grows revenue 9% as US expansion offsets weakness everywhere else
[9:07 am] Bubs lifted underlying earnings sharply in FY26, but airfreight, regulatory and tariff costs pushed reported EBITDA into the red and took 800bps out of gross margin.
Note: no broker estimates are available for Bubs, so no beat/miss comparisons are shown.
Group revenue up 9.2% to $111.9m
US revenue up 24% to $65.8m with distribution now beyond 10,000 stores,
Australia fell 7% to $18.3m, ROW dropped 25% to $6.4m and China was flat at $21.4m
Gross profit down 9.4% to $44.5m, with gross margin down 800bps to 39.8%
Underlying EBITDA up 342% to $5.3m, excluding temporary airfreight ($3.0m), regulatory reset ($3.9m) and non-AU tariff ($1.0m) costs
Reported EBITDA a loss of $1.8m, against a $5.2m profit in FY25, so the underlying and reported lines are not comparable
Period end cash of $9.4m plus $10.0m of undrawn facilities, with the NAB facility extended to 31 August 2027
H1 FY27 outlook is for positive revenue growth and a gross margin rebound, with regional performance still mixed and the FDA approval pathway described as on track
Company page: Bubs Australia (BUB)
ReadyTech lands inside revised guidance but FY27 outlook sits below ests
[9:04 am] ReadyTech finished FY26 within its downgraded revenue range, with flagship product growth swamped by churn in the mature base and a cash margin management insists has now bottomed.
Revenue up 3% to $125.0m vs $125.5m ests (in line), landing at the bottom of the revised $125–127m range
Education and Work Pathways revenue slipped to $43.1m from $43.5m on lower services and implementation revenue, Workforce grew 10.4% to $38.1m, and Government and Justice was broadly stable at $43.8m though segment margin fell to 22.9% from 27.5%
Mature products accounted for roughly 67% of FY26 dollar churn, while flagship subscription revenue compounded at a 13.2% three-year CAGR led by Ready Workforce at 25.4%
Subscription revenue of $103.8m, representing 83% of total revenue as recurring
Underlying EBITDA down 11% to $35.0m vs $36.2m ests (3% miss), with margin down to 28.1% from 32.5%
Underlying cash EBITDA of $15.8m at a 12.6% margin, down from 16.0% and consistent with the guided low-teens range
FY27 revenue guidance of $128–132m, with the $130m midpoint about 2% below ests, and cash EBITDA margin guided to 15–17%
Company page: ReadyTech Holdings (RDY)
VEEM lands at the top of guidance with revenue down 25%, but 2H defence work drives EBITDA swing
[9:03 am] VEEM delivered FY26 revenue and EBITDA both at the upper end of guidance, with second half earnings swinging $4.0 million on ASC submarine refit deliveries and a recovery in propeller orders.
Revenue down 25% to $51.7m vs $51.5m ests (in line), at the top of $50m to $52m guidance
Defence revenue up 130% to $8.6m in 2H26 from $3.7m in 1H26, with ASC deliveries expected to stay strong into 1H27
Gyro revenue down $9.5m on no sales at all in 1H26, with the order book at just $1.0m following the Mark III launch
Engineering products and services revenue down 14% to $14.3m as defence took a greater share of capacity in 2H26
EBITDA of $3.6m vs $3.0m ests (21% beat), at the top of $3.25m to $3.75m guidance
Second half revenue of $28.3m up 21% on 1H26, with 2H EBITDA of $3.8m swinging $4.0m from a first half loss
EPS of -12.40c vs 1.5c ests, from 2.22c in FY25
Operating cash flow up 64% to $4.8m on higher defence revenue and accelerating ASC deliveries
Net debt down $12.5m to $1.2m after a $13.1m net capital raise, with $7.1m of undrawn overdraft and trade facilities
Hunter Class Frigate demonstrator specifications received from BAE Systems Australia, with successful completion qualifying VEEM as one of only two suppliers globally and progressing it to final tender
No FY27 guidance provided, with the focus shifting to commercialising the VEEM Extreme range and Mark III gyro
Company page: VEEM (VEE)
MinRes reinstates dividend as underlying NPAT soars 831%
[9:00 am] Mineral Resources delivered the strongest result in its 20 years as a listed company and issued a fully franked 83 cps dividend declared against UBS forecasts of no payout.
Revenue up 44% to $6.5bn on record volumes across all divisions and higher commodity prices
Underlying EBITDA up 183% to $2.6bn at a 39% margin, a record
Mining Services underlying EBITDA a record $976m on 341Mt of production volumes
Onslow Iron shipped 19.7Mt at a $52/t FOB cost for $909m of underlying EBITDA, with the Pilbara Hub adding 9.9Mt at $79/t for $98m
Lithium contributed $771m of underlying EBITDA, with Wodgina at 317k dmt SC6 for $470m and Mt Marion 242k dmt SC6 for $302m
Underlying NPAT up 831% to $822m vs $743m UBS (11% beat)
Reported NPAT up 236% to $1.2bn, including a $168m non-cash FX gain, a $134m gain on MSIP contingent consideration and a $69m Lucky Bay garnet impairment
Fully franked full year dividend of 83 cps vs nil UBS, a 20% payout of underlying NPAT and up from nil in FY25
Net debt down $1.1bn to $4.3bn vs $4,283m UBS (in line), with leverage at 1.7x from 5.9x and liquidity doubling to $2.4bn
POSCO sell-down of US$765m would take net debt to ~$3.2bn or ~1.2x on completion in 1H27, against UBS of $2.7bn at FY27 year end
FY27 Mining Services volumes guided to 370-390Mt, up 11% at the midpoint, on total capex of $1.4bn versus $1.2bn
Company page: MinRes (MIN)
Atlas Arteria posts a statutory loss on takeover and put option costs
[8:57 am] Atlas Arteria's headline number went red on one-off costs tied to the IFM takeover and the Chicago Skyway put option, while a weaker currency dragged on translated toll revenue.
Statutory net loss after tax of $73.3m, against a $73.3m net profit in the prior corresponding period
Underlying net profit after tax up 29% to $94.3m, excluding non-operating costs from the put option extinguishment and the takeover offer
Proportional toll revenue down 3.9% on unfavourable FX, though up 0.6% on an underlying basis excluding currency
Proportional EBITDA down 3.6%, with margin up to 76.6% from 76.4%
Interim distribution of 20.0cps in line with ests, with 2026 guidance reaffirmed at 40.0cps and the 90–110% of free cash flow payout policy retained
Chicago Skyway put option held by OTPP extinguished for US$100m, settled in August and funded through a new corporate debt facility
IFM's relevant interest lifted from 34.5% to 67.4% following the unsolicited takeover offer
Company page: Atlas Arteria (ALX)
Smartgroup beats on revenue as EV demand pulls novated leasing higher
[8:56 am] Smartgroup's first half was driven by an EV order surge that management concedes was partly brought forward, with revenue running ahead of expectations while earnings landed close to them.
Note: Below estimates refer to Morgans ests, not consensus.
Revenue up 13% to $179.5m vs $172.5m ests (4% beat)
Operating expenses up 12% to $100.6m
Operating EBITDA up 16% to $73.8m vs $73.4m ests (in line), with margin up 1ppt to 41%
NPATA up 11% to $42.4m vs $42.1m ests (in line), with statutory NPAT also $42.4m
Interim fully franked dividend up 10% to 21.5cps vs 20.0cps ests (8% beat), a 70% payout of NPATA
Novated leasing settlements up 17% and new lease vehicle orders up 34%, with BEV orders up 162% and accounting for 68% of new orders against 27% for ICE
Fleet vehicles under management up 12% to 36,200 and active packaging customers up 34,000 to 518,000, with direct leasing yield up 2%
FY27 EBITDA margin target reaffirmed in the mid-40s range, with CY26 capex guided to $13–15m and net debt at just 0.2x EBITDA
Company page: Smartgroup Corporation (SIQ)
Interesting comments from Nvidia management
[8:51 am] Management talk the durability of the demand cycle while flagging that supply and input costs, not orders, are the binding constraint.
On the FY28 outlook: "We expect to grow revenue by approximately 70% in fiscal 2028. This is a supply-constrained outlook"
On what demand would look like without those constraints: "The unconstrained would be a lot higher"
On memory costs: "We are experiencing extreme pricing conditions in memory. The magnitude of the price increase has exceeded our prior expectations and is headed even higher into next year"
On the roughly $50bn invested in frontier AI labs: "We recognise the scale of this support, and we know some will call this circular financing. We see it differently"
On those customers: "These are once-in-a-generation companies. The technology leadership is proven and their customer traction and usage are skyrocketing. We expect them to become the largest technology companies in history"
On OpenAI and Anthropic building their own chips: "I have 100% confidence that our technology will continue to be extraordinary for them, and they're going to use it, so I've every confidence that they're going to be customers of ours for a very long time"
On the state of the technology: "We could say that we've already achieved AGI"
Nvidia beats across the board and guides Q3 above consensus
[8:50 am] Nvidia's July quarter delivered a 4% revenue beat with data centre still compounding at triple-digit rates, and the Q3 guide came in ahead despite assuming nothing from China. The stock is up 4.3% after hours.
Revenue up 106% to US$96.2bn vs US$92.2bn ests (4% beat)
Data Center revenue up 117% to US$89.0bn vs US$85.8bn ests (4% beat)
Edge Computing revenue up 27% to US$7.2bn vs US$6.61bn ests (9% beat)
Adjusted gross margin of 75.0% vs 75% ests (in line), up 250bps year on year
Adjusted operating income up 124% to US$64.0bn, with adjusted opex up 54% to US$8.2bn
Adjusted net income up 118% to US$54.0bn and adjusted EPS up 120% to US$2.22 vs US$2.10 ests (6% beat)
Free cash flow of US$21.3bn, with about US$26.0bn returned to shareholders in the quarter and roughly US$99.0bn left on the buyback authorisation
Q3 revenue guidance of US$108.0bn plus or minus 2% vs US$104.2bn ests (4% beat), with adjusted gross margin guided to 74.0% plus or minus 50bps
CrowdStrike lifts FY27 outlook as net new ARR jumps 51%
[8:48 am] CrowdStrike beat on every line in the July quarter and raised full-year guidance, with the ARR reacceleration the standout after a soft patch through last year.
Revenue up 26% to US$1.47bn vs US$1.44bn ests (2% beat)
Adjusted EPS up 35% to US$0.31 vs US$0.29 ests (7% beat)
Net new ARR up 51% to a record US$333m, taking total ARR up 25% to US$5.84bn
Free cash flow up 33% to US$377.4m vs US$353m ests (7% beat), with net operating cash flow of US$530.3m
Non-GAAP operating margin of 25%, with no comparable ests provided for the metric
FY27 revenue guidance of US$5.99–6.01bn vs US$5.93bn ests (1% beat) and adjusted EPS of US$1.25–1.26 vs US$1.23 ests (2% beat), with ARR guided to US$6.60–6.61bn
Q3 revenue guidance of US$1.52–1.53bn vs US$1.51bn ests (1% beat), with adjusted EPS of US$0.31 sitting in line
Crowdstrike is one of the main holdings in most cybersecurity-related ETFs (e.g. a 7.9% weight in the HACK ETF). The stock is up 9.8% after hours.
Core PCE lands in line and gives the Fed room to sit still
[8:45 am] July's inflation print did nothing to force the Fed's hand, but it also did nothing to bring inflation back towards target, leaving Friday's Jackson Hole speech as the next real event risk.
Core PCE rose 0.2% month on month and 3.3% year on year, matching expectations, while the headline gauge was up 3.7% year on year and still comfortably above the 2% goal
Inflation-adjusted consumer spending was flat in July after strong May and June gains, with core goods outlays down 0.8% and services spending up 0.3%
Treasury yields and the US dollar rose on the release
The consumer looks less stretched than the spending line suggests, with real disposable income up 0.4% (the most since January) and the saving rate at a four-month high of 3%
Source: Bloomberg
Jackson Hole puts Warsh under pressure as hike bets build
[8:44 am] Two of the world's biggest central banks are edging towards tighter policy at the same time, and markets are heading into Friday's Jackson Hole speech with little guidance on how far the Fed is willing to go.
Kevin Warsh delivers his first major speech as Fed chairman on Friday, with investors still without a clear read on how he intends to bring inflation back to 2%
Treasury yields edged higher after a key US inflation gauge stayed well above target, sustaining expectations the Fed begins raising rates before year end
The ECB is leaning the same way, with Executive Board member Isabel Schnabel telling Bloomberg further hikes are needed given inflation is projected to run above 2% for an extended period
Oil keeps falling on a Hormuz framework that is not yet a reopening
[8:43 am] Iran and Oman have outlined a temporary shipping corridor through the Strait of Hormuz, and crude has sold off for a third straight session even though almost nothing has changed on the water.
The proposed corridor would be seven miles wide, with the entry and part of the exit running through Iranian territorial waters, and would close the UN-authorised southern route hugging Oman's coast that ships have been using under US naval protection
Traffic data undercuts the optimism, with just five commodity vessels transiting the strait on Tuesday against a 10-day average of 15, versus roughly a fifth of global crude that moved through before the war
The Revolutionary Guard says the strait stays shut until Washington accepts Tehran's conditions under the collapsed June MoU, including sanctions relief and the release of frozen assets
Demining is the harder constraint, with experts noting Iran's mine capability is built for laying rather than clearing, and that reopening declarations alone will not restore shipping and insurance confidence
The new US sanctions campaign covers 60-plus entities across digital assets, technology, gold, aviation and shipping, but Treasury has held off on secondary sanctions against Chinese banks, with Beijing, which buys around 90% of Iran's crude, warning it will act to protect its interests
Good morning!
[8:25 am] ASX 200 futures are down 4 pts (-0.04%). Here's what happened overnight:
Major US benchmarks finished slightly lower, in a relatively narrow and rangebound session
S&P 500 (-0.02%), Equal-weight S&P 500 (+0.15%), Nasdaq (-0.08%), Dow (-0.21%), Russell 2000 (-0.14%)
Nvidia beat on every line and guided well above expectations, Q2 revenue up 106% year-on-year to US$96.2bn (x16 what it made four years ago) and guided to Q3 revenue of ~US$108bn, shares up approximately 4% after hours
A December Fed hike is now fully priced after US core PCE rose 3.3% year-on-year in July, in-line with estimates but above the Fed's 2% target for a 65th consecutive month