What to watch for with ASX iron ore stocks BHP, RIO, FMG and CIA after latest China stimulus news
China has announced its intent to deliver a substantially expanded range of stimulus measures. We check the response of ASX iron ore stocks.


Source: Shutterstock, Market Index
Mentioned
KEY POINTS
- On Monday, China’s Politburo released a detailed statement on how it intends to proceed with a range of targeted stimulus measures in 2025 and beyond.
- The response from markets has been mixed given no new specific measures were announced, but key resources and energy stocks are sharply higher.
- We investigate how ASX listed iron ore stocks BHP Group (BHP), Rio Tinto (RIO), Fortescue (FMG), and Champion Iron (CIA) have responded to the potentially positive developments
In a meeting Monday evening local time, a communique released by the Chinese Politburo painted a very broad picture of the Chinese Government's intentions with respect to its economy over the medium term.
Whilst there were no new specific measures announced, markets have broadly taken a positive view towards the language used in the announcement, particularly comments relating to “A more proactive fiscal policy and an appropriately loose monetary policy” and the “strengthening extraordinary counter-cyclical adjustments”.
Here are the key takeaways from the Chinese Politburo’s readout:
Boosting Consumption and Investment: The Politburo emphasizes the need to "vigorously boost consumption, improve investment efficiency, and expand domestic demand in all aspects."
Technological Innovation and Industrial Development: The Politburo underscores the role of "technological innovation to lead the development of new productive forces and build a modern industrial system."
High-Level Opening Up and Trade Stabilisation: The Politburo calls for expanding "high-level opening up and stabilising foreign trade and investment."
Poverty Alleviation and Urban-Rural Integration: The Politburo mentions the need to "continuously consolidate and expand the achievements in poverty alleviation, coordinate the promotion of new conurbation and comprehensive rural vitalisation, and promote integrated urban-rural development."
High-Quality Development: The Politburo highlights the importance of "solidly promoting high-quality development, further deepening reform comprehensively, expanding high-level opening up, building a modern industrial system, better coordinating development and security, implementing more active macro policies, expanding domestic demand, promoting the integration of technological and industrial innovation”.
Market Stability: The Politburo notes the need to “stabilise the real estate and stock markets”.
Market response to latest China stimulus news
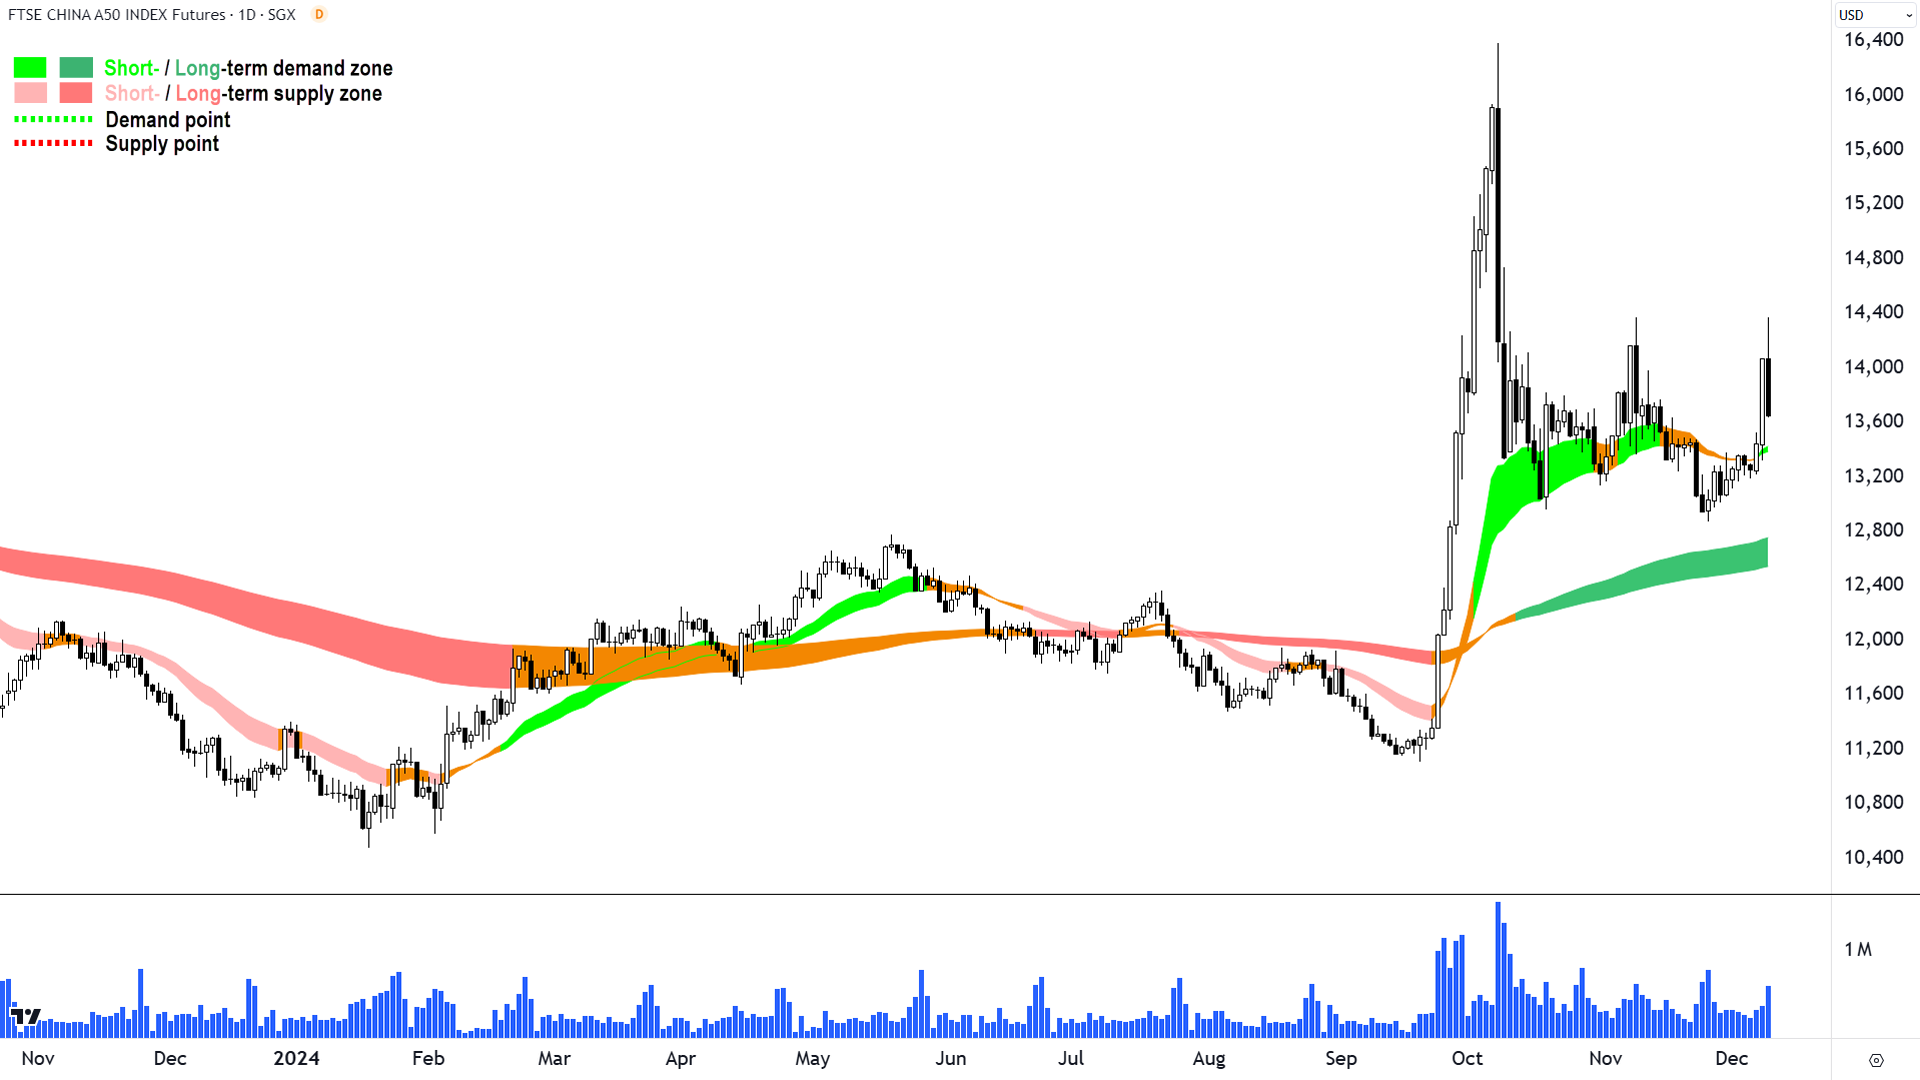
Chinese stocks initially rallied on the news, with the benchmark FTSE China A50 Index rising 4.7% in late Monday trade. This was the index’s biggest gain in over 2 months, that is, since a massive rally sparked by the 24 September announcement of a range of monetary policy adjustments by the People’s Bank of China (“PBOC”).
That rally was driven in subsequent sessions by other more modest fiscal stimulus measures, plus the promise of more to come. However, Chinese stocks are trading lower today, with the A50 Index down 2.7% at the time of writing.

FTSE China A50 Index (click here for full size image)
Closer to home, the S&P/ASX 200 is also trading lower, down around 0.3% after a modestly higher open. Buy, dig a little deeper, and it’s clear that ASX-listed Resources and Energy stocks are taking a positive cue from yesterday’s announcement. The S&P/ASX 200 Resources (XJR) sector index is 3.3% higher and the S&P/ASX 200 Energy (XEJ) sector index is 1.4% higher at the time of writing.
Within the XJR, major copper, iron ore, lithium and nickel stocks are leading the charge, with many stocks like logging their best one-day gains since the initial September stimulus announcement.
Company | Last Price | Change $ | Change % | 1mo % | 1yr % |
|---|---|---|---|---|---|
Firefly Metals (FFM) | $1.140 | +$0.13 | +12.9% | -5.4% | +111.1% |
Develop Global (DVP) | $2.47 | +$0.26 | +11.8% | +11.8% | -14.8% |
Vulcan Energy Resources (VUL) | $6.69 | +$0.54 | +8.8% | +28.9% | +209.7% |
Mineral Resources (MIN) | $37.16 | +$2.97 | +8.7% | +0.6% | -38.8% |
Pilbara Minerals (PLS) | $2.29 | +$0.135 | +6.3% | -22.8% | -36.2% |
Fortescue (FMG) | $20.37 | +$1.115 | +5.8% | +12.4% | -20.1% |
WA1 Resources (WA1) | $14.59 | +$0.73 | +5.3% | +12.3% | +77.3% |
Sandfire Resources (SFR) | $10.63 | +$0.51 | +5.0% | +3.3% | +65.3% |
Champion Iron (CIA) | $6.30 | +$0.3 | +5.0% | +11.7% | -17.9% |
Catalyst Metals (CYL) | $2.79 | +$0.13 | +4.9% | -9.7% | +179.0% |
Iluka Resources (ILU) | $5.04 | +$0.2 | +4.1% | -6.1% | -27.2% |
Rio Tinto (RIO) | $124.38 | +$4.89 | +4.1% | +4.1% | -2.6% |
Regis Resources (RRL) | $2.81 | +$0.11 | +4.1% | +9.8% | +47.1% |
Nickel Industries (NIC) | $0.910 | +$0.035 | +4.0% | +1.1% | +28.2% |
Deterra Royalties (DRR) | $4.00 | +$0.15 | +3.9% | +12.4% | -20.0% |
Evolution Mining (EVN) | $5.24 | +$0.195 | +3.9% | +7.5% | +43.4% |
Emerald Resources (EMR) | $3.80 | +$0.135 | +3.7% | -3.7% | +40.0% |
Gold Road Resources (GOR) | $2.17 | +$0.07 | +3.3% | +18.9% | +12.1% |
BHP Group (BHP) | $41.86 | +$1.27 | +3.1% | +0.6% | -11.7% |
Westgold Resources (WGX) | $3.00 | +$0.085 | +2.9% | +4.0% | +40.0% |
IGO (IGO) | $5.09 | +$0.13 | +2.6% | -2.1% | -36.6% |
Best performing ASX Resources companies Tuesday
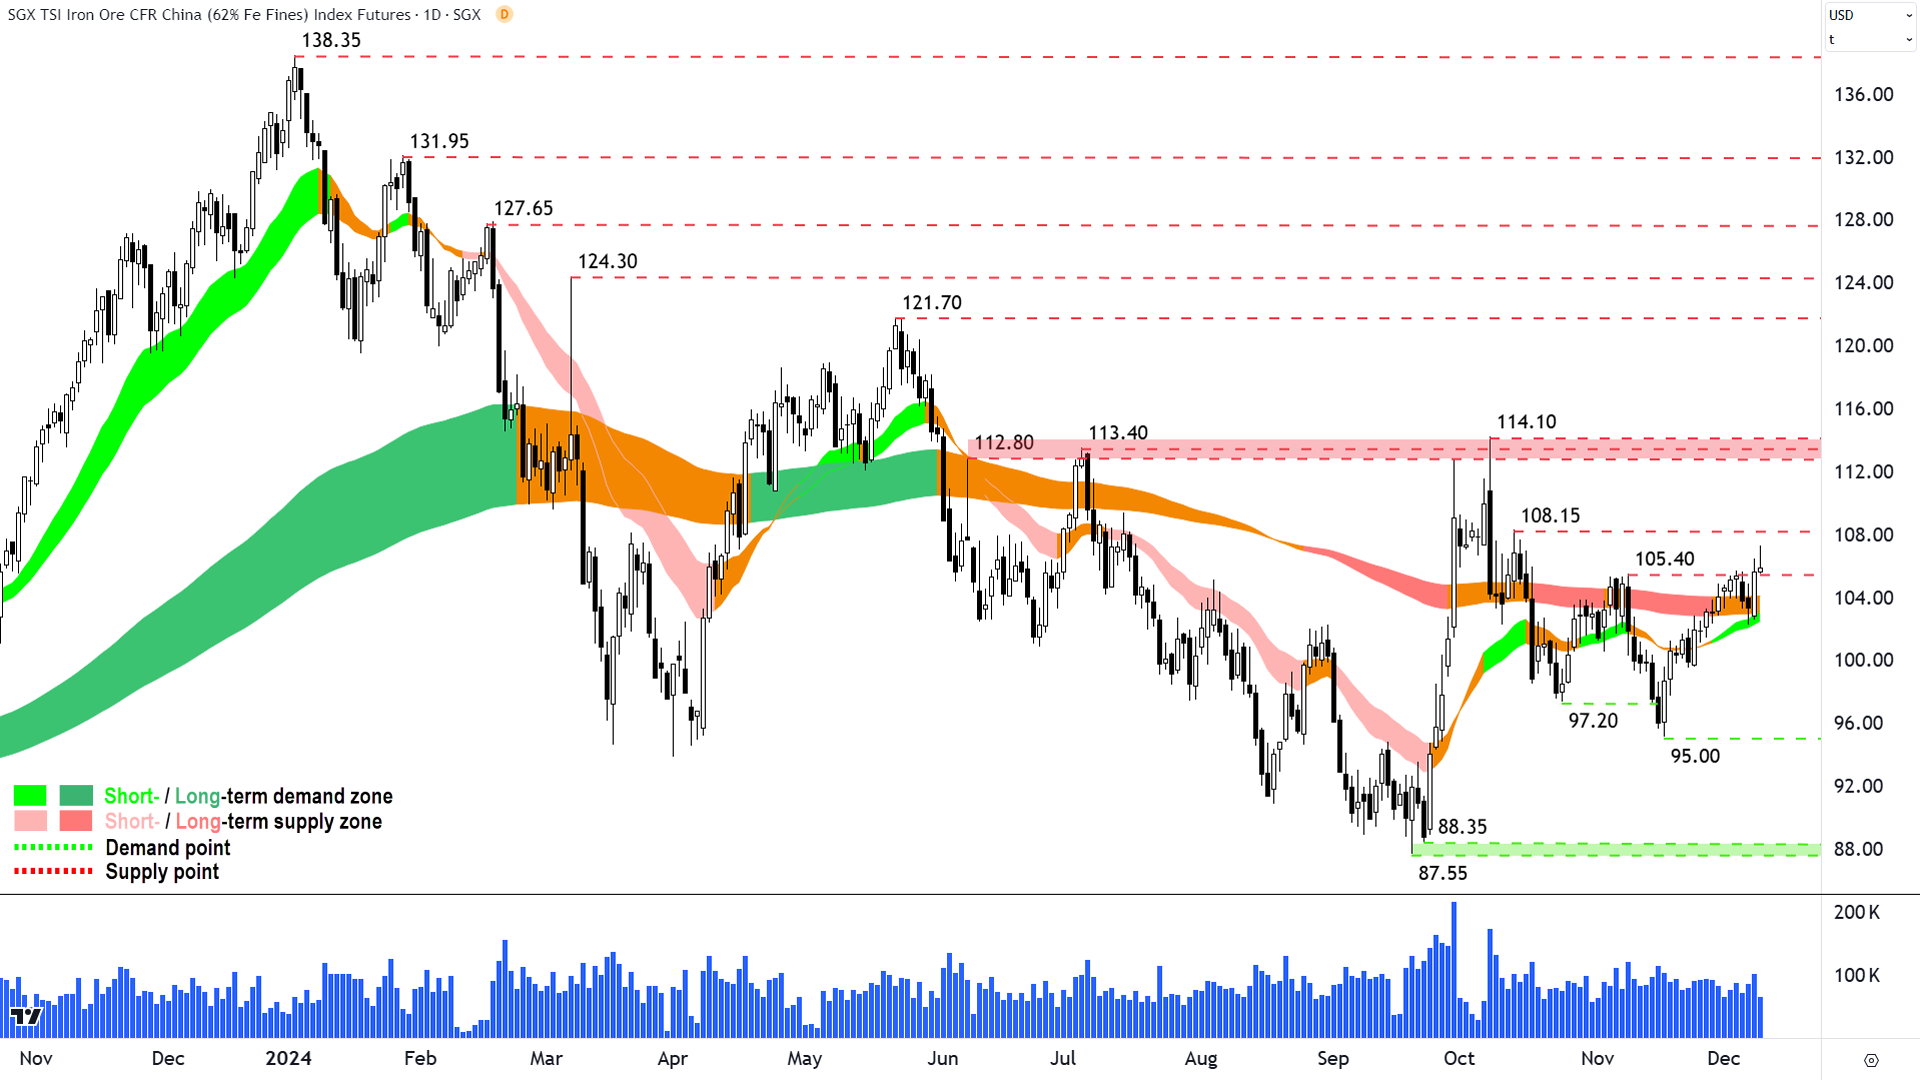
Iron ore price ticks higher
One market indicator that is no doubt going to spark interest among Aussie investors is the uptick in the iron ore price. Iron ore is currently trading at US$106.10/t, up strongly from around US$102.55/t at Monday’s open. This is the highest level iron ore has traded at in 8 weeks.
%20SGX%20chart%2010%20December%202024.png)
Iron ore price chart (click here for full size image)
From a technical standpoint, the short term trend is now up for iron ore over a one-month period, and the longer term trend is back to neutral from the recent downtrend. The next key level of chart resistance is the US$108.15/t point, and above that the October, post-initial China stimulus highs of US$114.10/t.
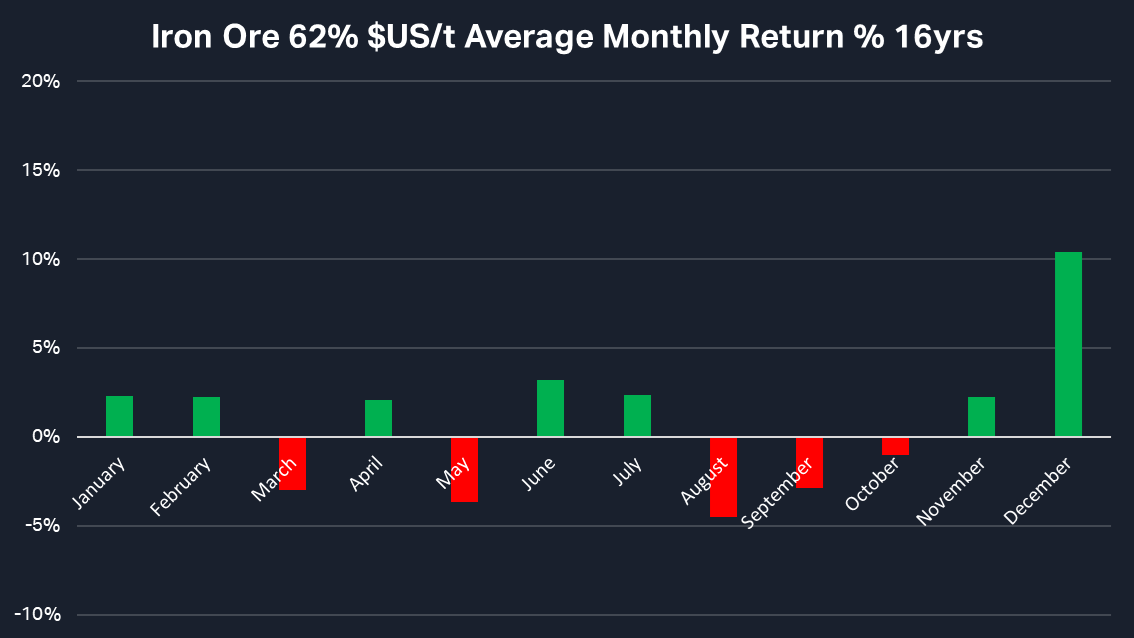
It’s worth noting that December is typically a very strong period of the year for the iron ore price as Chinese steel producers stock up ahead of the Luna New Year holiday in late-January-early-February, and ahead of the peak construction season that typically follows in March-May.

Iron ore price season chart (click here for full size image)
ASX iron ore stocks technical analysis
Turning our attention to ASX-listed iron ore miners, their charts appear to also have arrested a steady decline since early October, but are generally far from turning their long term downtrends.
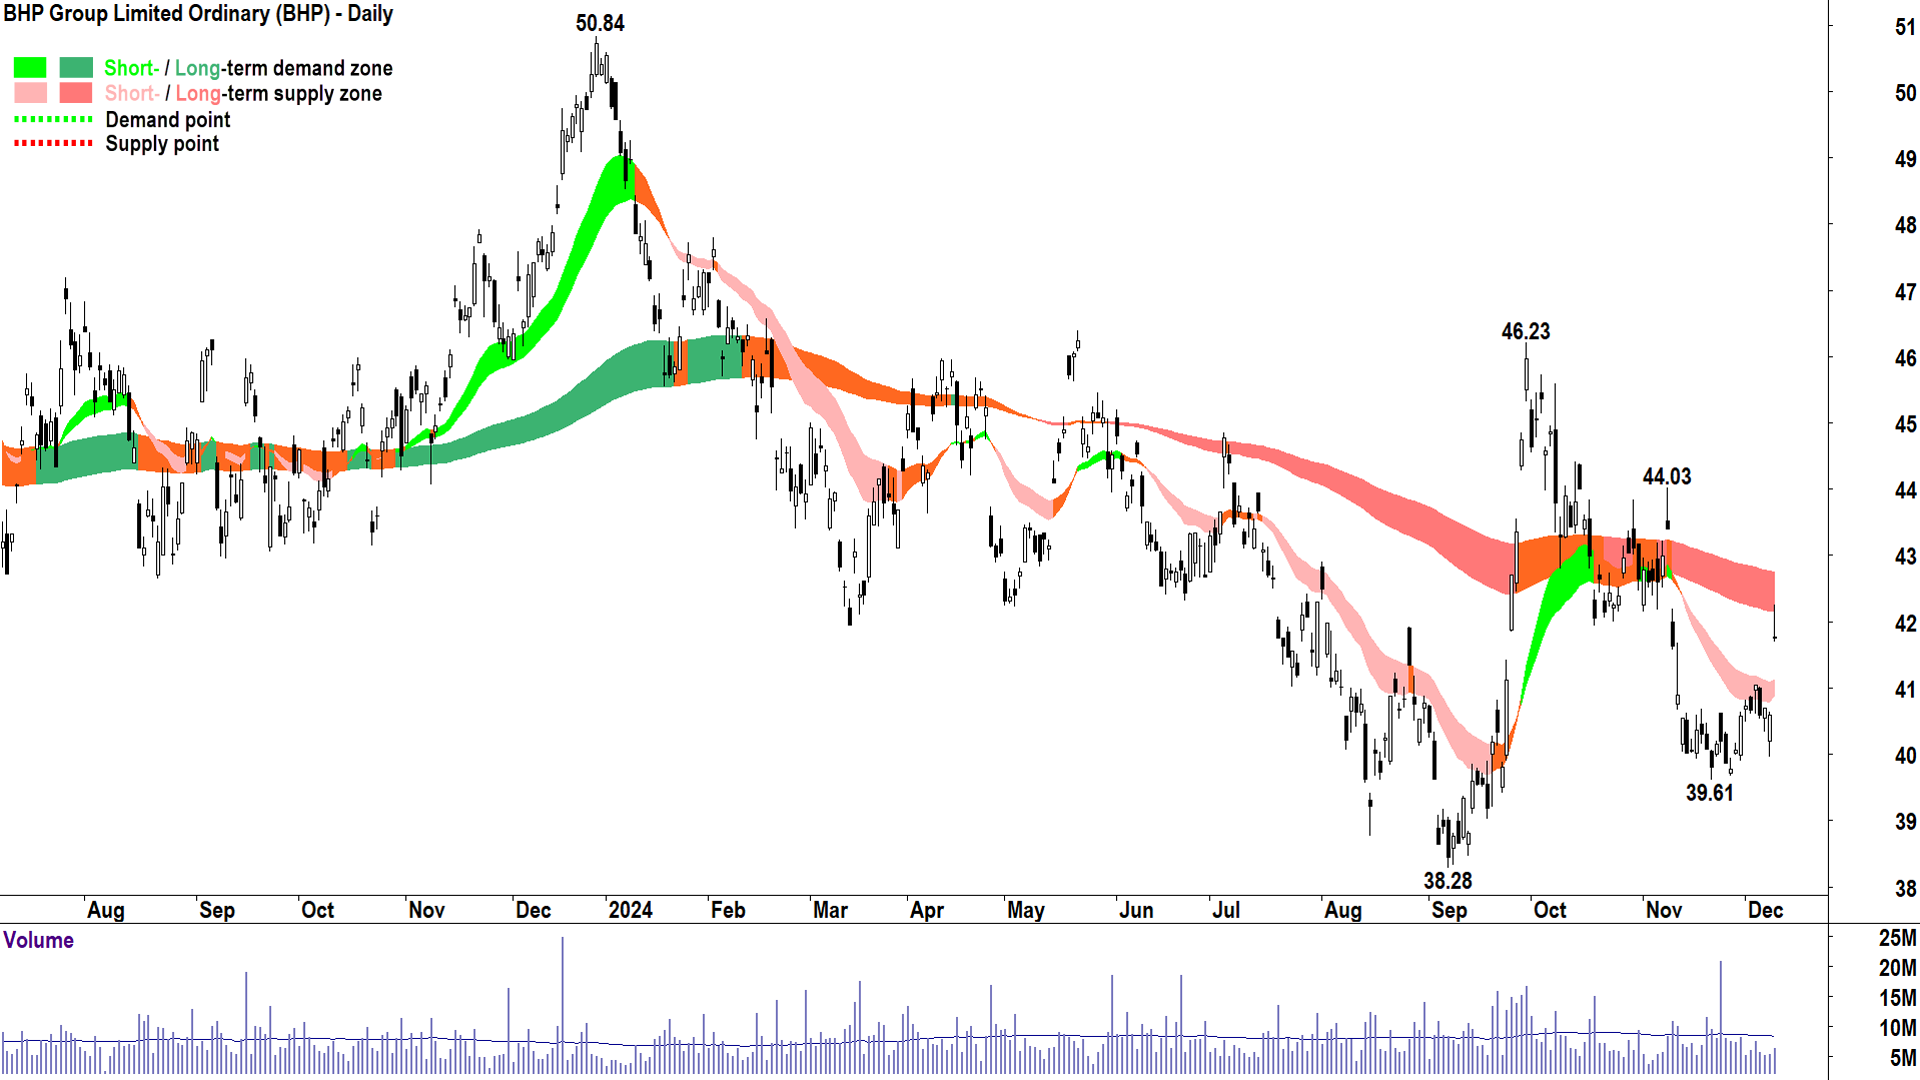
BHP Group (ASX: BHP)
The chart of BHP, below, shows a spike back up to the long term downtrend ribbon on below average volume so far. Today’s candle, with its upward pointing shadow, also indicates a “sell into the rally” mentality among investors.
%20chart%2010%20December%202024.png)
BHP Group (BHP) price chart (click here for full size image)
The key levels to watch from a technical standpoint for BHP now are:
Long term trend ribbon – A close above this level is bullish, particularly if the trend ribbon neutralises (turns orange), or subsequently begins to rise and turn green
44.03 – A key point of supply, a close above this level likely commences a new long term uptrend
46.23 – A key point of supply, a close above this level likely confirms the new long term uptrend, plus clears the path back to the 50.84 December 2023 all time high.
39.61 – A key point of demand, a close below this level is bearish as it likely reconfirms the short and long term downtrend, plus clears the path back to the 38.28 September low.
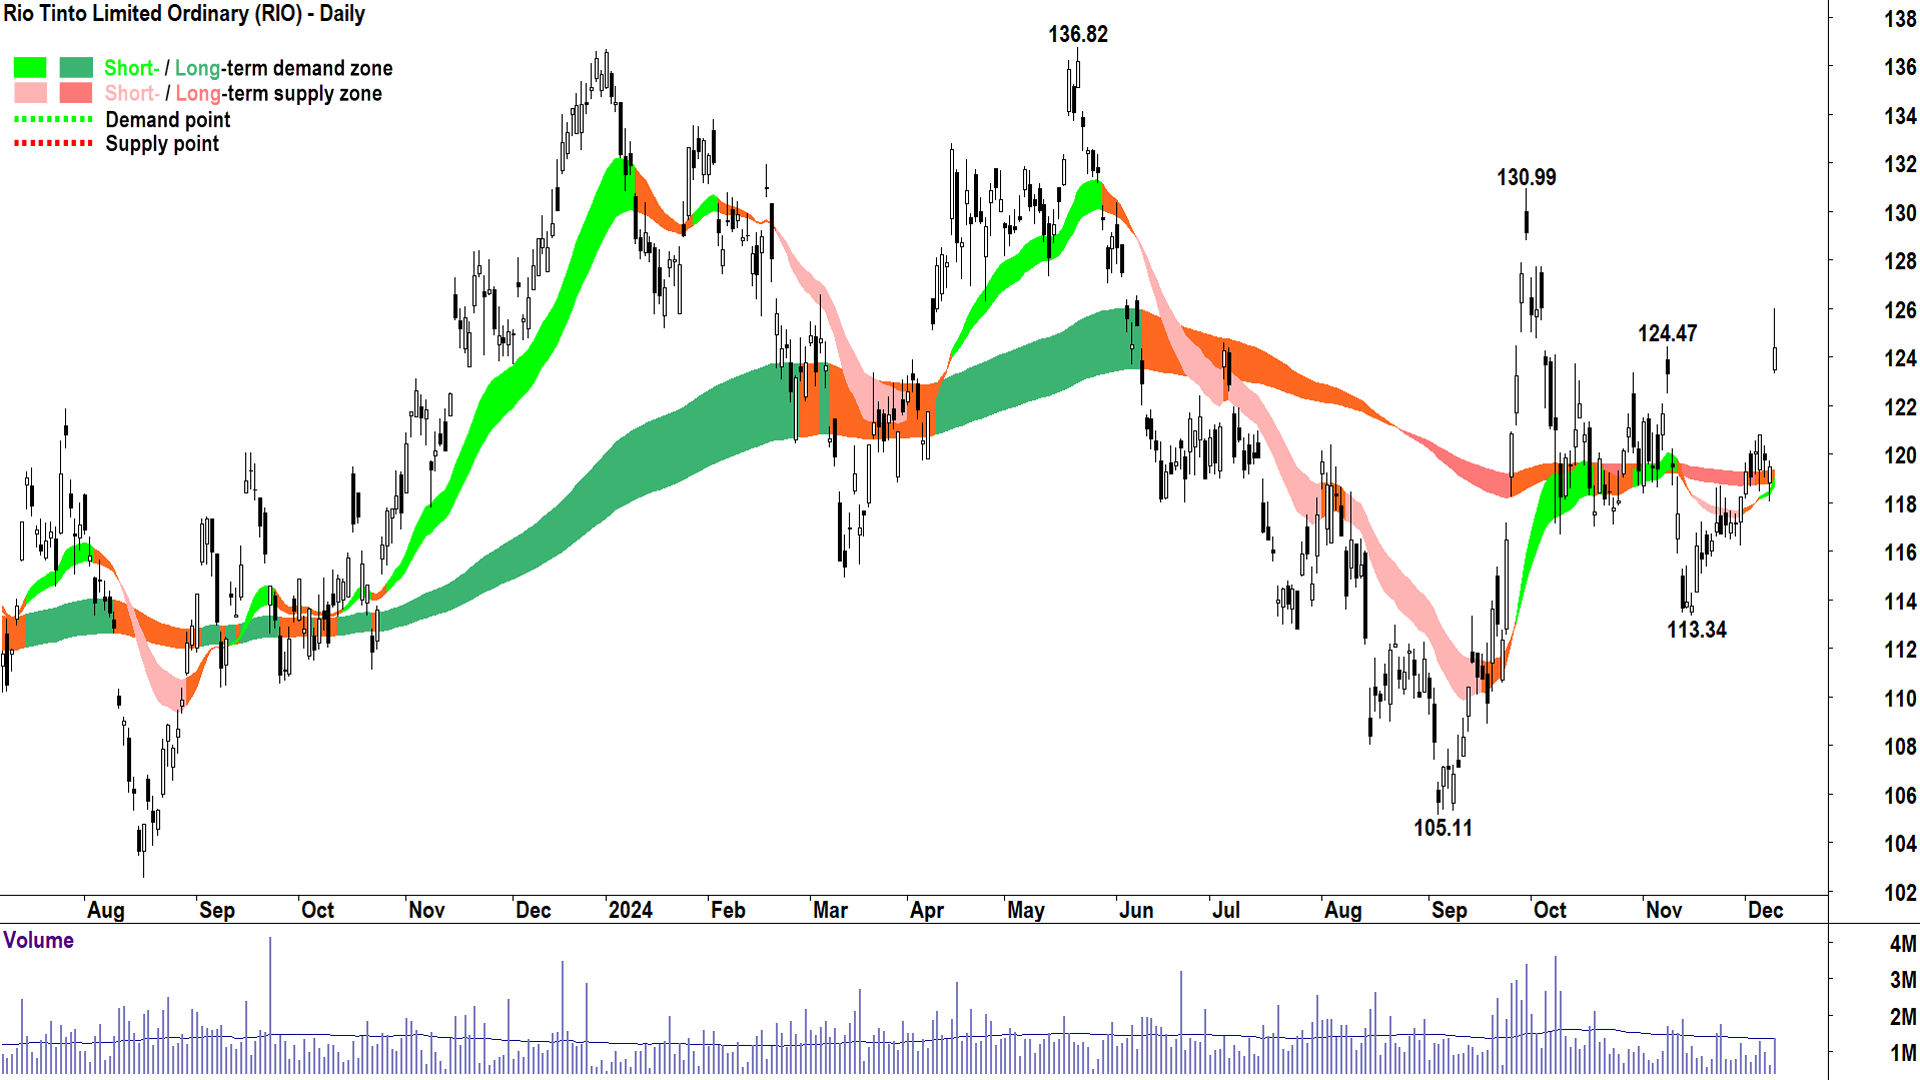
Rio Tinto (ASX: RIO)
%20price%20chart%2010%20December%202024.png)
Rio Tinto (RIO) price chart (click here for full size image)
The chart of RIO shows it is in substantially better shape technically than BHP. This is because the RIO price has spiked well above its long term trend ribbon, which itself is showing neutral rather than BHP’s down. Also note that RIO’s short term trend is up, unlike BHP’s, which remains down.
Today’s candle with its long upward pointing shadow does still show the tell-tale sign of sell the rally activity among investors, though, but at least it’s not as bearish as BHP’s version.
The key levels to watch from a technical standpoint for RIO now are:
124.47 – A key point of supply, a close above this level today commences a new long term uptrend
130.99 – A key point of supply, a close above this level confirms the new long term uptrend, plus clears the path back to the 13.82 May all time high.
Long term trend ribbon – A close below this level is bearish, particularly if the trend ribbon transitions back to dark pink
113.34 – A key point of demand, a close below this level is bearish as it likely reconfirms the recommencement of the short and long term downtrends, plus clears the path back to the 105.11 September low.
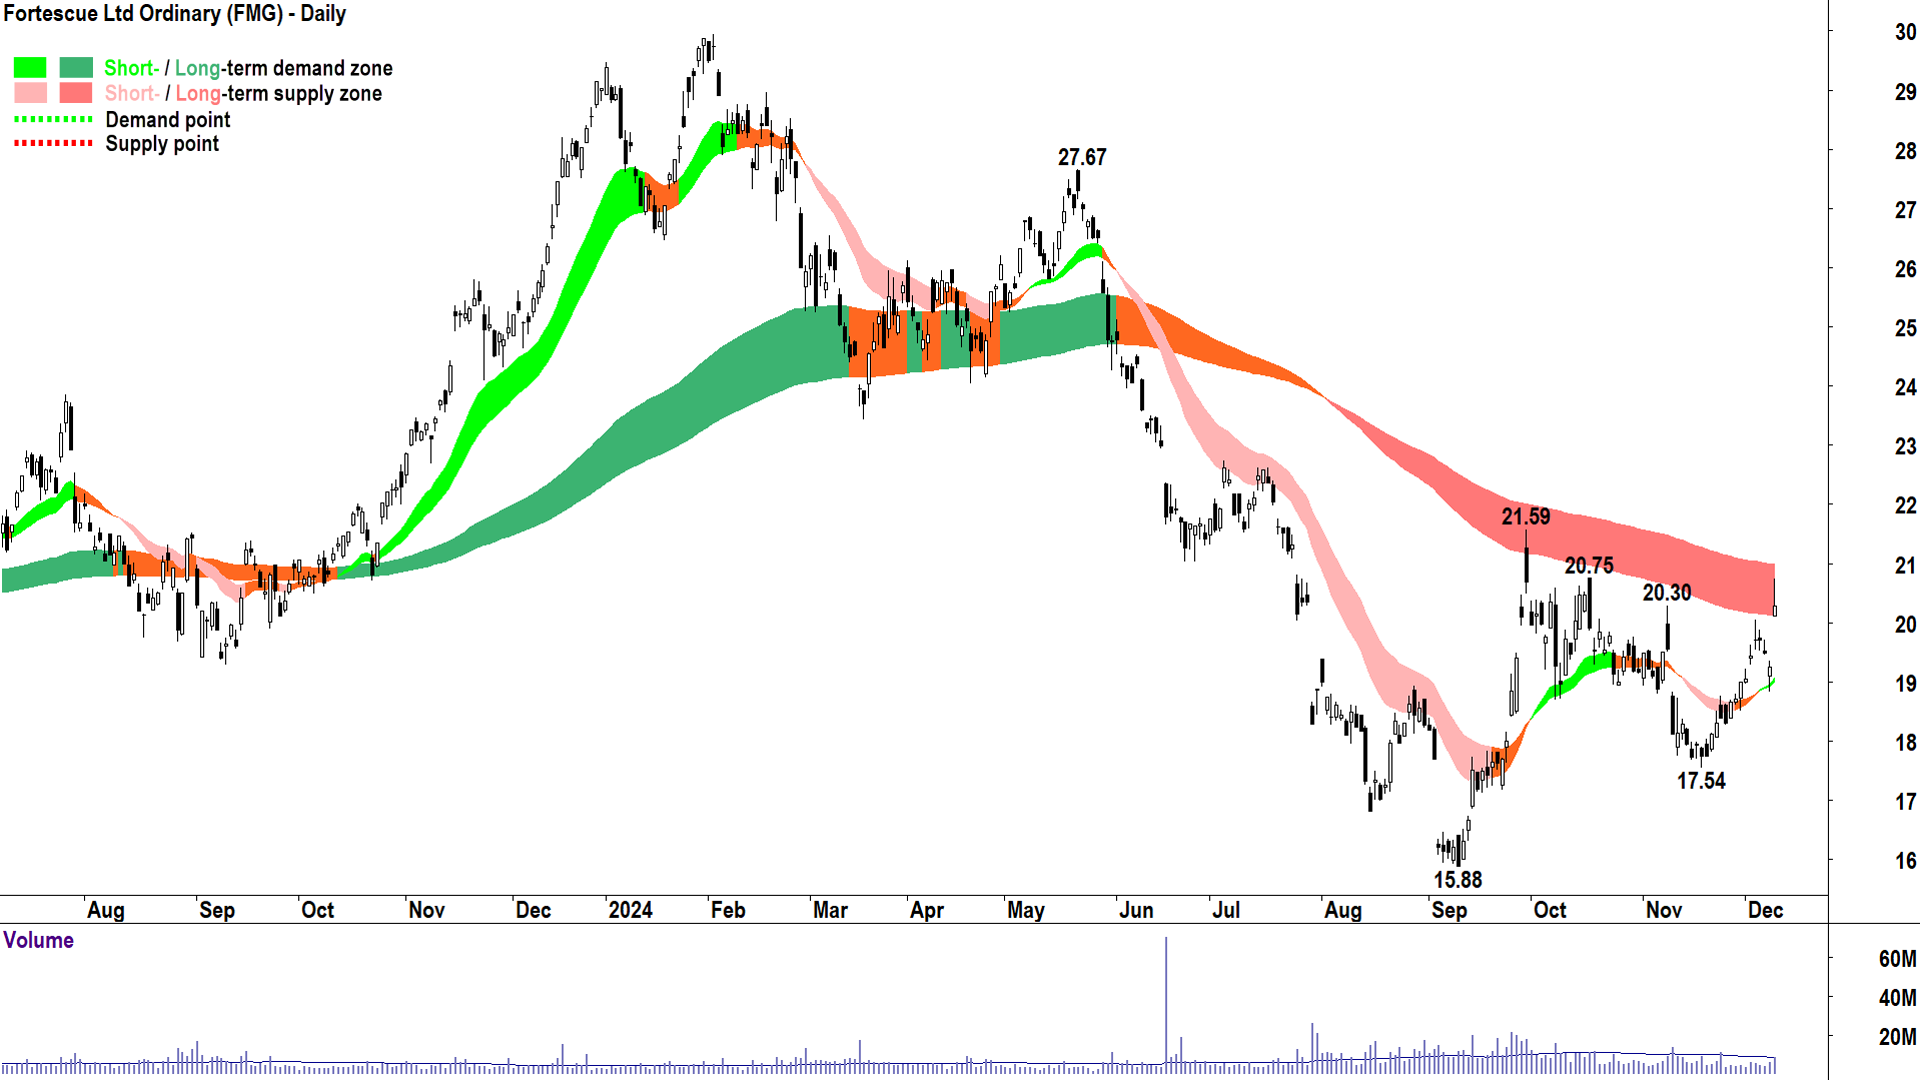
Fortescue (ASX: FMG)
%20chart%2010%20December%202024.png)
Fortescue (FMG) price chart (click here for full size image)
The chart of FMG is somewhere between RIO and BHP’s charts. Like RIO, it shows FMG is presently in a short term uptrend, and this is complimented by healthy price action (i.e., rising peaks and rising troughs). However, the FMG price has only spiked into FMG’s long term trend ribbon rather than above it, and like BHP’s long term trend ribbon, it is trending down.
Today’s candle also exhibits a long upward pointing shadow, indicating a high degree of sell the rally activity so far today.
The key levels to watch from a technical standpoint for FMG now are:
Long term trend ribbon – A close above this level is bullish, particularly if the trend ribbon neutralises (turns orange), or subsequently begins to rise and turn green
20.30 & 20.75 – Key points of supply, a close above both of these levels is required to begin to shift the large amount of latent supply in the system.
21.59 – A key point of supply, a close above this level likely confirms the new long term uptrend, plus clears the path back to the 27.67 May high.
17.54 – A key point of demand, a close below this level is bearish as it likely reconfirms the short and long term downtrend, plus clears the path back to the 15.88 September low.
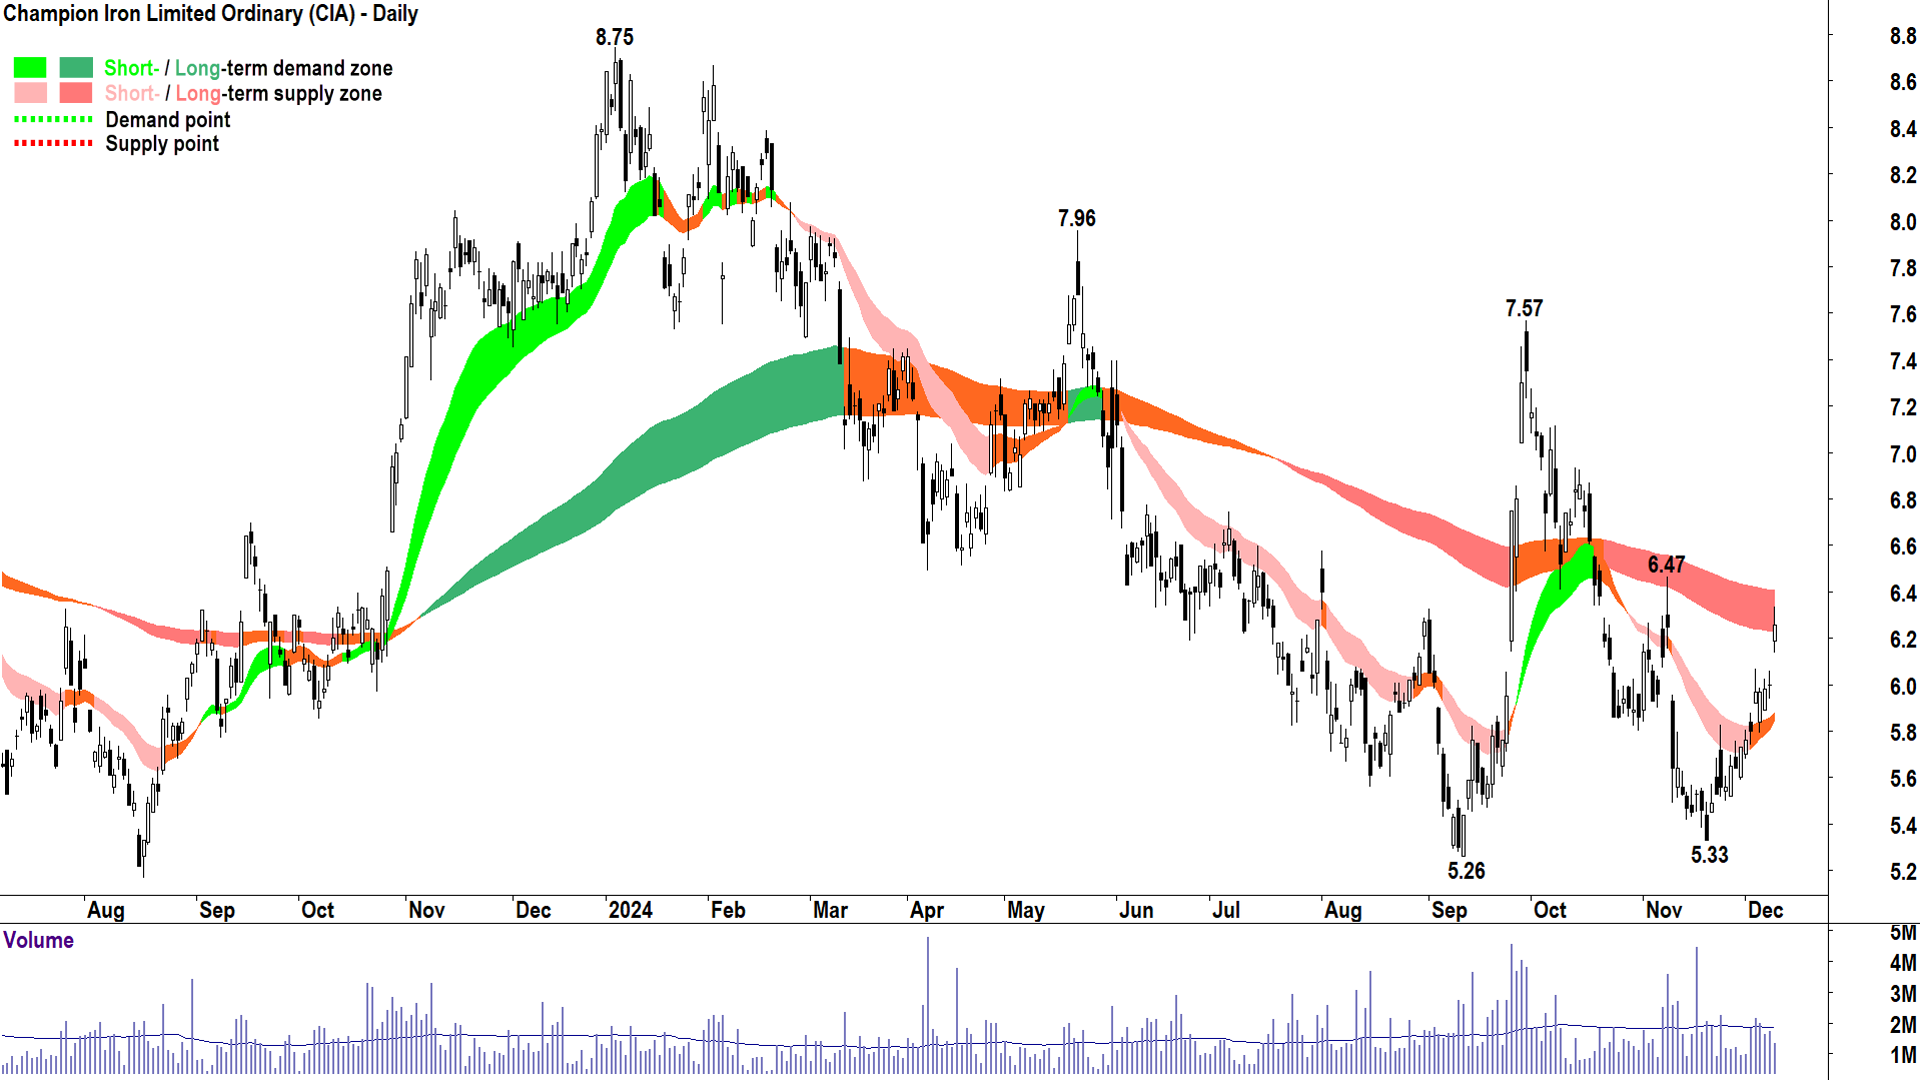
Champion Iron (ASX: CIA)
%20chart%2010%20December%202024.png)
Champion Iron (CIA) price chart (click here for full size image)
The chart of CIA again shows just how differently the ASX iron ore cohort is responding to recent market developments. It is showing a strong rally since the November low, that is, in line with the most recent rally in the iron ore price from US$95/t.
So far, that rally has transitioned its short term trend to neutral, but I note positive signs with respect to strong price action as well as a healthy predominance of demand-side candles (i.e., those with white bodies and or downward pointing shadows).
The long term trend remains the elephant in the room for CIA shares, though. It continues to impede upward price momentum, and must be cleared to facilitate a transition to a neutral-and-then-long term uptrend.
Today’s candle on CIA is less indicative of the sell the rally activity that’s prevalent among the candles of its peers.
The key levels to watch from a technical standpoint for CIA now are:
Long term trend ribbon – A close above this level is bullish, particularly if the trend ribbon neutralises (turns orange), or subsequently begins to rise and turn green
6.47 – A key point of supply, a close above this level likely neutralises the long term trend
7.57 & 7.96 – Key points of supply, a close above both of these levels is required to begin to shift the large amount of latent supply in the system. Both levels must be overcome to clear a path to the 8.75 December 2023 all time high.
5.33 – A key point of demand, a close below this level is bearish as it likely reconfirms the short and long term downtrend, plus clears the path back to the 5.26 September low.
Conclusions
Iron ore stocks have experienced moderate to large share price declines since the initial euphoria over September’s initial stimulus announcements wore off. Monday’s announcement by China’s Politburo that the Chinese government remains committed to further economic stimulus is so far proving a positive for ASX Resources stocks, particularly iron ore stocks.
However, these stocks were generally rallying in advance of the announcement, likely on the recent improvement in the iron ore price at what is typically a seasonally strong time of the year for it.
The technicals for ASX-listed iron ore stocks have improved markedly over the last few weeks, but most are insufficient to yet call with any confidence that long term downtrends have been reversed. Short term trends are showing signs of improvement however, and today’s price spike across the sector is challenging several key levels of chart resistance.
More work needs to be done to confirm the transition back to a long term downtrend for each stock, and the key levels investors should look out for have been identified.
