
CSL smashed, BHP rewarded after earnings. Here’s why, and where each may be headed next
CSL is getting smashed after its earning results, yet BHP is prospering. Why do investors love one and hate the other, and where to next?!


Source: Shutterstock, Market Index
Mentioned
KEY POINTS
- Two of Australia’s corporate heavyweights, CSL (ASX: CSL) and BHP Group (ASX: BHP), released their earnings results today – but the market reaction could not be more different (CSL is getting smashed, and BHP is steadily rising).
- What did investors love or hate about each company's results? Where might their share prices be headed next?
- We have all of the key data from each company’s earnings report, as well as detailed technical analysis of their charts.
Two of Australia’s corporate heavyweights, CSL (ASX: CSL) and BHP Group (ASX: BHP), released their earnings results today – but the market reaction could not be more different. Shares in global biotech leader CSL have tumbled almost 10% as investors digested a messy set of numbers clouded by restructuring costs and softer guidance. By contrast, mining giant BHP is trading higher, with the market rewarding a steady financial performance, a dividend beat, and reassurance that inflationary pressures are easing across its cost base.
CSL, best known for its blood plasma therapies and vaccines, is undertaking a sweeping transformation as it looks to streamline operations and spin off its Seqirus vaccine division. Meanwhile, BHP, the world’s largest diversified miner, continues to generate strong cashflows from iron ore and copper, while maintaining its appeal as a dependable dividend payer.
This article will break down the key takeaways from each company’s results, examine how the market has responded, and check their respective charts to determine potential next steps.
CSL (ASX: CSL)
$244.38 -$26.94 -10.0% (11am AEST)
Key Financial Data
(Australian dollars unless otherwise stated)
Revenue: $15.56b (Consensus: $15.73b)
EBIT (Underlying): $4.47b (Consensus: $4.52b)
NPAT (Underlying / NPATA): $3.30b (Consensus: $3.31b)
EPS (Underlying): $6.65 (Consensus: $6.53)
DPS (Final): $1.62 (Consensus: $1.56)
Guidance
(Australian dollars unless otherwise stated)
FY26 constant currency (cc) revenue growth: 4–5%, implying $16.2–$16.3b (Consensus: $16.7b)
FY26 cc NPATA: $3.45–$3.55b (Consensus: $3.6b)
One-off restructuring costs: $700–770m pre-tax in FY26
Transformation program to reduce headcount by 15%, annualised savings of $500–550m over 3 years
Plan to demerge CSL Seqirus into a standalone ASX-listed vaccine business
$750m share buy-back to commence in FY26
Key Takeaways
CSL delivered a mixed result, with revenue and EBIT slightly below consensus but NPATA at the upper end of guidance. While transformational initiatives and a Seqirus demerger could unlock long-term value, lower-than-expected FY26 guidance and messy restructuring costs cloud the near-term picture. The outlook suggests a cautious hold, as investors may need patience for the benefits of the strategic changes to flow through.
Technical Analysis
%20daily%20chart%2019%20August%202025.png)
CSL (ASX-CSL) daily chart 19 August 2025 (click here for full size image)
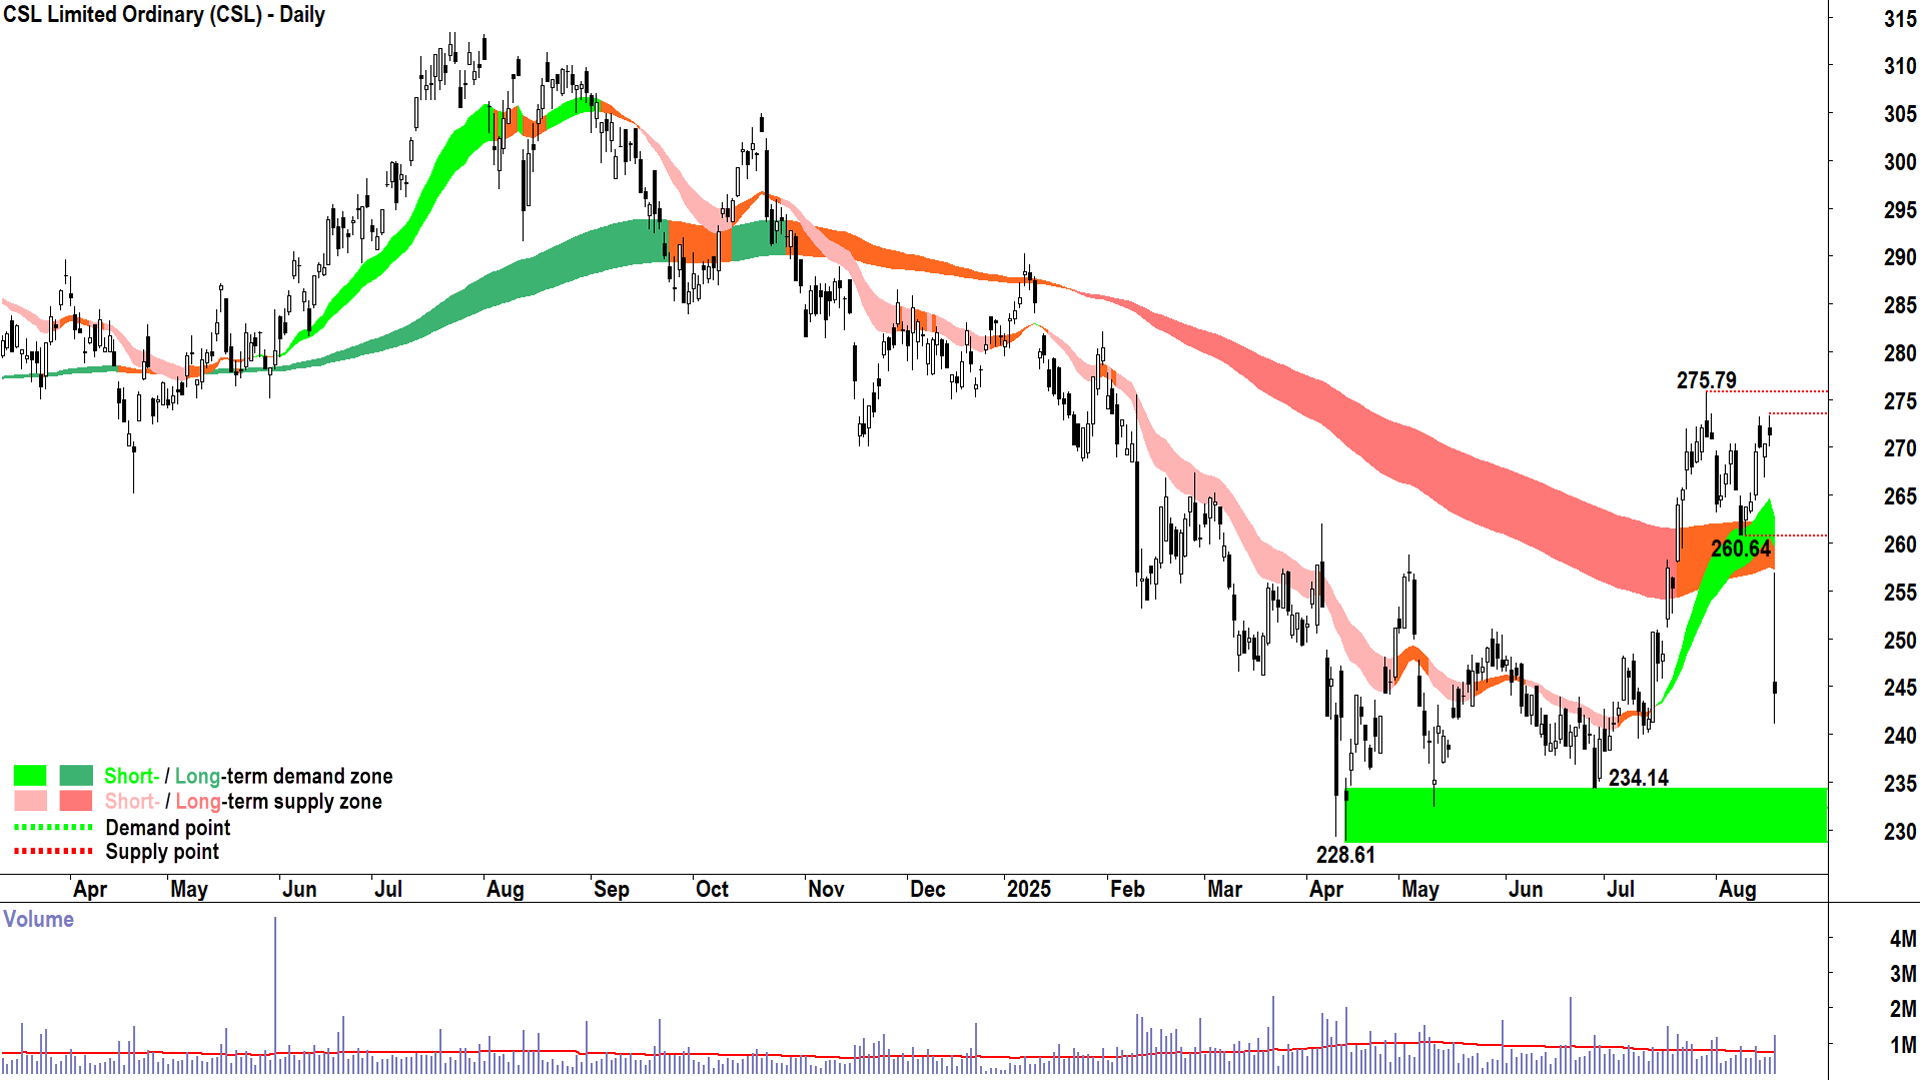
It’s also a disappointing result for this trend following technical analysis! I admit that like many of my fundamental analyst cousins, I took the bait on this one. After a very successful 12 months of calling CSL down (ChartWatch ASX Scans Feature Downtrend 27 times between 27 Sep 2024 and 25 Jun 2025), the sharp rally in July dragged CSL’s price back above my all-important long-term trend ribbon.
The recent test and rally from the ribbon, along with a strong demand-side candle showing on 13 August, was enough to earn CSL a spot in my Uptrends Scan List the next day. Today’s candle is still live, so I cannot make a firm call on it yet – but should it close around the present price or worse, it would nullify 13 Sep’s buy signal. This is because the price will again have closed below the short and long term trend ribbons and today’s long upward pointing candle shadow is evidence of substantial latent excess supply in the system (it shows how sellers were waiting to aggressively sell into this morning’s post-open rally).
The best uptrends are driven by buy the dip, not sell the rally.
Assuming the candle stays roughly the same by the close, my model will switch back to neutral on CSL. I expect both trend ribbons will be neutralised by the end of the candle (both matching amber colour), and several important points of demand – most importantly the trough that formed within the confluence of the short and long term trend ribbons (11 Aug at 260.64) – have been consumed. The excess demand that created them no longer exists.
What likely now sits in its place, is latent excess supply from those who now feel trapped on the long side – hoping for any rally to extricate themselves from their mistake of owning CSL. I expect the short and long-term trend ribbons, along with 260.64, will now act as zones of dynamic and static excess supply respectively (i.e., resistance).
Potentially balancing out this supply, and the main reason for my neutral stance, is the proximity of three historical points of demand between 228.61-234.14 (i.e., support). CSL will need to print some very strong demand-side candles in/above that zone if it’s to stave off a broader sell off and likely resumption of 2024’s long-term downtrend. This means candles with long white bodies and or long downward pointing shadows.
The opposite in that demand zone – i.e., candles with long black bodies and or long upward pointing shadows – will confirm the supply-side is back in control of the CSL price and substantially heighten the risk of a test and break of 228.61-234.14.
BHP Group (ASX: BHP)
Last price: $41.89 +0.42 (+1.0%) (11am AEST)
Key Financial Data
(US dollars unless otherwise stated)
Revenue: $51.3b (Consensus: $51.3b)
EBITDA (Underlying): $26.0b (Consensus: $25.9b)
NPAT (Underlying): $10.2b (Consensus: $10.2b)
EPS: $2.00 (Consensus $2.02)
DPS (Total FY25): $1.10 (Consensus: $1.01) → payout ratio 55%
Guidance
(US dollars unless otherwise stated)
FY26 production and capex unchanged; medium-term capex reduced by $1b to ~$10b p.a.
FY26 unit cost guidance shows inflation pressures have “largely normalised”:
Escondida: $1.20–1.50/lb (Consensus: $1.32/lb)
Spence: $2.10–2.40/lb (Consensus: $2.20/lb)
Copper SA: $1.00–1.50/lb (Consensus: $1.72/lb)
WAIO: $18.25–19.75/t (Consensus: $19.00/t)
BMA: $116–128/t (Consensus: $133/t)
Growth projects progressing (WAIO expansion, Prom Hill, Carra block cave, Olympic Dam SMA), but two-stage smelter delayed until after 2027
Net debt target range raised to $10–20b (from $5–15b) → implies dividends will continue above the 50% minimum payout ratio
Key Takeaways
BHP delivered another consistent set of results, with most financial metrics in line and a dividend beat reinforcing its appeal as an income stock. Cost pressures have largely normalised, medium-term capex was trimmed, and copper remains the clear growth driver. With dividends set to remain attractive and growth projects advancing despite some delays, the stock looks well-supported for a hold to accumulate position for investors seeking steady returns with exposure to long-term copper upside.
Technical Analysis
%20daily%20chart%2019%20August%202025.png)
BHP Group (ASX-BHP) daily chart 19 August 2025 (click here for full size image)
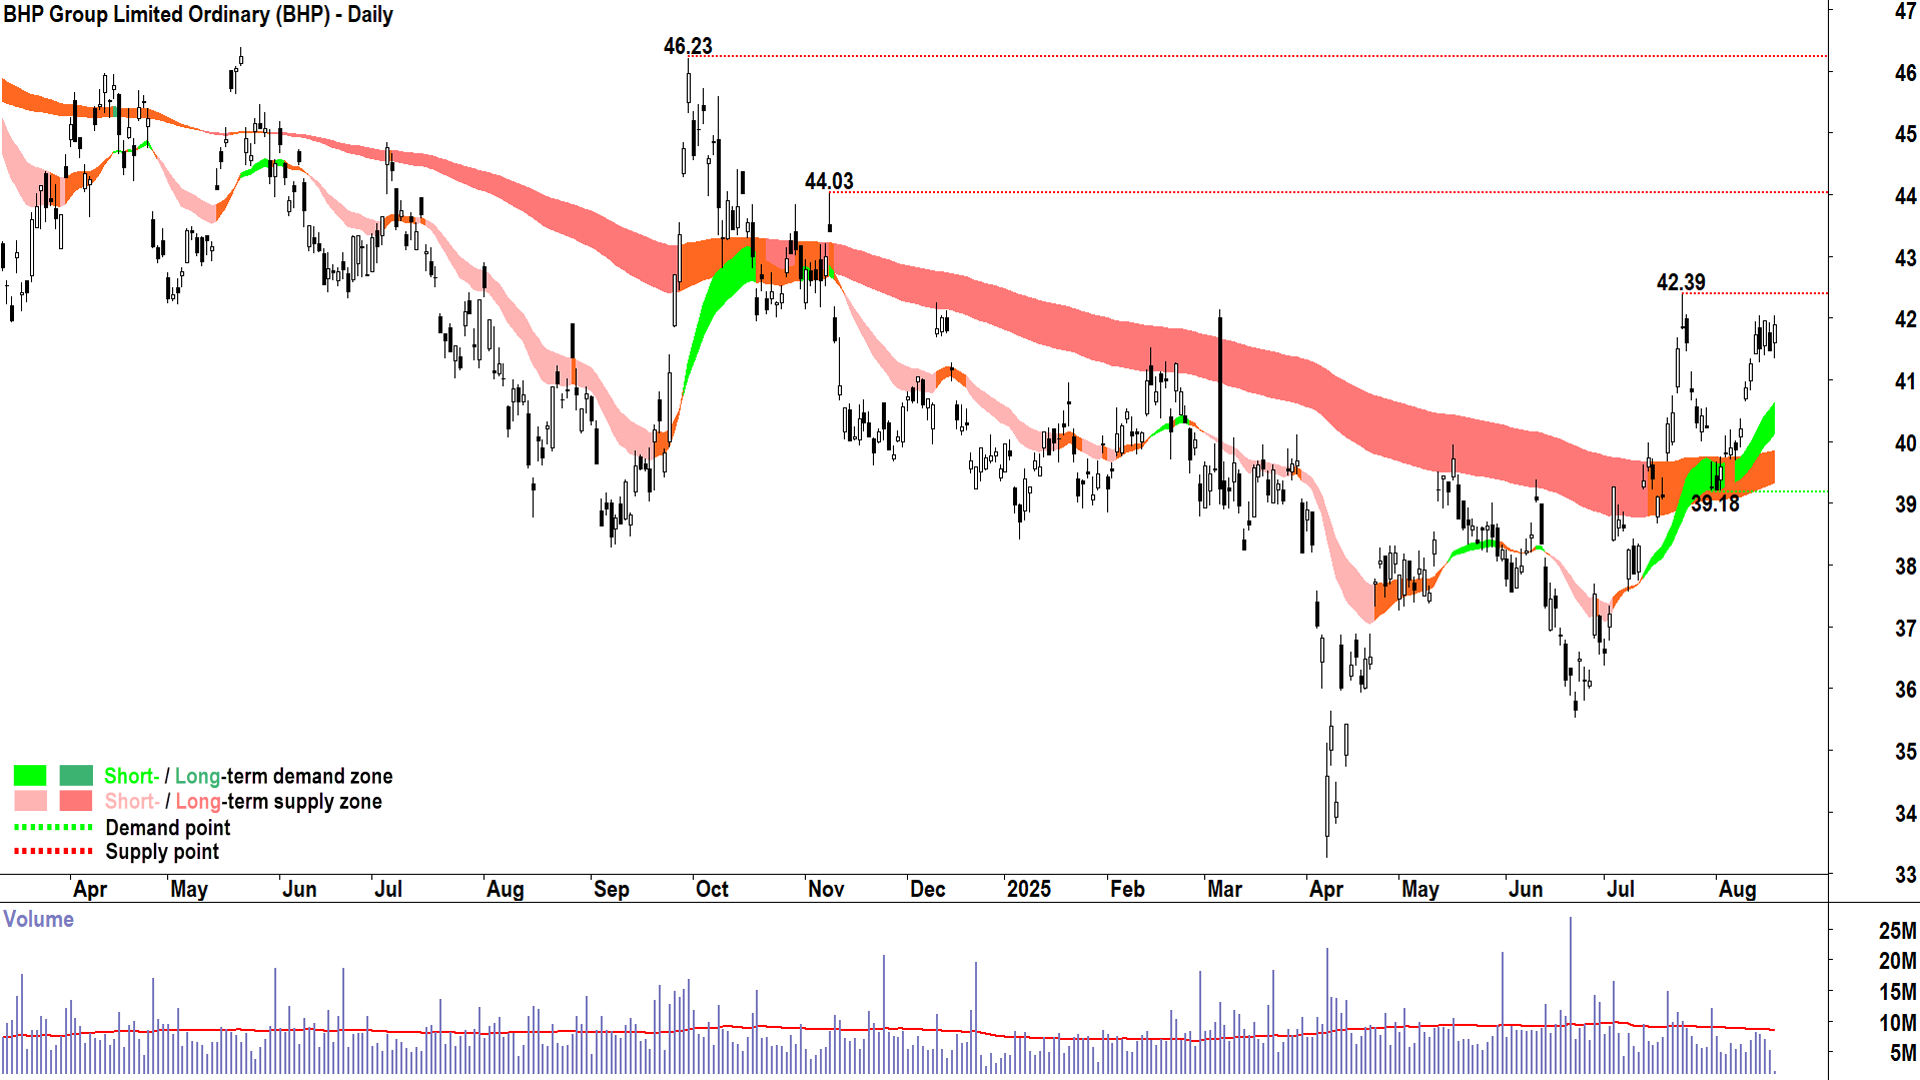
Completely different companies, but from a technical perspective, very similar charts. Until that last candle, that is! Surprise the market in a good way – you’re rewarded, but in a bad way – and you’re punished!)
BHP has undergone a similar transition from long-term downtrend to fledgling long-term uptrend as CSL. It shows the same establishment of a short-term uptrend (light green trend ribbon), neutralisation of the long-term trend (amber trend ribbon), and return to both demand-side price action (i.e., higher peaks and higher troughs) and a predominance of demand-side candles (i.e., white-bodied and or with downward pointing shadows).
Most importantly, the trend ribbons have transitioned from acting as respective zones of short and long-term excess supply, to acting as respective zones of short and long-term excess demand. The July pullback and test of the confluence of the trend ribbons is the critical event that allows me to call a new long-term uptrend in BHP has begun, and therefore that I may look for opportunities to add risk.
In this regard, I note that BHP made my ChartWatch ASX Scans Uptrends Scan List on 12, 13, and 18 August. Whilst acknowledging my model allows me to consider adding risk here, any risk I choose to add depends in practice on the quality of all setups identified on a particular day. Was BHP the best setup on any of those three days? 🤔 No, I don’t think it was. Nonetheless, I trust the analysis here will be useful for those who already own BHP!
And on that point, BHP’s technical picture / indications of a return to demand-side control have substantially improved over the last two months. As long as the price continues to close above the short-term uptrend ribbon (presently 40.15-40.65), BHP’s short-term uptrend remains intact. Recent candles and price action (i.e., the steepness of the rally from the trend ribbons) indicate solid demand-side control – and that gives me confidence in its continuation.
The next challenge is the latent supply likely to be encountered at 42.39, and we can already see potentially some pausing of the recent uptrend beneath this level. A close above 42.39 would facilitate a move to the next point of supply (minor) at 44.03, and potentially even to 46.23 (major).
Conclusion: Winners are grinners! 😁
Whilst the market response to each company’s results is still playing out, it’s growing increasingly clear that the share price trends of CSL and BHP appear set to diverge. Most investors view a big plunge in a stock’s price as it suddenly becoming cheaper – as if it is a box of cereal on sale for half price at the supermarket. But unlike that box of cereal – which will return to full price on Wednesday when this week’s specials roll off – there are no guarantees in the stock market!
There is generally a very good reason for a stock’s post earnings demise, and investors who knee-jerk rush in to buy perceived “cheapness” should be careful – big moves mean big money is voting – and it can be dangerous to get in its way. Similarly, stocks that are rewarded post earnings should be investigated for reasons of their strong performance – likely a reflection of how their business is travelling.
The mantra of a trend follower like me is to buy into strength and sell into weakness. It’s not an approach that suits everyone, I know. But before you dismiss it, challenge yourself to investigate large post-earnings swings. For the stocks that were crushed post-earnings, where were their share prices 6 and 12 months later? Likewise for those stocks that shot the lights out. It’s a worthwhile exercise, and one which I have no doubt will yield surprising and valuable results!
