ChartWatch Markets: US stocks may just go up forever! Plus, lithium bounced big in June, but where's the "other" critical mineral now?
Technical analysis of the most important global stock indices, commodities, bonds, FX, and crypto impacting your ASX portfolio each day.


Source: Shutterstock
Mentioned
KEY POINTS
- The Nasdaq Composite logged a strong gain on Monday and is now just a stone’s throw from another record high. How’s it even possible given the US government shutdown (not to mention historical overvaluations, a slowing US economy etc. etc.!)?
- Lithium minerals prices rocketed in June, July and August, well before all the latest talk about rare earths and critical minerals. But how is the forgotten critical mineral looking now? We investigate.
- In today’s edition of ChartWatch Markets we go to the charts to answer the difficult questions investors are grappling with: Stay the course in US stocks or run a mile? Is lithium at the start of a new bull market? Let’s dive in!
In today's edition of ChartWatch Markets, we'll be covering the technicals for:
Nasdaq Composite
Lithium Carbonate Futures (Benchmark month, back-adjusted) GFEX
Australian Spot Spodumene Concentrates ($US/mt)
Nasdaq Composite Index

Nasdaq Composite Index chart (click here for full size image)
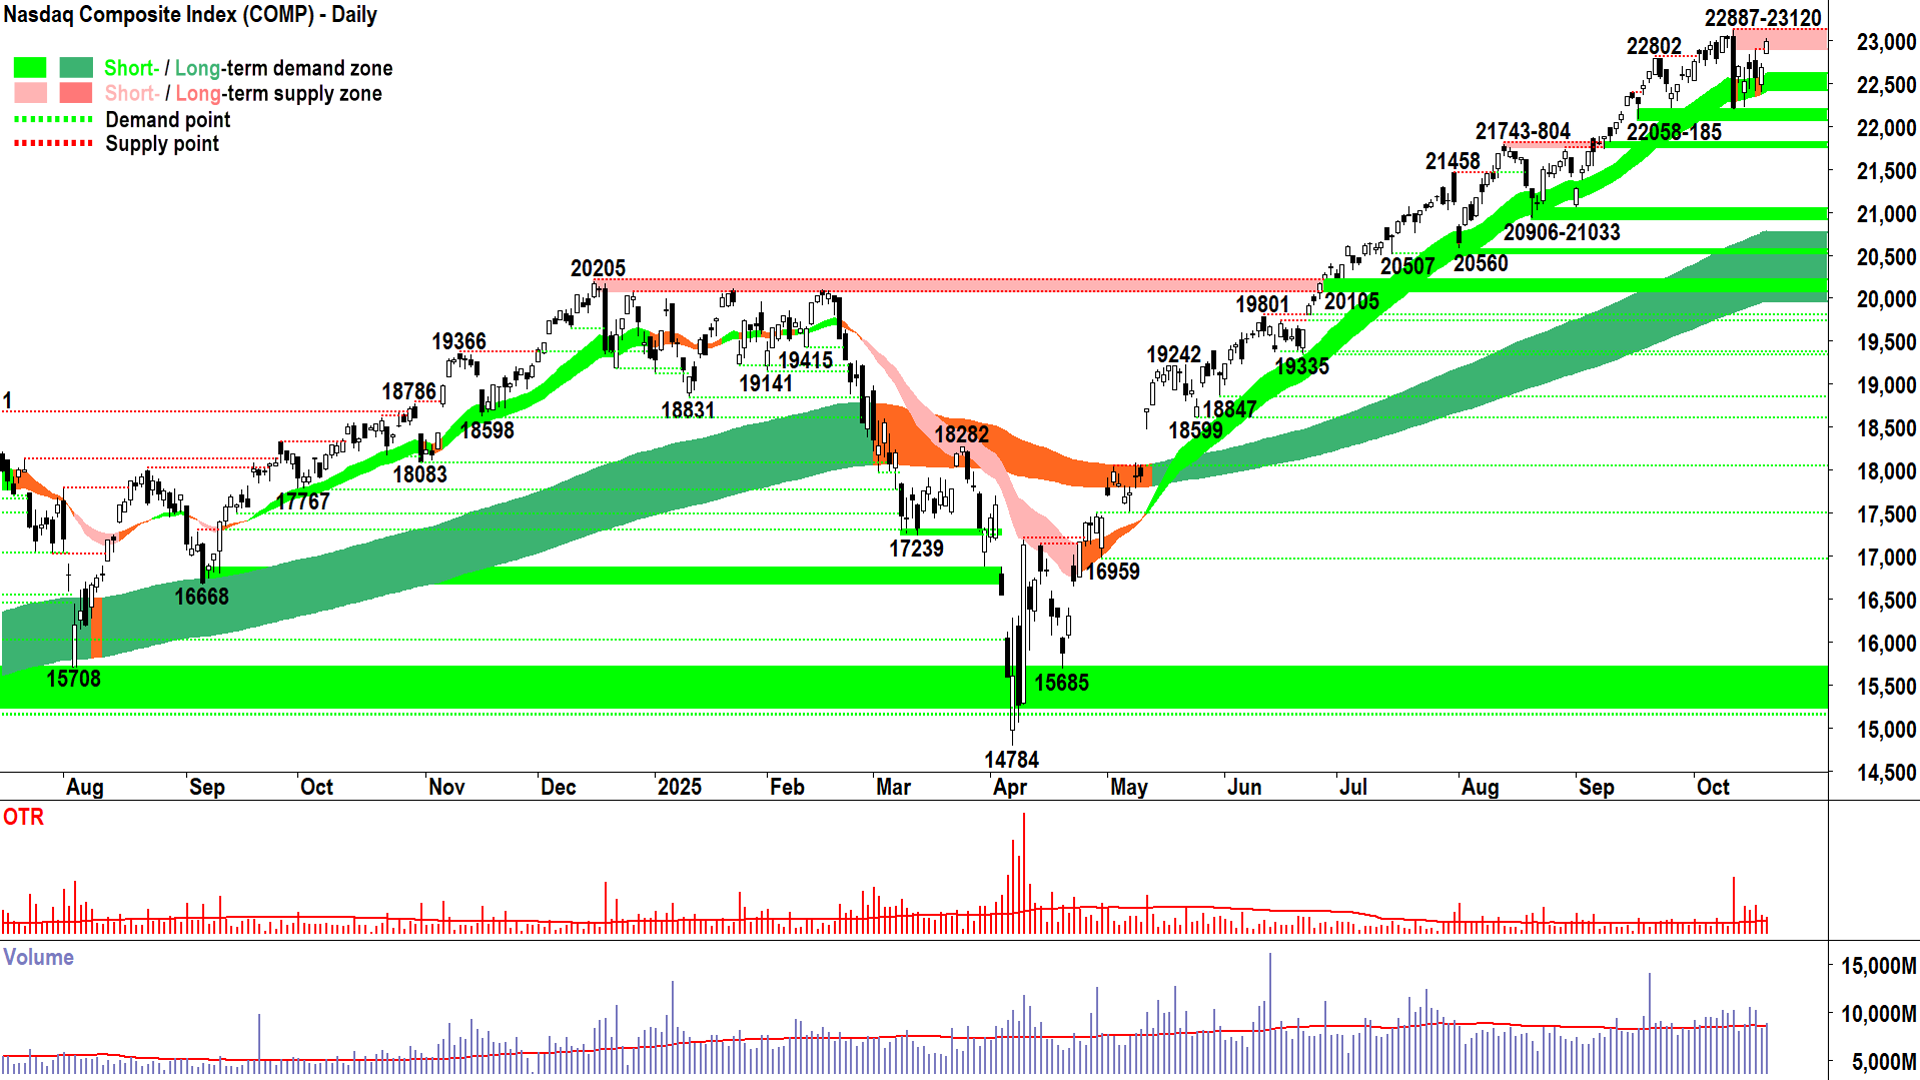
As you know, I’ve been a little – let’s call it, “circumspect” – regarding the Comp since “that candle” on 10 Sep. I think you’d also agree that I’ve been its biggest supporter prior to that candle – and I challenge you to find a better commentator on this chart across the universe of blah blah blah that is the internet!
I almost feel disloyal having doubted it this last week and a bit, as the price action has wobbled within the range of that massive supply-side showing. But Monday’s strong demand-side response has assuaged many of my concerns. It featured:
Gap-and-run white-bodied candle
Close near high of session
Close above 22887 point of supply
Close near 23120 all-time high
It’s not like I had waivered from FRP, though – simply, I can now say that I’m far more comfortable being there.
But! There’s still work to be done to fully confirm the demand-side has completely regained control of the Comp’s price. Nothing will demonstrate this more emphatically than a close at a new high, i.e., above 23120, particularly with a strong demand-side candle (i.e., long white body and or downward pointing shadow, close at or very near the high of the session).
But! The future is unwritten, and anything can happen, so we should have earmarked in our playbook of potential outcomes the page on “Massive sell the rally supply event” just in case! This is because the supply-side know the best time to sell is when there’s plenty of motivated demand flooding in. This is how they can move the most stock at the best prices.
It makes the price action and volume at new highs excellent indicators of the supply-side’s power and motivation:
1. Best case scenario:
New high with little-to-no supply-side response (i.e., just demand-side candles) – equals little-to-no supply-side power and no motivation. MOTN (More Often Than Not) the bull market is likely to kick on ✅.
Low volume here signals the supply-side is simply nowhere to be found, versus high volume here signals they were up and about, but got consumed – both good outcomes for MOTN ⬆️
2. Worst Case Scenario:
New high with big supply-side response (i.e., long black bodies, but far more sinister – long upward pointing shadows) – equals substantial supply-side power and motivation ⚠️.
Low volume here signals that demand evaporated after the new high, but this is a rare occurrence for a new high reversal. High volume at a new high is far more common, and signals a bunch of demand was drawn in (FOMO!), consumed, and then overwhelmed by a wall of supply. Clearly this combination is the worst outcome! ⚠️⚠️⚠️
Just putting the possibilities on your radar so you can play along at home. In the meantime, as far as the 3 tent pegs of my technical model go, i.e., trends, price action and candles:
Short and long term trend ribbons: ⬆️ / ⬆️, widening (getting stronger), acting as a zone of dynamic excess demand = ✅
Price action: Rising peaks and rising troughs (i.e., supply removal and demand reinforcement) = ✅
Candles: Demand-side candles (i.e., white-bodied candles and or downward pointing shadows) = ✅
View: ✅✅✅ = I prefer to stay the course on the Comp at FRP (Full Risk Position corresponds to a 100% allowable capital allocation limit for US stocks based on my personal risk management model).
Key levels: 22058 is the critical point of demand, the price should not close below here if the demand-side is in control of the Comp's price – it will nullify the short term uptrend; a close below the short term uptrend ribbon (presently 22405-22605) is also a warning sign = ⚠️
Lithium Carbonate Futures (Benchmark month, back-adjusted) GFEX

Demand is strong, supply is stronger! (click here for full size image)
First, let's do some fundamental analysis on the lithium markets. Let me start with just how strong demand is...
Okay, yes, we both know I'm joking! Carl doing fundamentals in ChartWatch... not bloody likely! 🤣
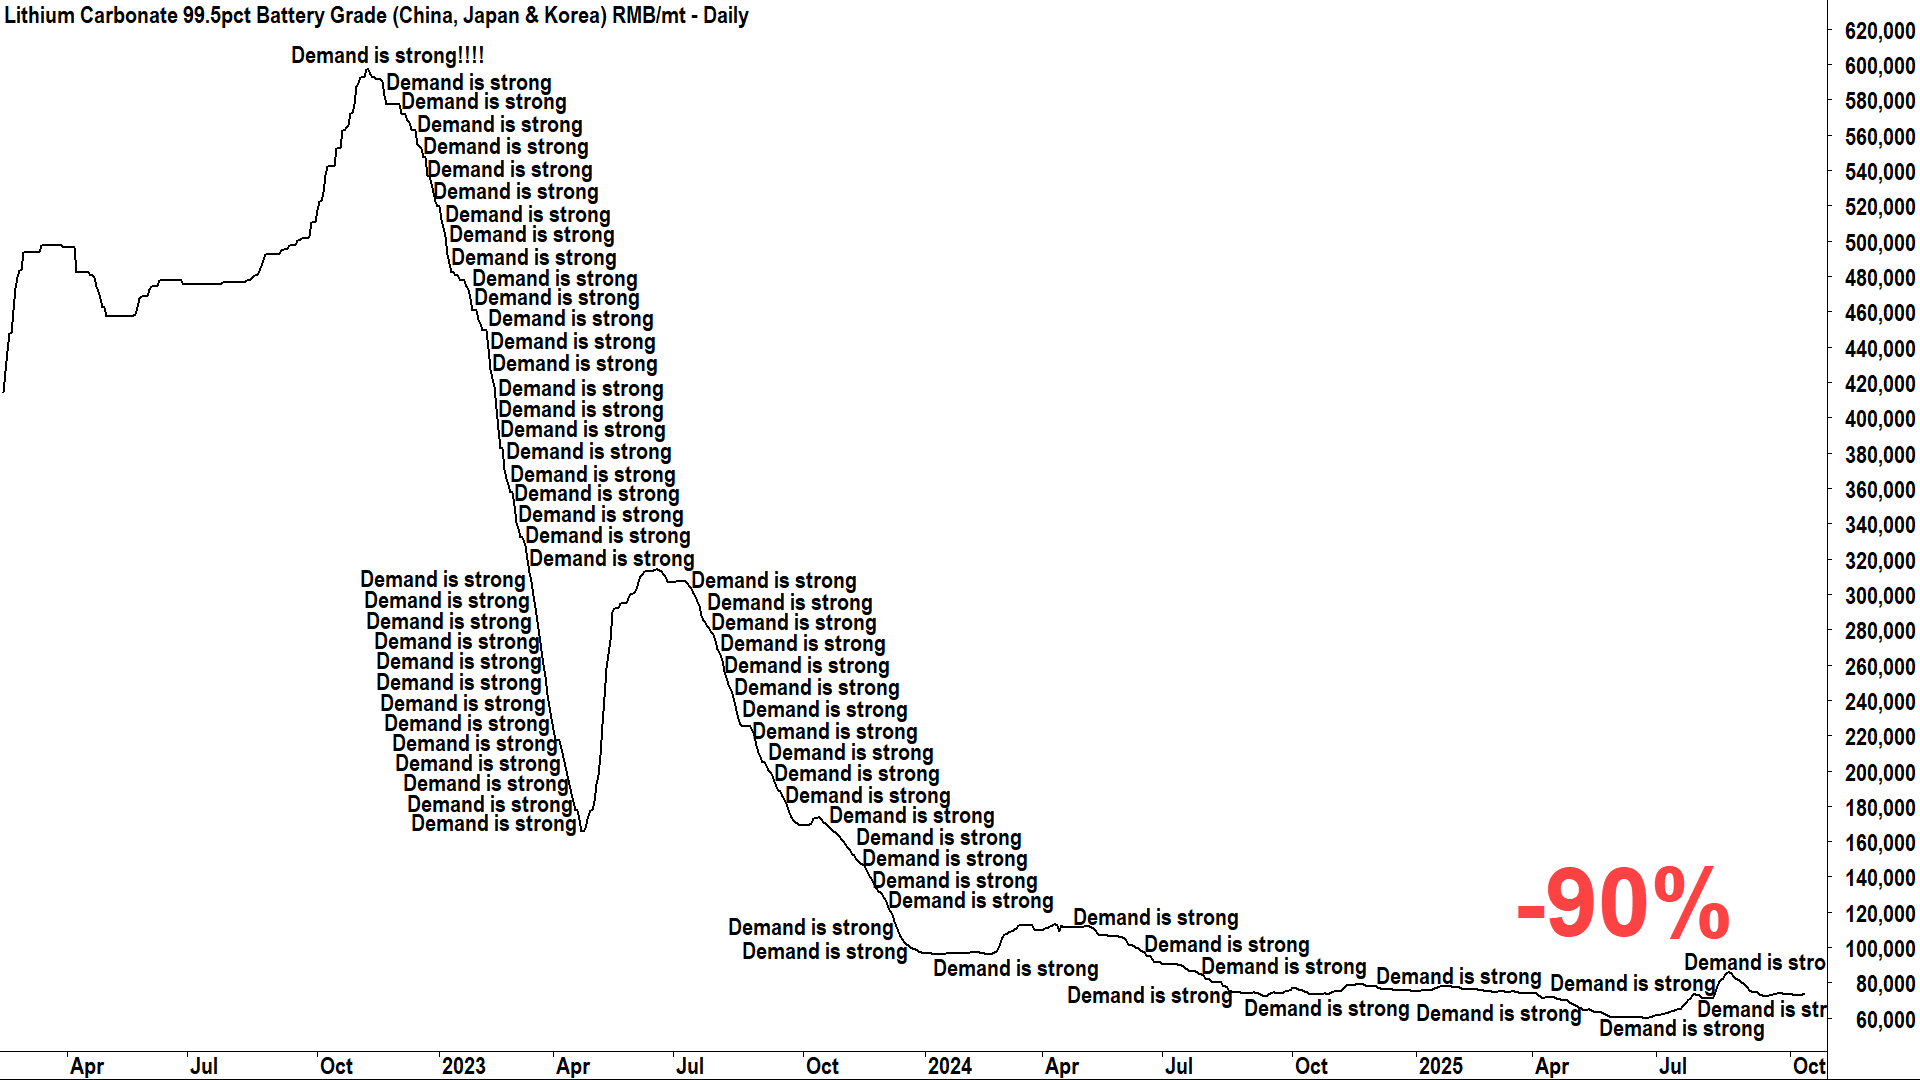
But can I say, that the typical lithium bull's mantra over the last 5-years (more?) has been "demand is strong"?
And I don't disagree with this, because all the research I've read, and all the data I've seen, appears to support this narrative. Strong demand has never been lithium's problem.
Nope, lithium's problem over the last 3 years is that demand is only half of the most important equation in economics: D + S = P. More specifically, S > D = P ⬇️.

The demand is strong narrative is a dangerous one when prices begin to fall due to S > D = P ⬇️ (click here for full size image)
It's easy for new investors to fall in love with the "demand is strong" narrative, and to be fair, this narrative serves them well on the way up. But when the supply-side arrives to meet, and then exceed that "strong demand" – as it has done in every bull market since one tulip bought you a Dutch windmill back in the summer of 1636... the strong demand narrative just doesn't cut it anymore.
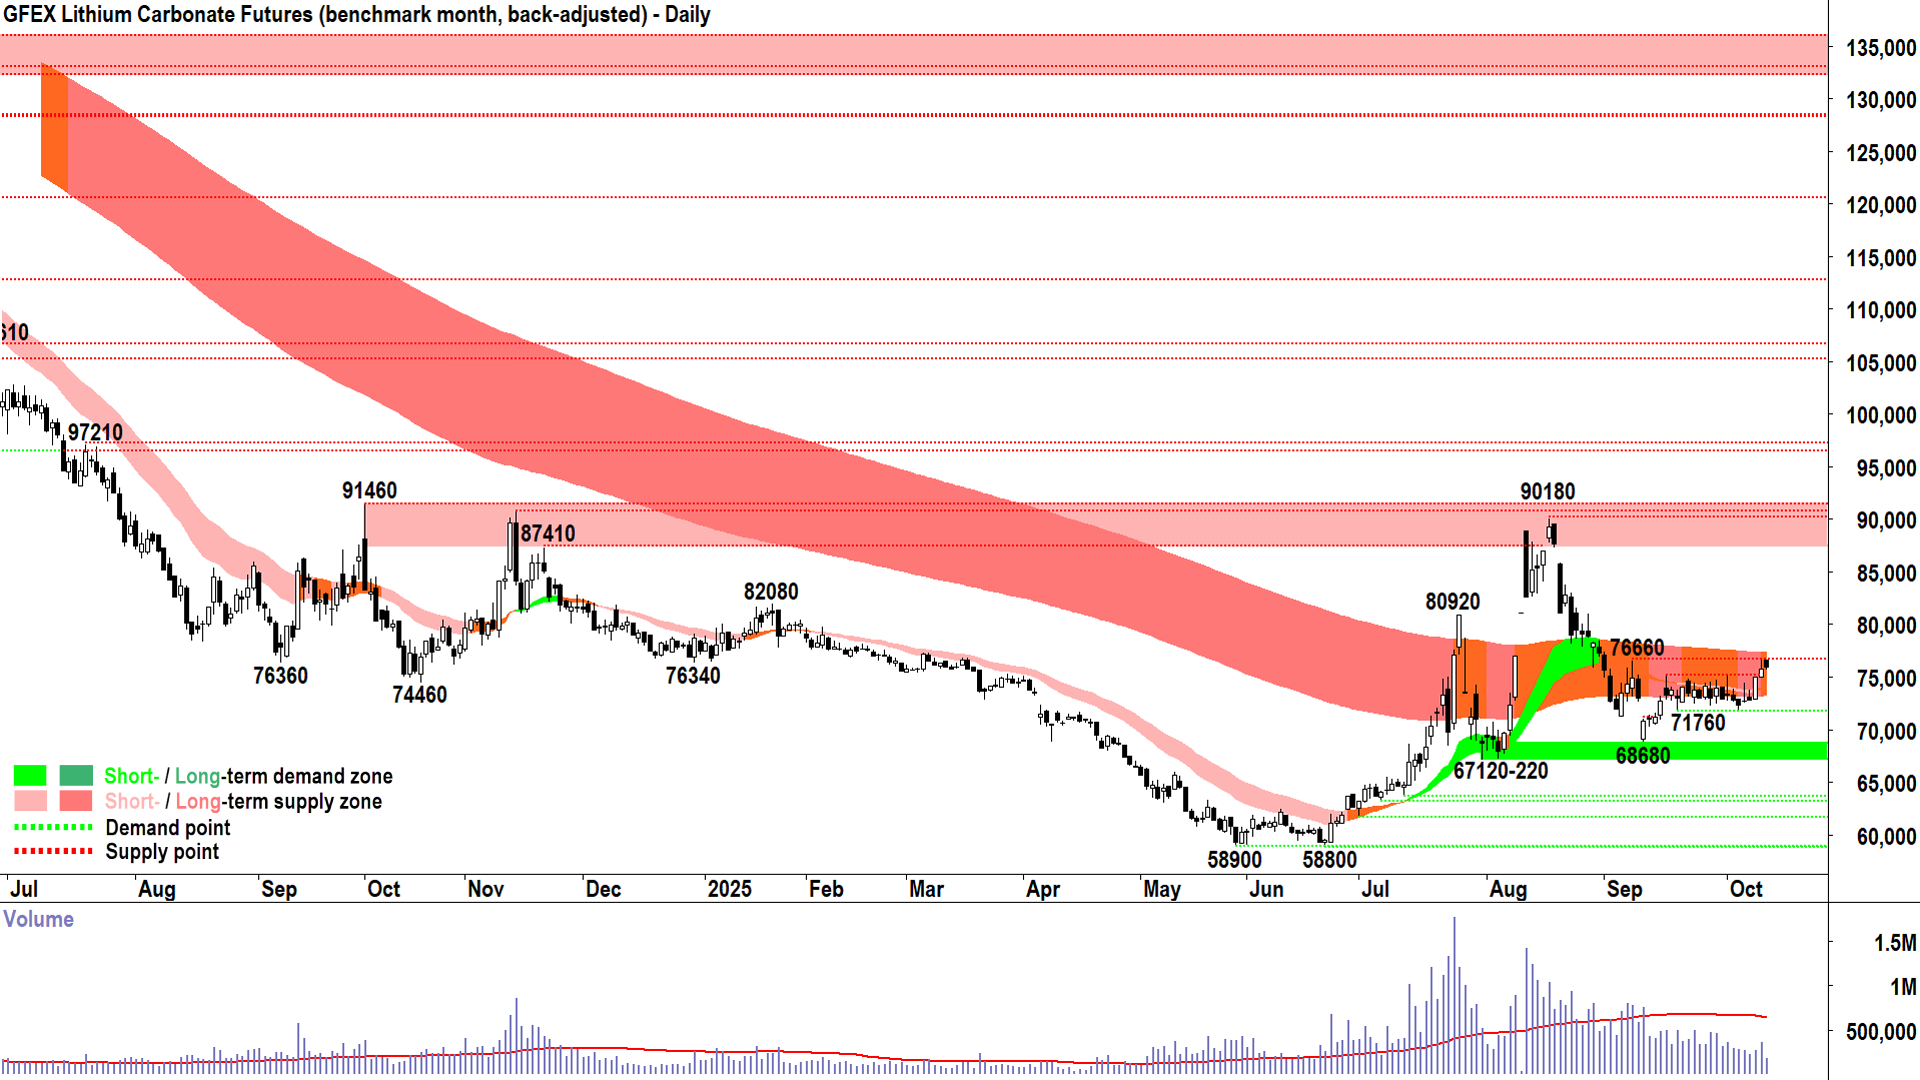
Looking back up to the top chart, that of GFEX Lithium Carbonate Futures, we can see an long period where S > D = P ⬇️ has given way to around 4 months and counting of D = S = P↔️.
The short term trend ribbon has neutralised after the excitement of the Jun-Aug rally, and the long term trend ribbon has flip-flopped between down and neutral… it’s now back to neutral.
Neutral-Neutral = Equilibrium ⚖️
There are some signs in the price action and candles that the demand-side is growing in influence over price, however. Granted, the price action is largely flat, but the last push into the 76660 point of supply smacks of increasing supply removal and modest demand reinforcement.
Candles are a touch mixed, but after the 16-Oct strong showing, I’m happy to say they’re again predominantly demand-side in nature.
Still, it’s all a bit flat… Right? 🤔
Hey, flat is a massive setup up from the near-3-year bear market that preceded this period of equilibrium. Lithium is likely building a base here – in its own volatile / can and probably will do anything kind of way!
How long that base builds (I’ve mentioned “bump along the bottom for months” here previously), is anyone’s guess. We just have to wait and watch for the clearing of the following key levels:
76660 is the key point of supply, and it roughly coincides with the dynamic supply we’d ordinarily expect at the long term trend ribbon. A close above here is significantly constructive for triggering greater FOMO and short covering = 📈
71760 is a key point of demand, ideally, we don’t see a close below there – it wouldn’t be a good look as it suggests the demand-side has all the time in the world to get in and the supply-side remains naggingly strong. 68680 is more likely to the be critical go-no-go point for lithium, however. Below here and it’s going to feel a lot like the old bear market again = 📉
In between, it’s twiddle one’s thumbs sort of stuff. Narratives bedamned!
Australian Spot Spodumene Concentrates ($US/mt)

D > S = P⬆️? 🤔 (click here for full size image)
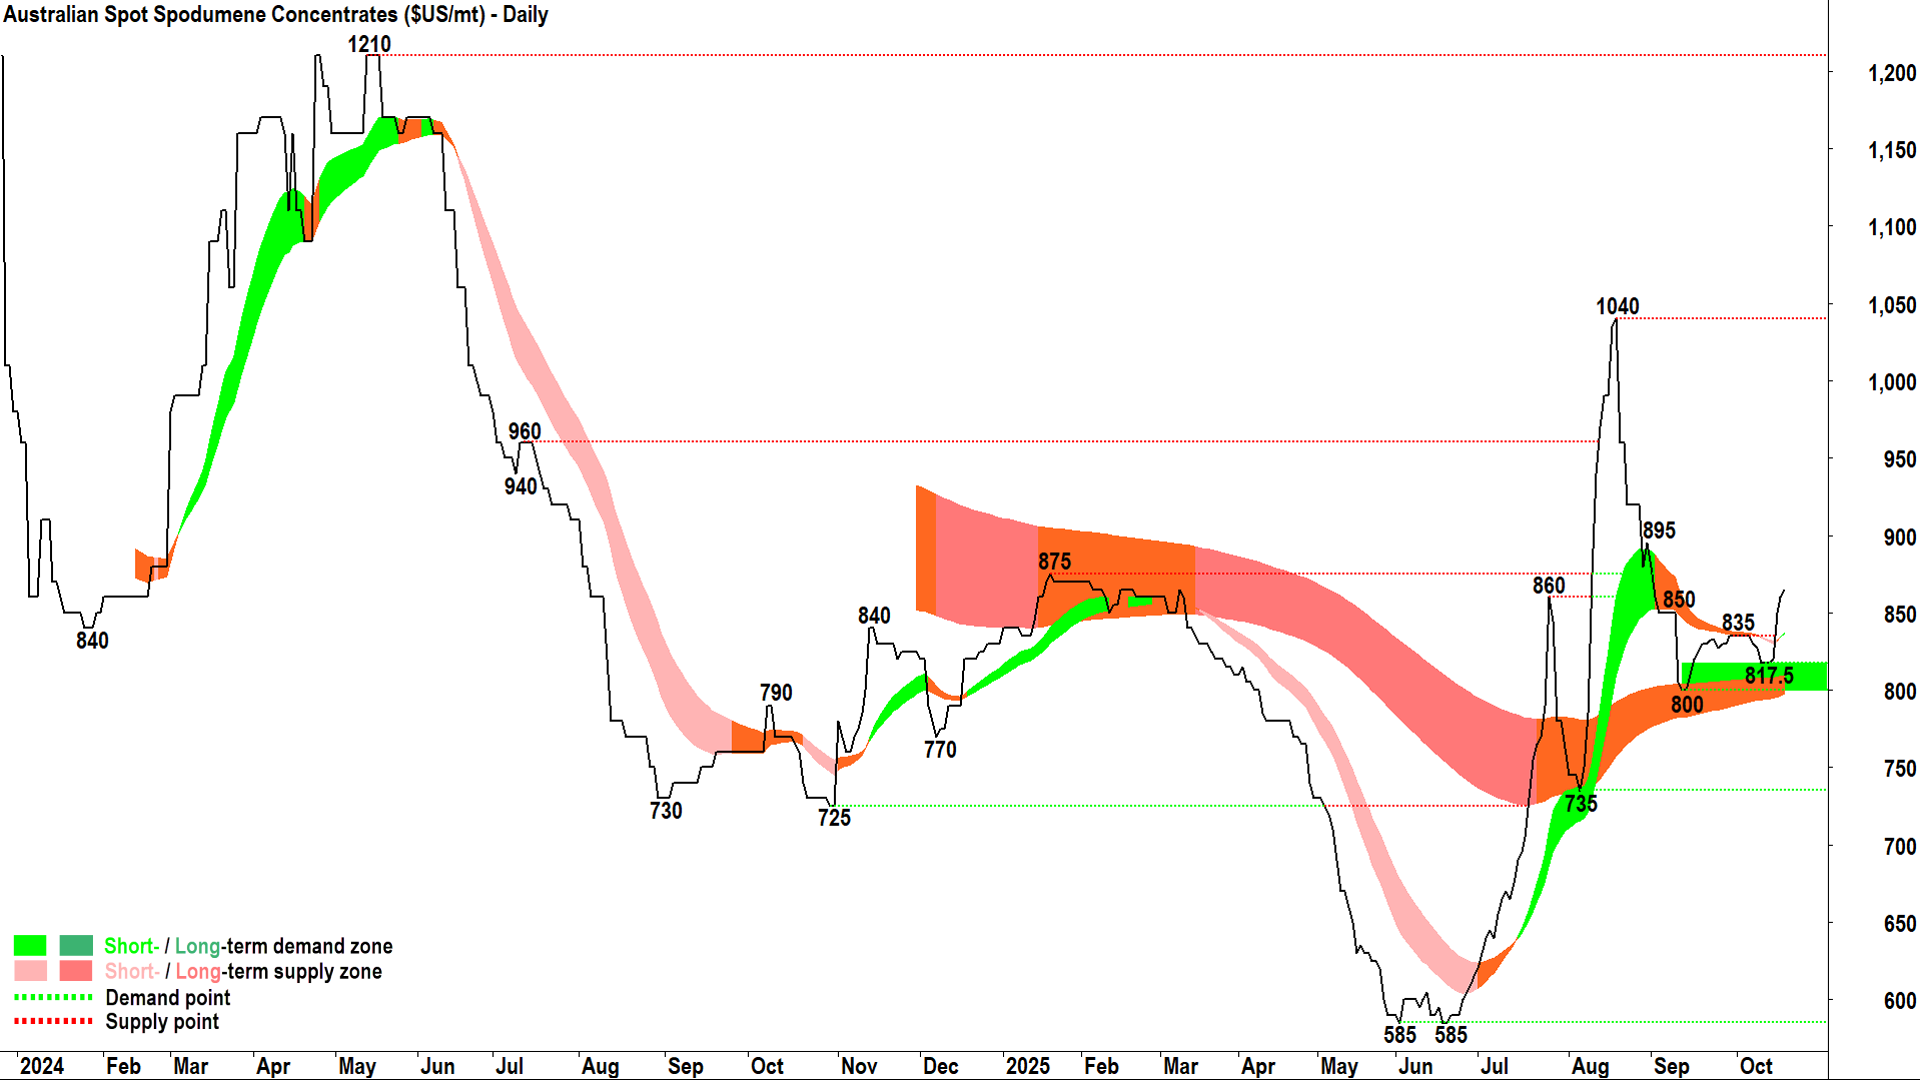
“Far more constructive” is how I’d describe the Aus Spod chart.
I see a whisp of a short term uptrend ribbon (it’s there, you just have to zoooommmm in!), and a long term uptrend ribbon that whilst only neutral, is converging towards an uptrend.
Most importantly, that long term uptrend is doing what it typically does in a bull market – acting as a zone of dynamic demand. That’s the biggest check-mark for me here ✅ – in my experience in bear to bull reversals (which spans +30 years!) it's just so important.
It signals buy the dip and accumulation, not sell the rally and distribution.
In the shorter term, we can see that the price action has reverted to rising peaks and rising troughs, modestly so – but also signalling a buy the dip mentality among market participants.
For me, it’s pretty simple here: Aus Spod is in a new bull phase, but not yet an emphatic one. There’s clearly still plenty of trepidation in the system from the supply-side, versus a demand-side that is far from being gripped by FOMO.
The chart is constructive for further slow but steady gains towards 895, and then probably well down the track at this rate, towards 1040.
A close below the long term trend ribbon nullifies the uptrend here (presently 798-810).
ChartWatch *LIVE* Webinar
ChartWatch *LIVE* Webinars – WEEKLY Wednesday's @ 12pm AEDT
Learn more about technical analysis and trend following through real case studies on ASX stocks. Australia's premier technical analyst, Carl Capolingua, shares his unique insights on stocks as requested by viewers. Ask about a company in your portfolio or anything related to trading and investing and get Carl's expert opinion.
Places are limited so >REGISTER NOW!<
