ChartWatch Markets: Silver, gold, platinum and palladium – the precious metals melt up continues
Technical analysis of the most important global stock indices, commodities, bonds, FX, and crypto impacting your ASX portfolio each day.


Source: Shutterstock
Mentioned
KEY POINTS
- The prices of precious metals – gold, silver, platinum and palladium are soaring – with silver tipping a new all-time high, gold on the verge of setting a new high, and platinum and palladium closing in on multi-decade highs.
- We review the charts of each to determine the key technical analysis factors that may signal further gains, or imminent reversal – as well as the small but impactful group of ETFs that investors can use to trade them.
- We also look at the last technicals for the Nasdaq Composite and the S&P/ASX 200 as each increasingly looks set for the customary Santa Claus Rally.
Kerry and I are on light duties this week, so the regular Morning and Evening Wraps and the Live Blog are already on holidays. 🏖️
Given the candles don’t take holidays, I thought it best we continue to run our collective eyes over a few charts to keep the technical analysis ticking along.
We’re back to full programming on Monday, January 5.
In today's edition of ChartWatch Markets, we'll be covering the technicals for:
Nasdaq Composite
The Old Tin Pot (aka the S&P/ASX 200)
Shiny stuff = Gold, Silver, Platinum & Palladium
Nasdaq Composite Index
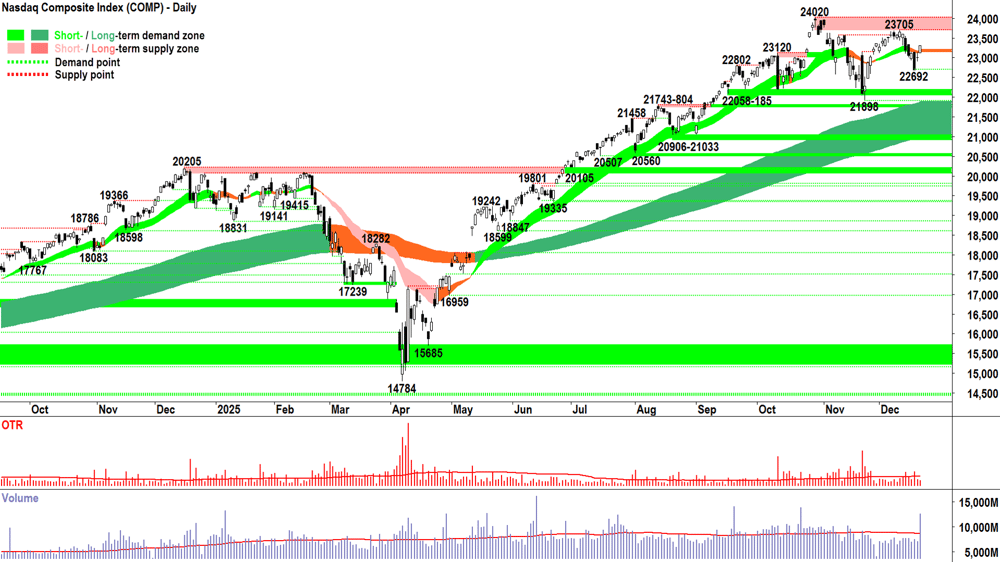
Analysis
In our last Comp update all the way back on 4 December, we were tracking along at a roughly neutral bias, edging towards adding risk should the price action was to confirm 23570-24020 was no longer acting as a zone of excess supply.
It got very close (peaked at 23705 on 10-Dec), only to fade back and make another – but importantly, higher trough at 22692. Friday’s credible demand-side showing is accompanied by the echo of sleigh bells as the often inevitable end of year rally has likely begun.
Good stuff with respect to the Comp’s technicals:
Long term trend… one must start there – it remains intact and strong, showing little signs of wavering despite what is becoming a lengthy consolidation phase
22692 > 21898 = Higher troughs. Importantly, both troughs were made in the face of very strong supply-side showings – and this is kind of the kicker – each was prior supply-side showing was so strong (check candles for 20-Nov & 17-Dec) you’d be forgiven for expecting the worst! For the Comp to so nonchalantly reverse course each time without any respect for the supply that created those candles – it smacks of a market that is being “massaged” during this period of very low volumes and commitment.
This time of the year – it’s just not wise to bet against US stocks in the run-up to year end. The future is unknown and anything can happen = there’s no reason this year can’t be different – but "Comp 🚀" in the last couple of weeks of December is a MOTN proposition (More Often Than Not).
Not so good stuff with respect to the Comp’s technicals:
23705 < 24020 = There remains some credible latent supply nagging away towards 24020. It’s very likely coming from the same group of active managers that simply like that zone for the value it offers them. Perhaps their view is: If prices are going to be massaged up to a level I see as value – then why wouldn’t I take advantage?
The longer we fail to make a new high, the greater the risk of a “roll-over” (look at what occurred as recently as Feb). Bull markets are characterised by strong trends – but more than this – they are defined by the consensus that creates them. Strong trends occur when both sides of the market agree – and for a bull market, this means the demand-side wants to own stocks + the supply side wants to own stocks! There’s no balance! There’s no opposing views! There’s no indecision! Sideways markets are the epitome of balance (i.e., equilibrium), of opposing views (i.e., a lack of consensus), and of indecision – and that’s where we are now ⚖️.
View
I think somewhere between 1/2RP to 2/3RP is the right place to be (RP = Risk Position*). An emphatic close above 23705 with a strong demand-side candle (i.e., long white-body and or long downward pointing shadow) that closes at or very near its high would be sufficient to move to the 2/3RP mark. A close above 24020, naturally, would warrant FRP (Full Risk Position). (*My RP reflects my personal allowable capital allocation limit for my investments in US stocks. 1/2RP is 50%, 2/3RP is 67% and FRP is 100%).
Key levels
The trough at 22692 is the closest point of demand – a close below it would signal the demand-side has lost control of the Comp's price. On a close below 21898 the short term trend is unequivocally down and the long term uptrend is likely under significant pressure = ⚠️ 23705-24020 is the nearest critical zone of supply – the Comp must close above this zone with a strong demand-side candle to confirm the demand-side is unequivocally back in control of the Comp's price.
S&P/ASX 200 (XJO) (a.k.a The Old Tin Pot!)
%20chart_22%20Dec.png)
Analysis
In Friday’s evening wrap, we noted that a “commendable” candle for that session, plus a stubborn inability to close below the key 8562 point of demand in the preceding two candles. I said this left us with a “sniff” of a Santa Claus Rally.
Today it's more of a waft than a sniff! 👃✅
And perhaps there’s somewhat a sense of inevitability about it, as this time of the year is synonymous with a little bit of cash – thrown at the right stocks at the right time – manufacturing an outsized positive gain in the benchmark.
Oh, and if you’re wondering – ignore Friday’s volume – that’s options expiry: it’s not the volume we pay attention to. Today’s volume – or total lack thereof – is far more instructive! 🤦
Hey, as technical analysts we don’t care why something is happening, just that it’s happening – and based on the last time they tried to pump the Old Tin Pot on 12-Dec – we were very tentatively moving back to 1/2RP.
I put that move on hold for a few days, in favour of seeing another confident demand-side showing – and I put to you that today’s full white candle, closing at its high and a whisker away from 8702, is enough.
It is what it is, i.e., trade what you see, not what you think!
View
I now recommence the transition to 1/2RP (i.e., my personal allowable capital allocation limit for my investments in Australian stocks has increased from to 50% from 33%). .
Key levels
8547-8562 is the new closest zone of demand. A close below this price would confirm the supply side is back in control of the ASX 200's price. In theory though, the short term and long term trend ribbons may now begin to act as a zone of dynamic demand/supply (presently 8553-8665). After 8702, the next key zone of supply is the old demand zone at 8731-8738, and then it's 8809-8843 above that.
Silver Futures (Front month, back-adjusted) COMEX
%20COMEX%20chart_22%20Dec.png)
Analysis
Sublime silver!
Talk about getting on with it 🚀! Talk about total market consensus 💪!
Demand-side = Highly motivated to own silver = Throwing cash at those who already own silver
+
Supply-side = Highly motivated to own silver = Withholding supply unless compensated with substantially higher prices
= P ⬆️
Oh, and there’s all those fundamentals you’ll read all over the internet… including some I discuss here.
But those are words… they’re nothing more than plausible narratives designed to explain what’s happening in demand and supply.
Some people love plausible narratives. They wrap themselves up in them like a cosy safety blanket to justify their present belligerent course of action.
“XXX is going to go to the moon because of A + B + C…and I’m going to hold on the whole way it’s going to make me a gazillionaire!” 🤑
But it’s these same plausible narratives that will cause them to hold on far too long after the trends change, and when the demand-supply environment is shouting something else! 📢
The good news is, we don’t require plausible narratives to make us feel better about why we’re investing in a particular way. We do so without a care in the world… flippantly trading in and out at the behest of a bunch of squiggly lines on a chart.
“How dare you!?” – Say exponents of plausible narratives… 🤬 “You’re parasites… you’re ignoramuses… you’d don’t understand how the plausible narrative ensures XXX will go up forever… !!!”
(I’ve heard it all before!)
But indeed, we dare… knowing that the little we know about anything outside of those squiggly lines on our charts keeps us safe – because it requires us to abandon what everyone believes to be a sure thing and manage our risk accordingly!
Um, okay, (takes deep breath…) righto, let’s talk about silver.
I don’t know where silver is going and I don’t care why it’s going there. I do, however, know where it’s been (i.e., trends ✅, price action ✅ and candles ✅), and that suggests total demand-side control 💯.
Total demand-side control = Consistent with a “MOTN P⬆️” scenario = ✅.
View
Based on silver's trends, price action, and candles, and as per the last update, my model allows for an add risk stance "+R" for those looking to increase their risk exposure, or a maintain current risk stance "=R" for those comfortable with their present risk exposure.
Key levels
Silver is trading at record highs – the market has no obvious level to peg in its mind as "the" place it ought to stop buying and start supplying. So, it really can do anything until a sharp-high volume, high volatility reversal that could peg such a level in the market's mind. As for demand, 61.01 is the most obvious trough / point of demand, but the short term trend ribbon (presently 58.20-61.05) is not far below. Silver's short term uptrend remains intact until its price closes below the short term uptrend ribbon.
Gold Futures (Front month, back-adjusted) COMEX
%20COMEX%20chart_22%20Dec.png)
Analysis
What is there to say about this chart!? It's also a picture of excess demand, but more a steady burn than the inferno that's engulfed silver 🔥.
4435.3 is the clear and present point of supply that must be overcome to facilitate another leg higher. Today's candle is live, so we will discount it – but should it close at it appears now or better – then 4435.3 is as good as consumed.
Ditto silver thematically, with nothing on my mind here but =R or +R.
View
Based on gold's trends, price action, and candles, my model allows for an add risk stance "+R" for those looking to increase their risk exposure, or a maintain current risk stance "=R" for those comfortable with their present risk exposure.
Key levels
The short term uptrend ribbon (presently 4228-4283) is the closest zone of demand, the price should not close below here if the demand-side is in control of gold's price; below this, 4034.7 will likely serve as a critical go-no go zone for gold's short term uptrend. 4435.3 is the closest zone of supply – a close above it puts gold back in blue-sky territory.
Platinum Futures (Front month, back-adjusted) COMEX
%20COMEX%20chart_22%20Dec.png)
Analysis
I haven't done my usual ChartWatch checklists because I think they're self-evident for gold and silver. As much as that's probably also the case here, and for Palladium below – let's just do one for completeness rather than simply going "ditto"!
As far as the 3 tent pegs of my technical model go, i.e., trends, price action and candles for platinum are:
(Consistent with demand-side control = ✅ vs Consistent with supply-side control = ❌)
Short and long term trend ribbons: ⬆️ / ⬆️, widening (getting stronger), the price is above both ribbons and both ribbons are acting as a zone of dynamic excess demand = ✅✅
Price action: Rising peaks and rising troughs (i.e., supply removal and demand reinforcement) = ✅
Candles: Demand-side candles (i.e., white-bodied candles and or downward pointing shadows) = ✅
✅✅✅✅ = Total demand-side control
All the way back on 30-Sep, I gave you a bunch of ASX listed ETFs that are exposed to the broader precious metals thematic. Looking at the charts in this update, can I propose my analysis in this space – without a single plausible narrative – has been pretty spot on!? 🎯
Here they are again for your reference (plus ChartWatch ASX Scans Uptrends List appearances 💪):
Global X Physical Silver ETF (ASX: ETPMAG) (35x since Sep-24 @ $42.10)
Global X Physical Palladium ETF (ASX: ETPMAG) (3x since Oct-25 @ $209.31)
Global X Physical Platinum ETF (ASX: ETPMPT) (17x since Oct-24 @ $143.67)
Global X Physical Gold ETF (ASX: GOLD) (70x since Jul-24 @ $33.30)
Global X Physical Precious Metals Basket ETF (ASX: ETPMPM) (30x since Jan-25 @ $264.34)
Vaneck Gold Miners ETF (ASX: GDX) (48x since Jul-24 @ $56.85)
BetaShares Global Gold Miners Hedged ETF (ASX: MNRS) (22x since Jun-25 @ $8.77)
View
Based on platinum's trends, price action, and candles, my model allows for an add risk stance "+R" for those looking to increase their risk exposure, or a maintain current risk stance "=R" for those comfortable with their present risk exposure.
Key levels
The short term uptrend ribbon (presently 1725-1786) is the closest zone of demand, the price should not close below here if the demand-side is in control of gold's price; below this, 1770 is the next key point of demand. The 23-Aug 2011 major peak at 2173 is the closest point of supply. Above this is the 4-Mar 2008 all time high of 2641.
Palladium Futures (Front month, back-adjusted) COMEX
%20COMEX%20chart_22%20Dec.png)
Analysis
This one's easy – ditto! 😉
View
Based on palladium's trends, price action, and candles, my model allows for an add risk stance "+R" for those looking to increase their risk exposure, or a maintain current risk stance "=R" for those comfortable with their present risk exposure.
Key levels
1732 is the closest point of demand, the price should not close below here if the demand-side is in control of gold's price; below this, the short term uptrend ribbon (presently 1563-1610) is the next key zone of demand. The 4-Oct 2022 major peak at 2548 is the closest point of supply. Above this is the 7-Mar 2022 all time high of 3637.
ChartWatch *LIVE* Webinar
ChartWatch *LIVE* Webinars – WEEKLY Wednesday's @ 12pm AEDT
Learn more about technical analysis and trend following through real case studies on ASX stocks. Australia's premier technical analyst, Carl Capolingua, shares his unique insights on stocks as requested by viewers. Ask about a company in your portfolio or anything related to trading and investing and get Carl's expert opinion.
Places are limited so >REGISTER NOW!<
