ChartWatch Markets: Gold and silver rallies go vertical as the Nasdaq logs "credible" rebound
Technical analysis of the most important global stock indices, commodities, bonds, FX, and crypto impacting your ASX portfolio each day.


Source: Shutterstock
Mentioned
KEY POINTS
- Gold and silver originally got a boost from the uncertainty that President Trump’s comments caused, soaking up capital fleeing stocks, but somehow, each grew even further in strength on Monday – despite the stock market’s rebound.
- Talk about TACO Monday! What a couple of trading sessions on the Nasdaq Composite, from potentially the end of the bull market to an emphatic resurgence – all on the back of President Trump backing away from his China tariff comments over the weekend.
- With the stock market seemingly back on track, and with both the gold and silver charts melting up, we review the latest technical analysis trends to try to determine what’s in store for investors.
In today's edition of ChartWatch Markets, we'll be covering the technicals for:
Nasdaq Composite
Gold Futures (Front month, back-adjusted) COMEX
Silver Futures (Front month, back-adjusted) COMEX
Nasdaq Composite Index

Nasdaq Composite Index chart (click here for full size image)
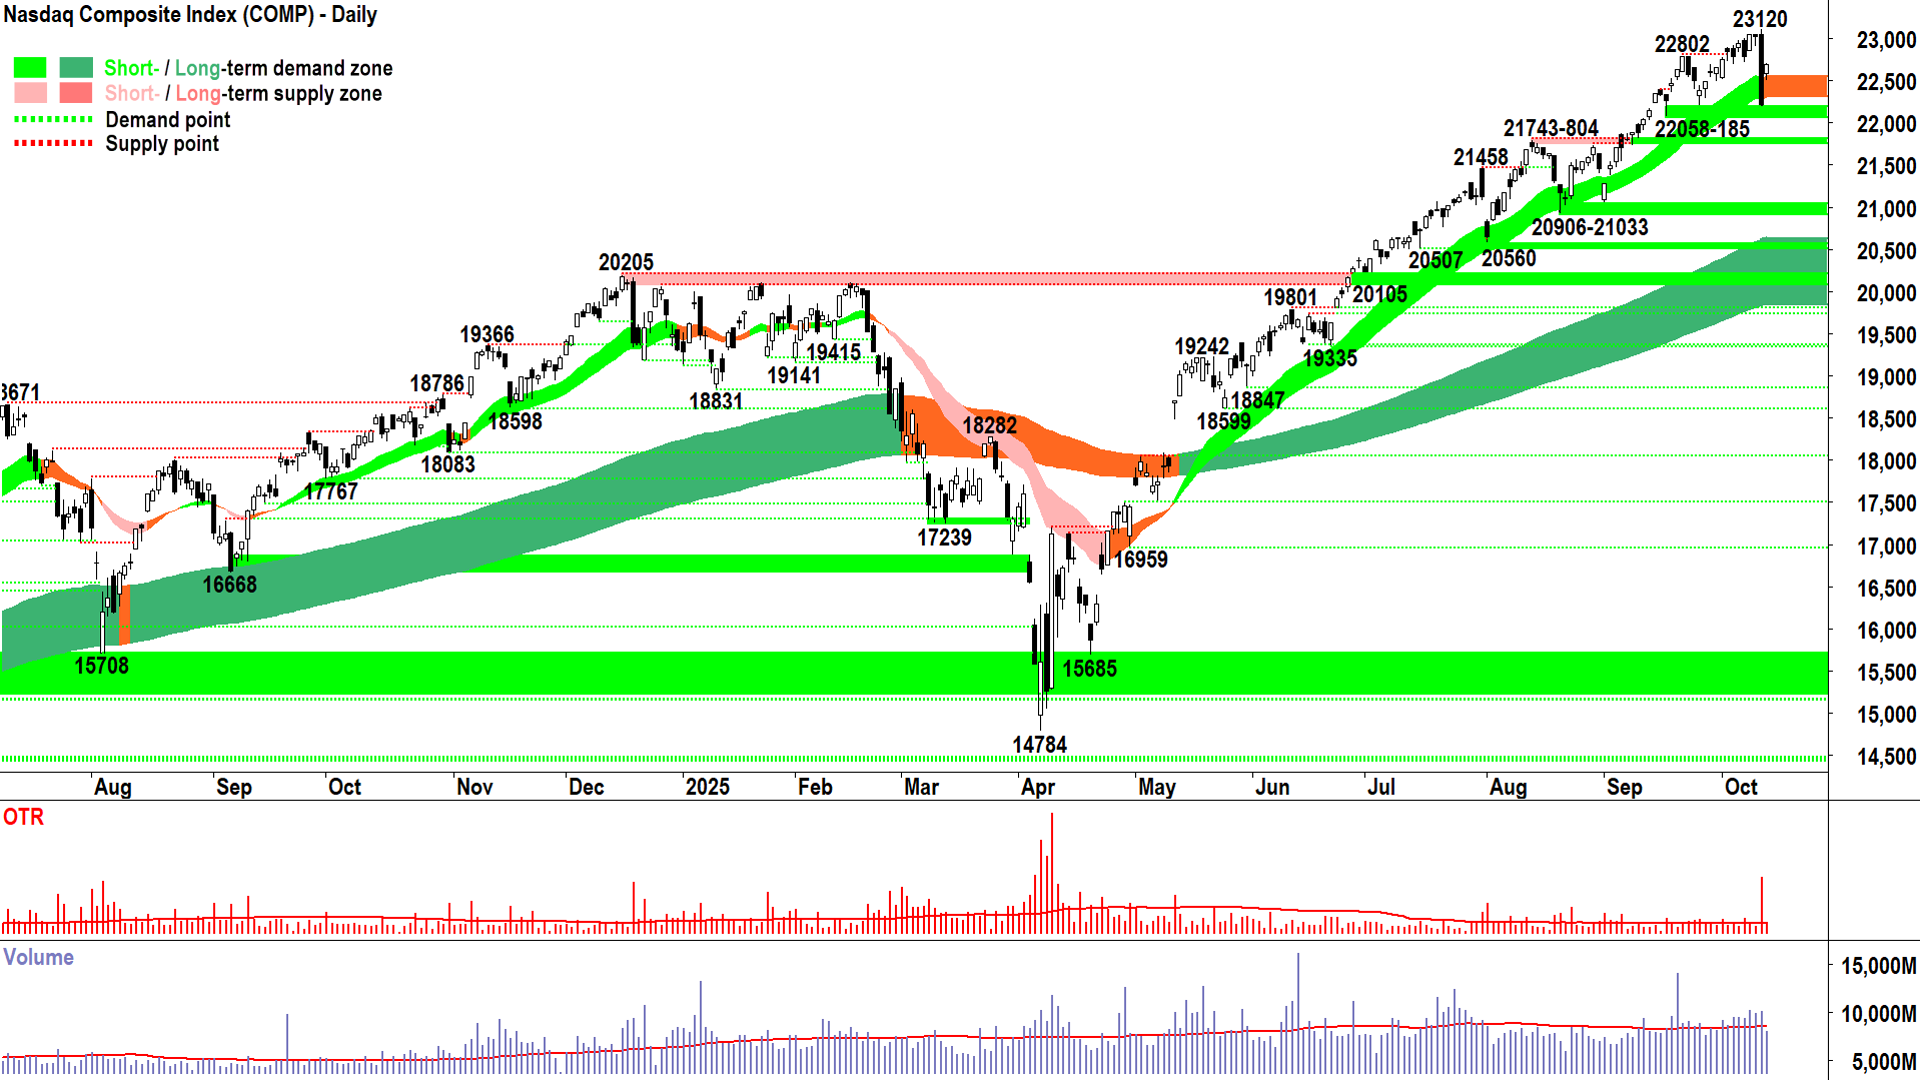
Monday’s Comp candle important details:
High: 22718.8
Close: 22694.6 (difference -0.1%)
Friday’s massive supply-side candle important details:
Mid-point: 22657
In yesterday's update, I gave you a matrix for potential Monday candle outcomes and what they would tell us about the demand-supply environment:
1. Next candle is long and white and or has a long downward pointing shadow = Demand-side control remains intact. Ideally, we close above the “balance point” (i.e., mid-point of Friday’s candle = 22657).
2. Next candle is long and black and or has a long upward pointing shadow = Supply-side is in control now. The demand-side is no longer driven by fear of missing out (FOMO) or by the tried and true buy the dip narrative. It’s getting out of the way, and it may even be joining the supply-side.
3. Next candle is a small demand-side candle that cannot close > 22657 = Demand-side offering some resistance, but hardly convincing – it remains open to attack as the supply-side does not yet have a definitive signal to switch back to holding risk instead of offloading it.
4. Next candle is a small supply-side candle that largely sits within the range of Friday’s candle = Little demand-side impetus / sustained supply-side pressure, bordering on control. In many ways, just as bad as scenario 2, which is now likely inevitable…
Based on the data provided above, which scenario did we get!? 🤔
If you said 1 – you’d be correct – well, that’s the closest anyway! Because Monday’s candle wasn’t “long” if one only measures its body using the traditional open to close method. If we include Friday’s low – i.e., the maximum extent of the supply-side’s control on that day – then Monday’s candle rightly becomes far more impressive.
The other important aspect of Scenario 1 was the requirement for Monday’s candle to close above Friday’s candle’s balance point (mid-point). Check on that item also. Not mentioned in Scenario 1 yesterday, but I really should have (you know this is also a requirement for a demand-side candle), is a close very near the high of the session. So, check there too = ✅✅✅.
So, trend followers, I propose got what we wanted on Monday = A credible demand-side showing.
That’s price action, what about volume? 🤔
It was below average. Pairing this fact with the price action we can conclude that there was a general consensus in the market: Add some risk (probably some of what was unceremoniously dumped on Friday!) and withhold supply – i.e., maintain risk.
It wasn’t “add a big pile of risk” – the volume just doesn’t support this – but lower volume also suggests lower offloading of risk too. If there remains latent supply in the system – it was not cleared out on Monday and therefore may remain in the system – probably eyeing off prices towards 23120.
In conclusion, hey – Monday’s candle could have been better – it could have recouped more of Friday’s loss... It is, however, a solid demand-side showing in terms of motivation. Volume suggests little commitment from either side for now, and this item must be resolved at some point (preferably with a high volume demand-side clearance of 23120!).
So, putting it all together – let’s go a B grade based on candle shape, close proximity to high, close vs Friday’s balance point, and volume.
Okay, so what does that mean? Well, my decision not to amend my maximum portfolio risk cap seems like the right thing to do for now. We still require:
1. More demand-side candles! White bodies, downward pointing shadows, closes near the high of the session – as many as possible to reestablish FOMO among the demand-side and the belief among the supply-side that if they hold, they’ll get far more down the track.
2. Clearance of any latent supply in the system lurking around 23120 – a strong demand-side candle on high volume would confirm this.
3. Avoid closing below the short term trend ribbon (which no doubt you’ve noted has neutralised!)
4. Avoid closing below 22058 – shaping as a credible go-no-go point for the short term uptrend.
Opposites of the above stuff is bad ⚠️. If you’re a bull, that is, because they’d be awesome if you’re a bear! 🐻
View: I remain in little rush to replace any risk knocked out Friday, but my official personal allowable capital allocation limit for US stocks remains 100% or "FRP" (Full Risk Position).
Key levels: 22058 is the closest point of demand, the price should not close below here if the demand-side is in control of the Comp's price; the Comp's price has closed below the short term uptrend ribbon (presently 22305-22550), therefore nullifying the short term uptrend = ⚠️.
Gold Futures (Front month, back-adjusted) COMEX
%20COMEX%20chart_14%20Oct.png)
Golden (click here for full size image)
It’s not my goal to provide daily coverage of gold and silver, but if something interesting is happening in these markets, then…
Looking at the chart of gold above, and of silver, below, I think we’re qualifying as "interesting" here! Vertical is interesting! 🤯
I must hand it to gold (and silver), they’ve shrugged off the round number blues (4000 for gold and 50 for silver) and have flourished. A bit of Trump tariff shenanigans helped – but excess demand is excess demand 👍.
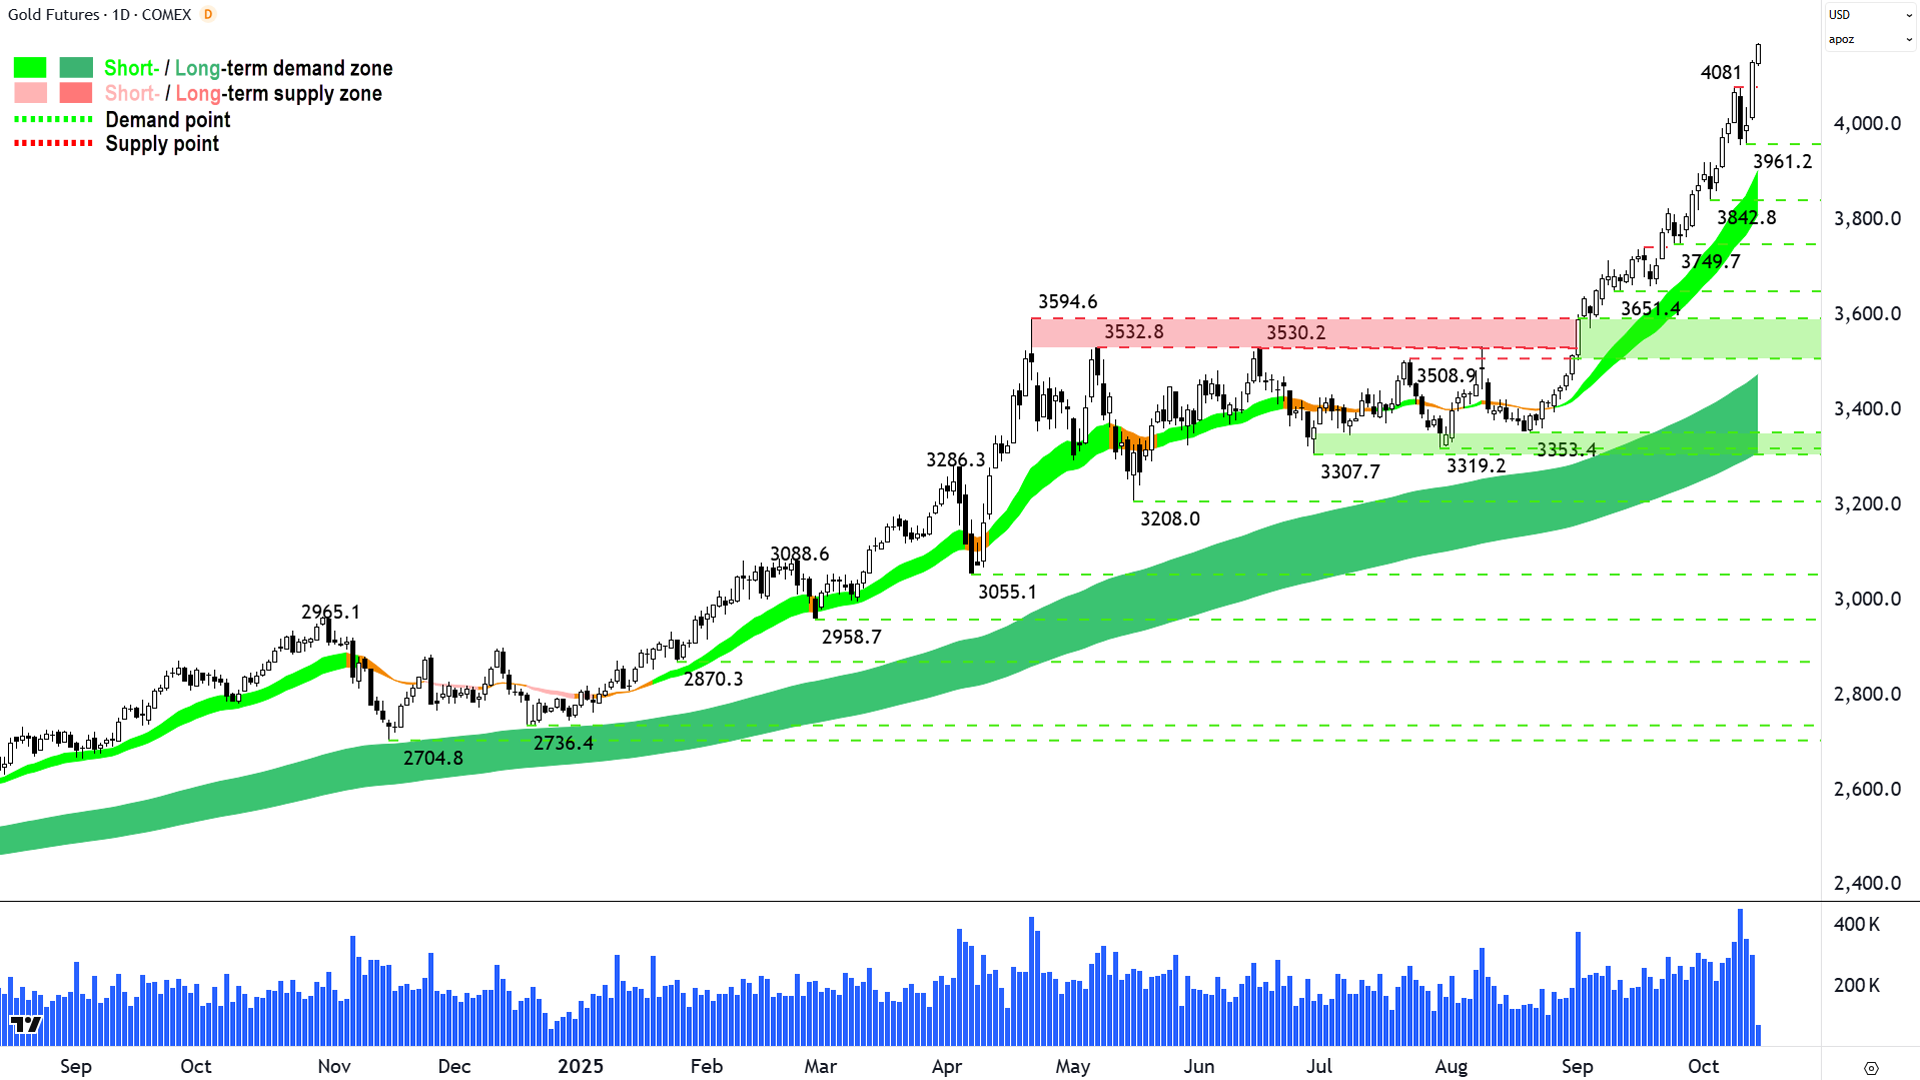
And that’s the best way to describe gold’s chart: A picture of excess demand.
There is a consensus among market participants to own gold:
1. Cash wants to own gold = They’re buying anything that resembles a dip, and once the dip has evaporated, remain motivated enough to bid up the price to entice out more supply.
2. Owners of gold want to own gold = They’re not panicking out en-masse if there’s a dip in price, and when prices are rising they’re withholding supply in the expectation of even higher prices ahead.
This is a generalisation, because to be fair, that last dip was on record volume – which is why I took it so seriously. Again, extenuating circumstances to pull all the cash from that supply even back into the market!
There’s nothing in this chart I don’t like. That's a double negative, let me rephase: I like everything about this chart.
View: From the standpoint that it is a picture of excess demand. But that can change quickly, and at any time. In the meantime, I can trade what I can see, so: No change to prevailing FRP view on gold.
Key levels: 3842.8 is the closest point of demand, the price should not close below here if the demand-side is in control of gold's price; alternatively, a close below the short term uptrend ribbon (presently 3815-3905) will also nullify the short term uptrend = ⚠️
Silver Futures (Front month, back-adjusted) COMEX
%20COMEX%20chart_14%20Oct.png)
Even more golden (click here for full size image)
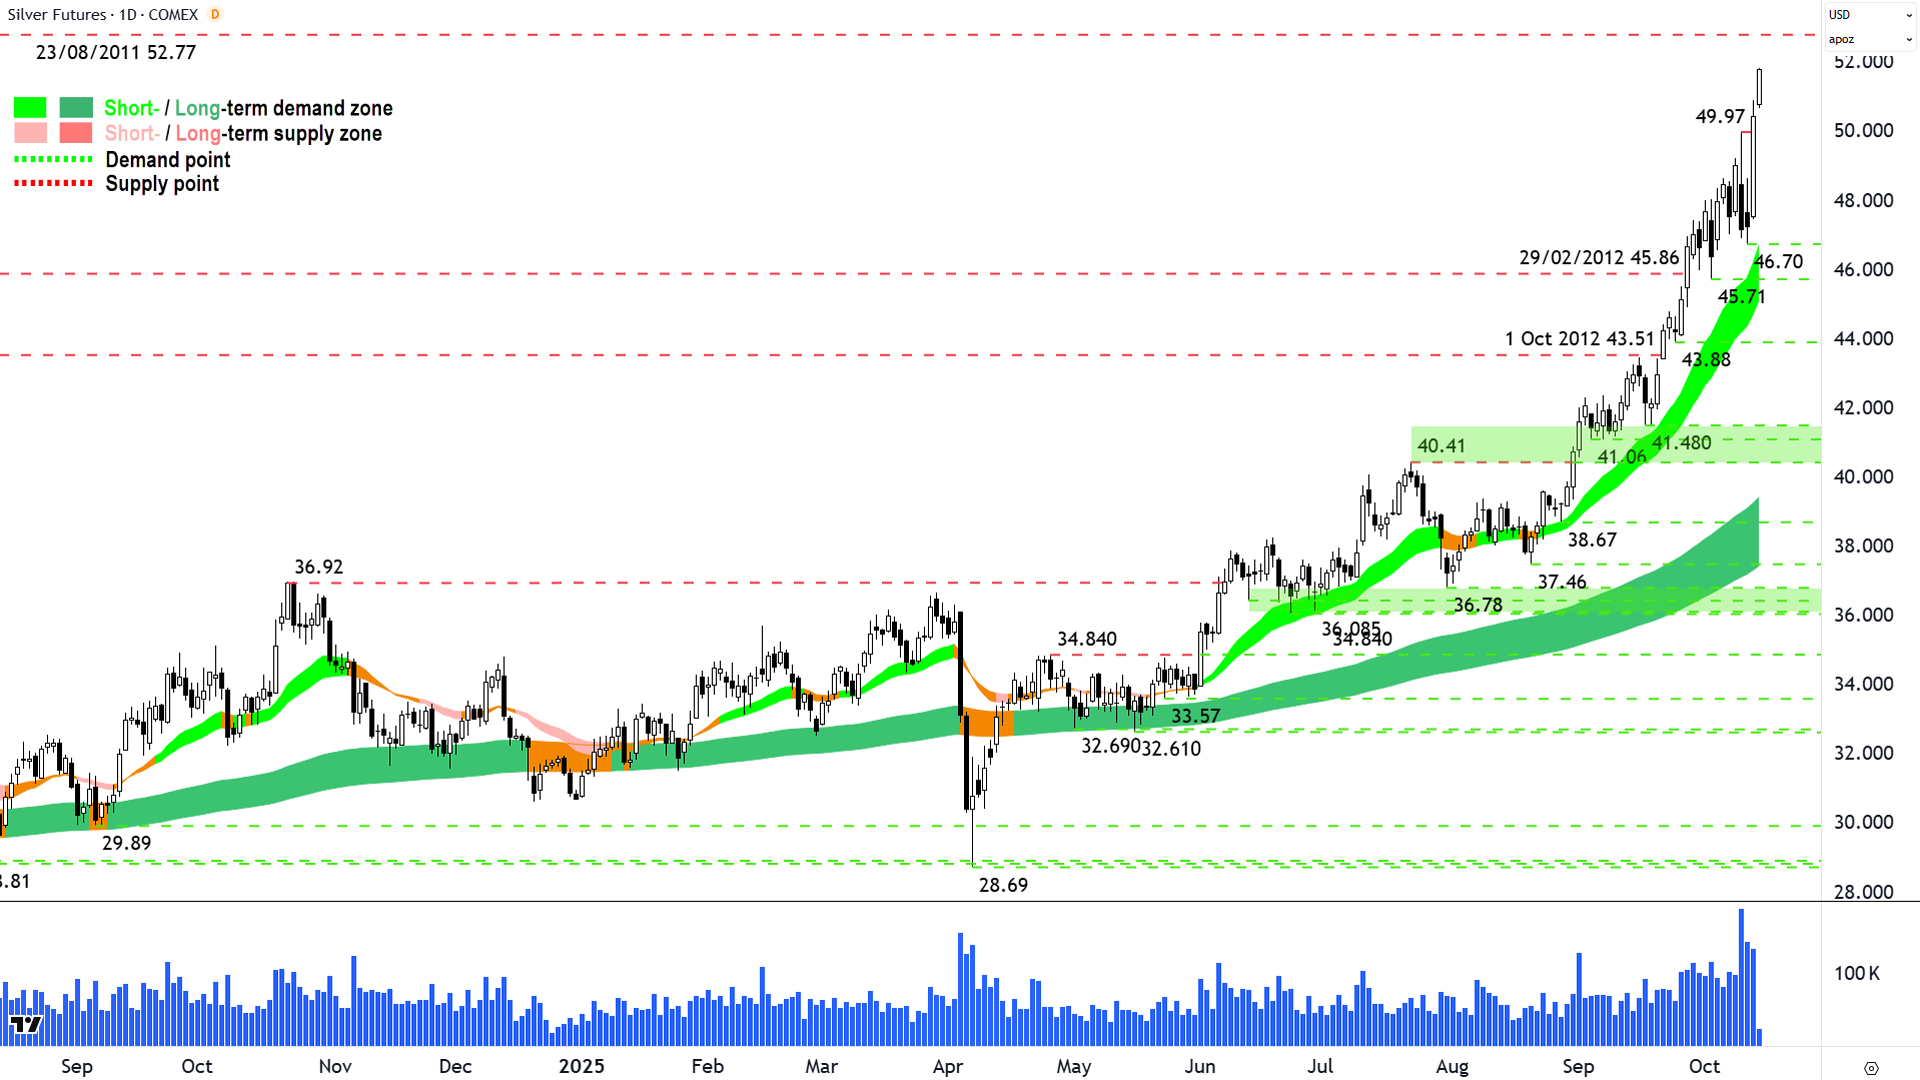
There’s not much I really need to add here, so let me go “ditto”: I like everything about this chart.
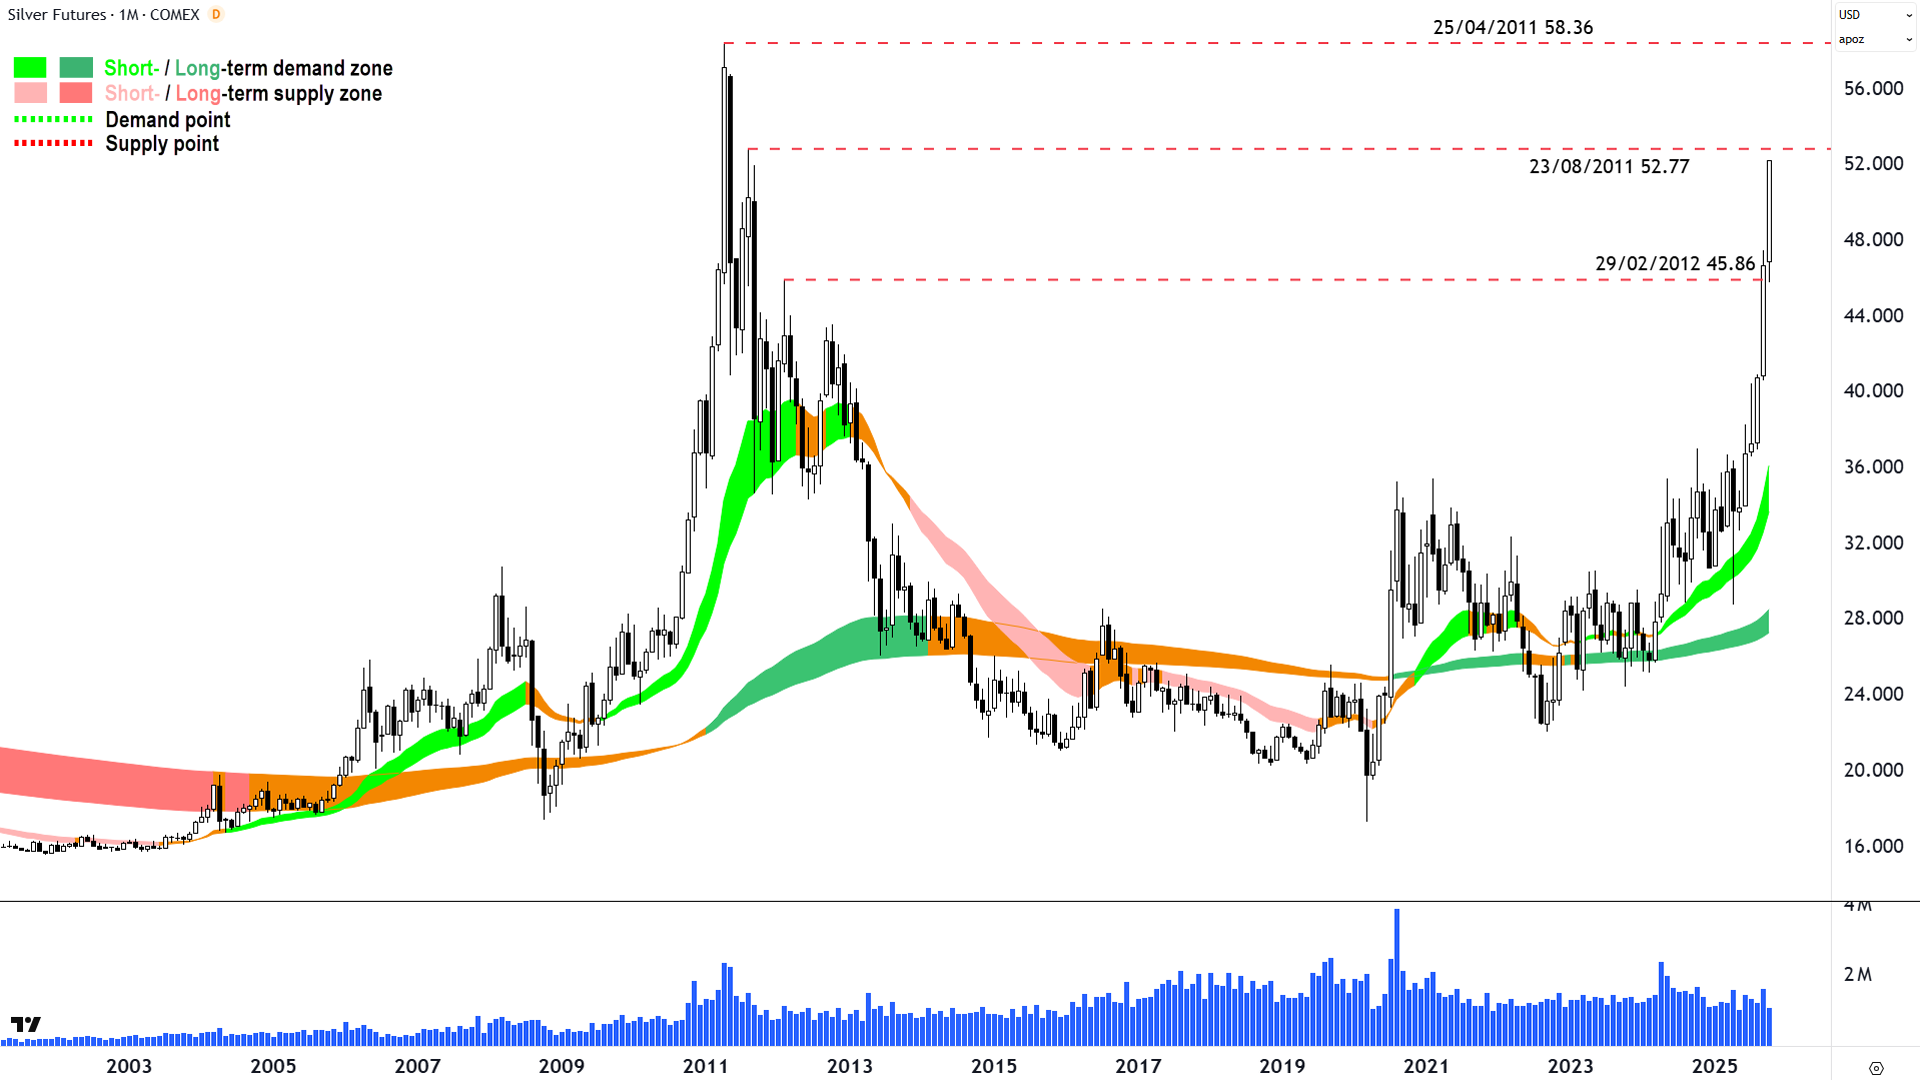
Oh! Just that 23 August 2011 major point of supply at 52.77. We're about to get a reader on just how much supply is lurking there. I suspect not a great deal – but the candles will tell us (demand-side candles = no supply vs supply-side candles = supply!).
You need to go out to the monthly chart below to see what's past that... 🧐
%20COMEX%20weekly%20chart_14%20Oct.png)
Silver Futures (Front month, back-adjusted) COMEX weekly chart (click here for full size image)
View: No change to prevailing FRP view on silver.
Key levels: 46.70 is the closest point of demand, the price should not close below here if the demand-side is in control of silver's price; alternatively, a close below the short term uptrend ribbon (presently 45.15-46.75) will also nullify the short term uptrend = ⚠️
ChartWatch *LIVE* Webinar
ChartWatch *LIVE* Webinars – WEEKLY Wednesday's @ 12pm AEDT
Learn more about technical analysis and trend following through real case studies on ASX stocks. Australia's premier technical analyst, Carl Capolingua, shares his unique insights on stocks as requested by viewers. Ask about a company in your portfolio or anything related to trading and investing and get Carl's expert opinion.
Places are limited so >REGISTER NOW!<
