ChartWatch Markets: Copper and lithium are shaping as the next big things as China's stock market begins to move
Technical analysis of the most important global stock indices, commodities, bonds, FX, and crypto impacting your ASX portfolio each day.


Source: Shutterstock
Mentioned
KEY POINTS
- The strength of the US stock market might be a surprise to some, what with all the risks and uncertainty swirling around global markets at the moment – but not for loyal readers of ChartWatch Markets!
- Lithium has been in a bear market for the better part of three years now, but the charts are finally point to light at the end of the tunnel. It’s so close to a new bull market as per Carl’s technical model – just one more box to tick!
- Copper has been more robust and ASX copper stocks like Sandfire Resources (SFR) have been flying. But there’s been a discrepancy between LME and COMEX copper that’s potentially been holding investors from fully committing – the stars appear to be aligning!
- Indeed, many other base metals, iron ore and other commodities prices are firming. We investigate what could be the driving force behind this resurgence, and indeed the recovery in ASX resources sector heavyweights BHP, RIO and FMG.
In today's edition of ChartWatch Markets, we'll be covering the technicals for:
Nasdaq Composite
Lithium Carbonate Futures (Benchmark month, back-adjusted) GFEX
High Grade Copper Futures (Front month, back-adjusted) COMEX
LME Copper Cash
SSE Composite (SSEC) (China)
Nasdaq Composite Index

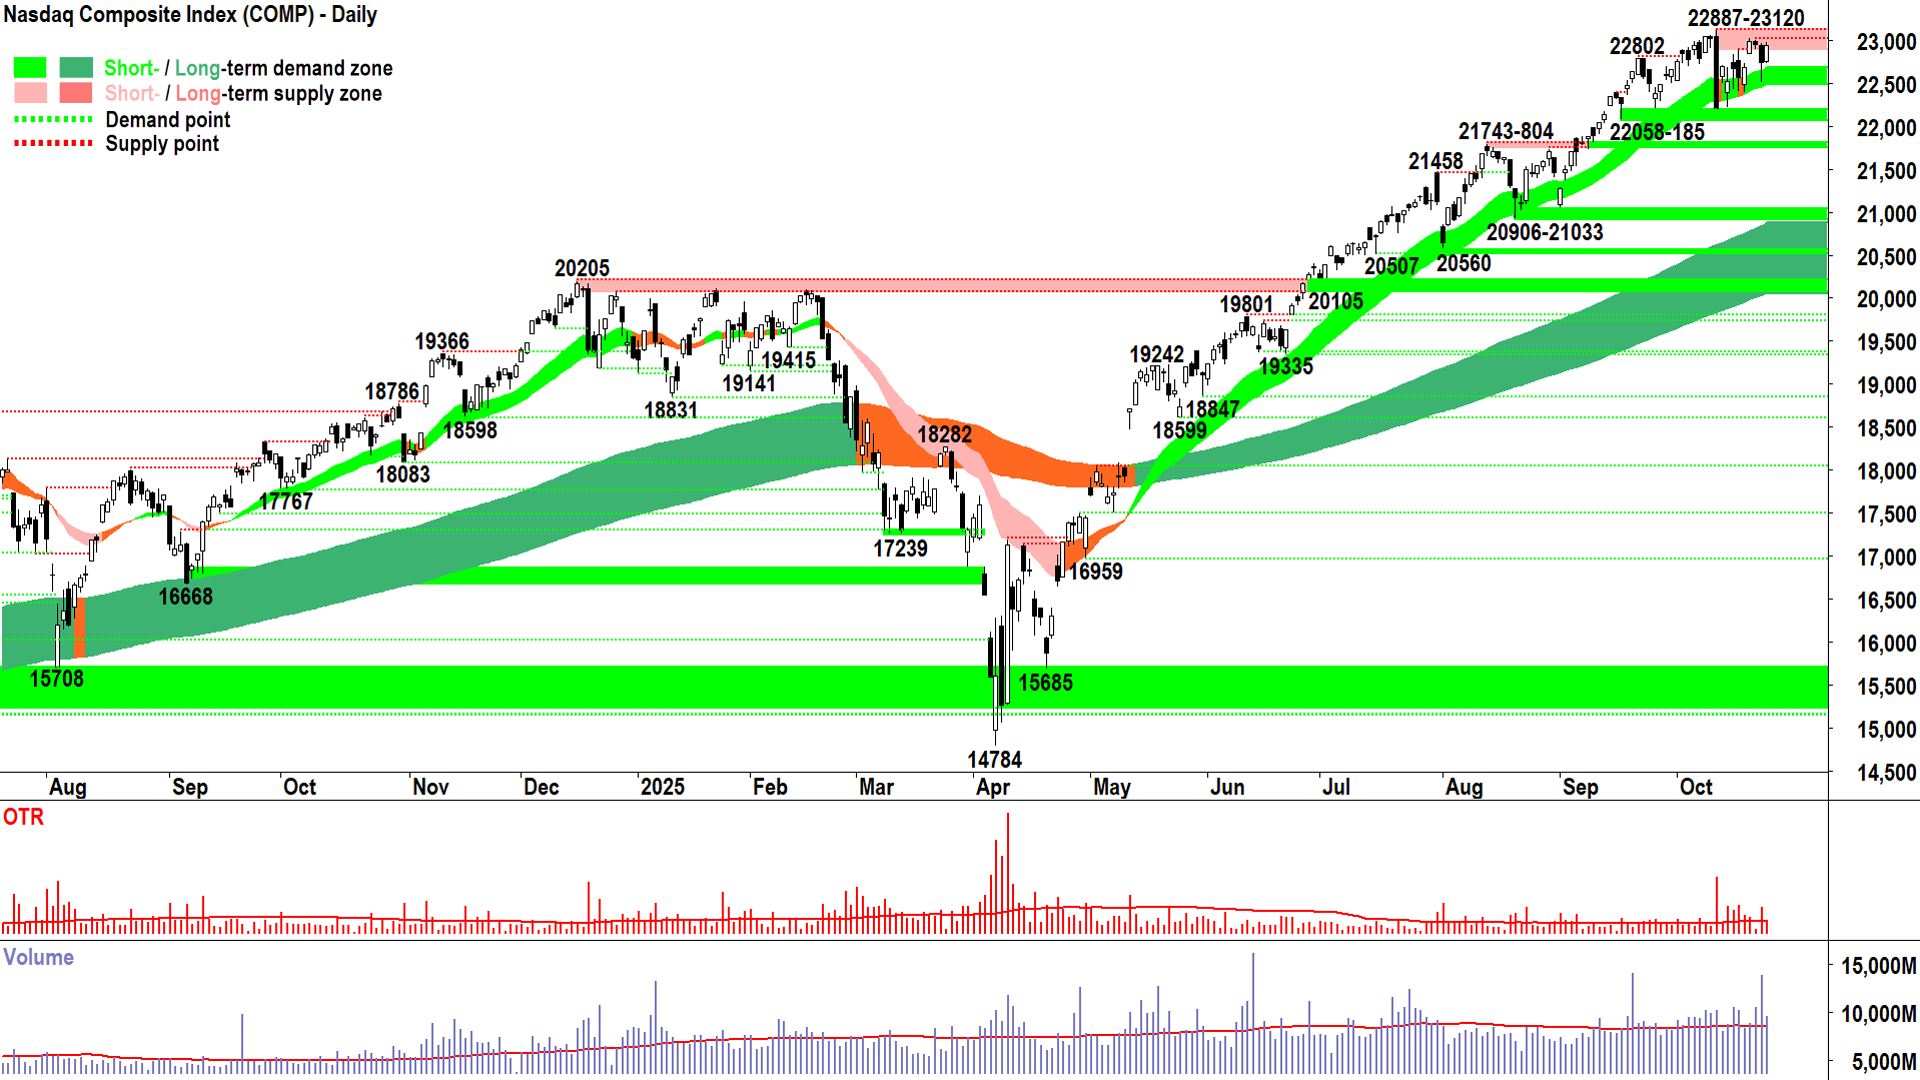
Nasdaq Composite Index chart (click here for full size image)
In yesterday’s update, we pondered Wednesday’s super (super, super) interesting indecision candle and accompanying above-average volume. 🤔
We concluded:
“In summary, the short term uptrend dodged a bullet on Wednesday. The demand-side continued to show their interest – but their performance was hardly emphatic.”
But also, given the broader demand-side market indicators (trend, price action, and broader candle picture), that:
“This means in my view, MOTN (More Often Than Not) the next candle, and the next, are likely to be demand-side in nature.”
It’s funny how stuff tends to work out sometimes (um, well, MOTN! 😉).
How good was Thursday’s candle!? Really – everything we would expect given the prevailing technicals. ✅
I bet you saw that candle this morning and just thought: “MEH! No surpises there!”. 😐
I hope you didn’t waste your time reading up on all the tooing and froing on US markets, you know – the big macro themes and small micro minutia of which company did this and that…
What. A. Bloody. Waste. Of. Time!
The candles tell all!
They’re the summation of all demand and all supply – they are how the universe of demand and supply voted by… ding ding ding ding 🔔 The close of trade on the NYSE at 4:30pm in New York.
The rest is fluff!
Anyways, Thursday’s modest, but full white bodied candle shows the demand-side simply picked up where they left off at Wednesday's close – hoovering up what the supply-side had on offer.
But look at that above average volume – there was a decent whack of demand consuming a decent whack of supply.
So, I propose the demand-side looks in solid form here. Logically, given Wednesday's price action and volume, we can assume that supply still motivated to sell around present levels just got a “decent whack” smaller. That's a good thing, because once the demand-side has chewed through this supply we should see a test of 23120.
But we are getting ahead of ourselves – we should never assume. The price action will tell us:
If the demand-side has pegged the supply willing to cut risk around here = long white body + close near the high of the session = 👍
If the supply-side has pegged the demand willing to add risk around here = long black body and or long upward pointing shadow + close near the low of the session =👎
We’ll get what we’re given and we’ll decide accordingly – after all, we only ever have 3 options to choose from:
+R (i.e., there is strong evidence of demand-side control)
=R (i.e., there is strong evidence of demand-side control and/or evidence supply-side control is lacking)
-R (i.e., there is strong evidence of supply-side control).
It’s an outcome-decision matrix, and it’s that simple – it always should be! 💪
Nothing else has changed in my opinion. All other key levels stay the same.
View: I remain FRP on my US holdings (Full Risk Position corresponds to a 100% allowable capital allocation limit for US stocks based on my personal risk management model).
Key levels: 22058 is the nearest critical point of demand, the price should not close below here if the demand-side is in control of the Comp's price; a close below the short term uptrend ribbon (presently 22485-22675) will nullify the short term uptrend = ⚠️
Lithium Carbonate Futures (Benchmark month, back-adjusted) GFEX

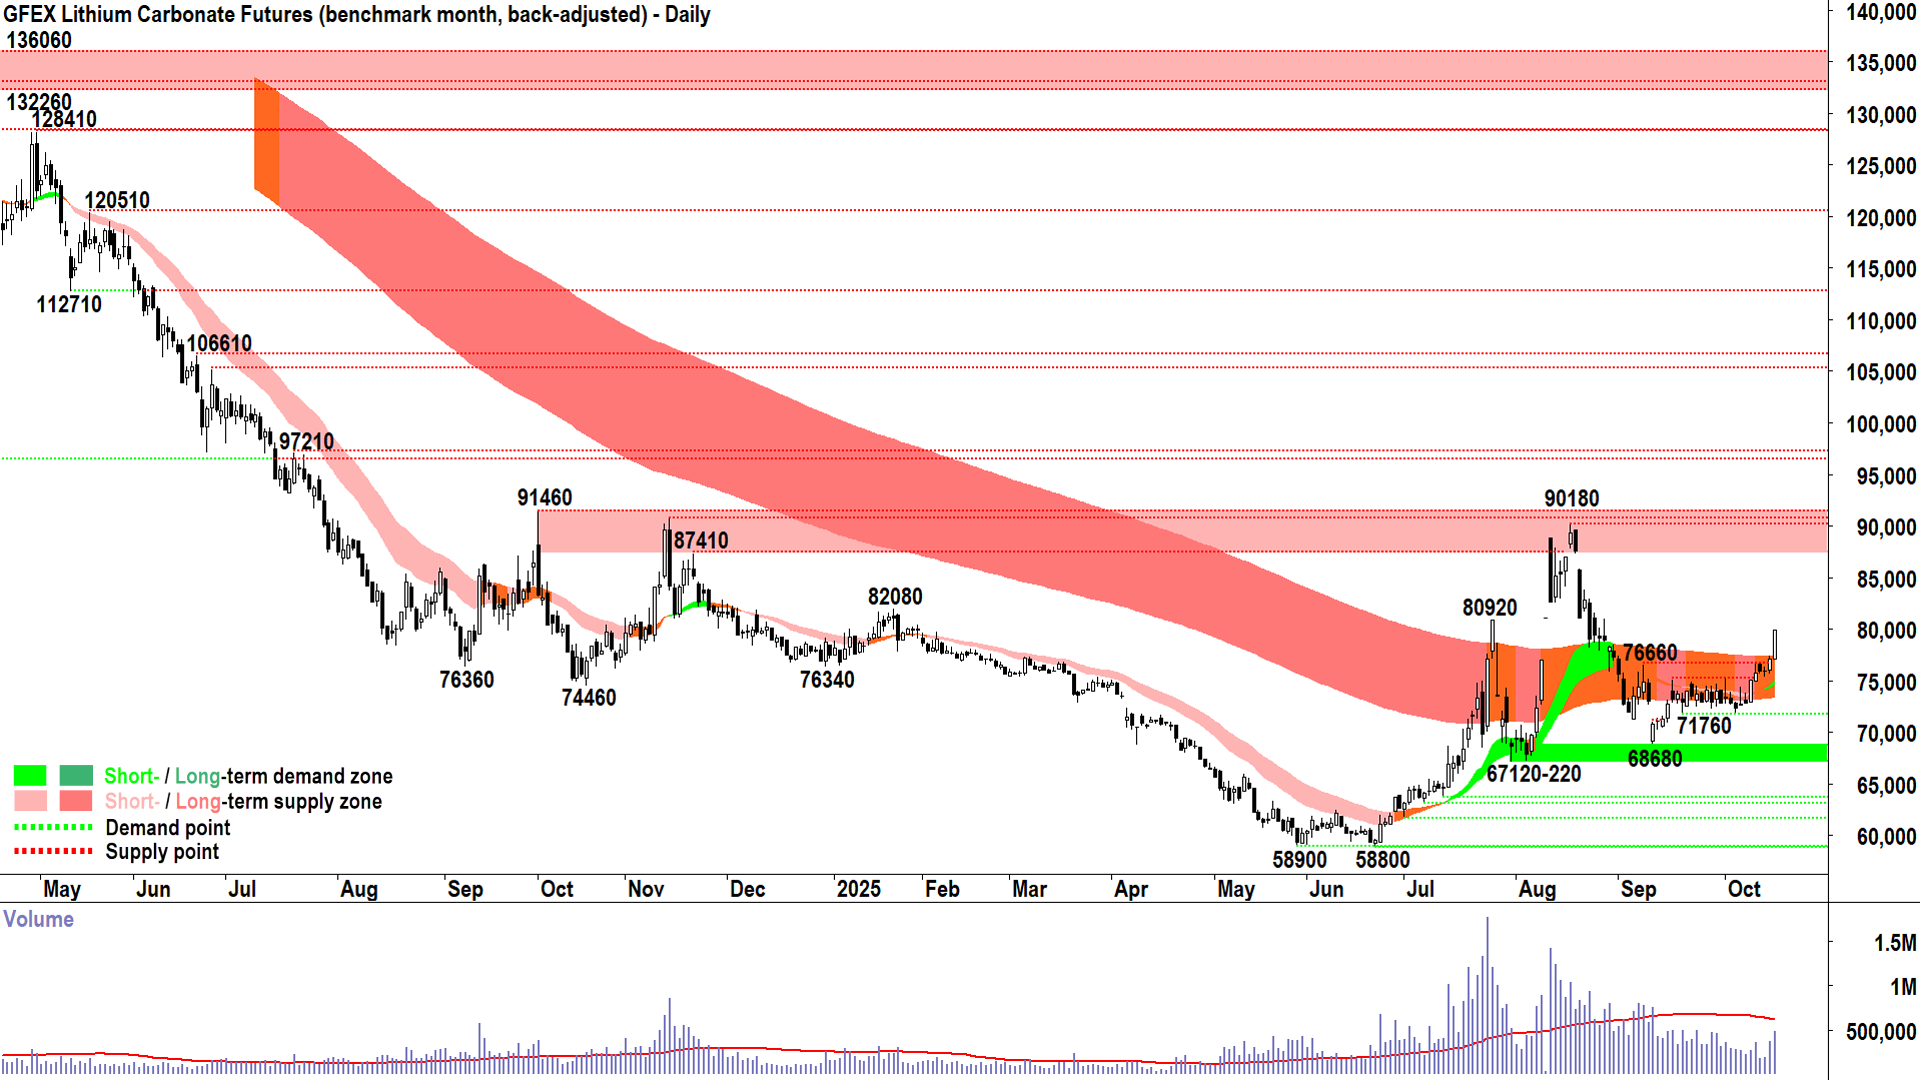
Lithium Carbonate Futures chart (click here for full size image)
I know I only did this one on Tuesday, where we noted increasing signs of growing demand-side control in both Lithium Carbonate and Aus Spot Spodumene – but there’s been some movement at the station!!! 🚂
If you’ve been tracking my daily lithium observations on X, you’ll know that we’ve seen a couple of very decent demand-side candles on Wednesday and Thursday.
Today’s candle is live, it’s not on the chart above – because it is meaningless to us until the close (FYI, roughly steady after a strong start 😉)!
If you’ve followed my stuff for long enough, you’ll know that I pretty much called the start of the lithium bear market late-22, early 2023… and because I’m a trend follower… kept calling it that way all the way down (what a fantastic downtrend!). You’ll likely also know that since August, the likes of ACDC, PLS, MIN, and LTR have begun appearing in the Uptrends Scan Lists of ChartWatch ASX Scans.
So, it might be of some interest to followers of this interesting commodity when I finally call the start of the next lithium bull market. 🍿
I’m 50-50 whether I call it today, or whether I wait for one pullback, test, and rebound off the long term trend ribbon. Remember my conditions for a “Turnaround Setup” (they're the same whether it’s a small-cap mining stock, BHP, or a commodity/index etc.!):
Consistent with demand-side control = ✅
Consistent with supply-side control = ⚠️
Short term trend: Uptrend (i.e., ST ribbon is green), widening (getting stronger), acting as a zone of dynamic excess demand = ✅
Price action: Rising peaks and rising troughs (i.e., supply removal and demand reinforcement) = ✅
Candles: Predominance of demand-side candles (i.e., white-bodied candles and or downward pointing shadows) = ✅
Long term trend: Neutral (amber) or up (dark green) (i.e., cannot be down / dark pink), if amber, narrowing (i.e., moving towards flip to up), acting as a zone of excess demand (i.e., at least one pullback, test, and rebound off the long term trend ribbon). ❌
For me, +R, =R, or -R comes down to checking boxes in a checklist (but what about the Fed Carl, what about Trump, what about the P/E Ratio, management, results…??? NOPE!).
My logic is this: ✅✅✅✅ = I’m confident the demand-side is now in control of the short and long term price of the asset in question = +R.
I think we can safely say with ✅✅✅❌ that GFEX lithium carbonate is on the right track (Aus Spot Spod is already there). All I need is that "at least one pullback, test, and rebound off the long term trend ribbon" item...
So, am I going to call the new bull market in lithium before that final ❌ becomes a ✅?
Hey, the lithium bull market has been intact for nearly 3 years now... What’s the hurry? 😎
High Grade Copper Futures (Front month, back-adjusted) COMEX
%20COMEX%20chart_24%20Oct.png)
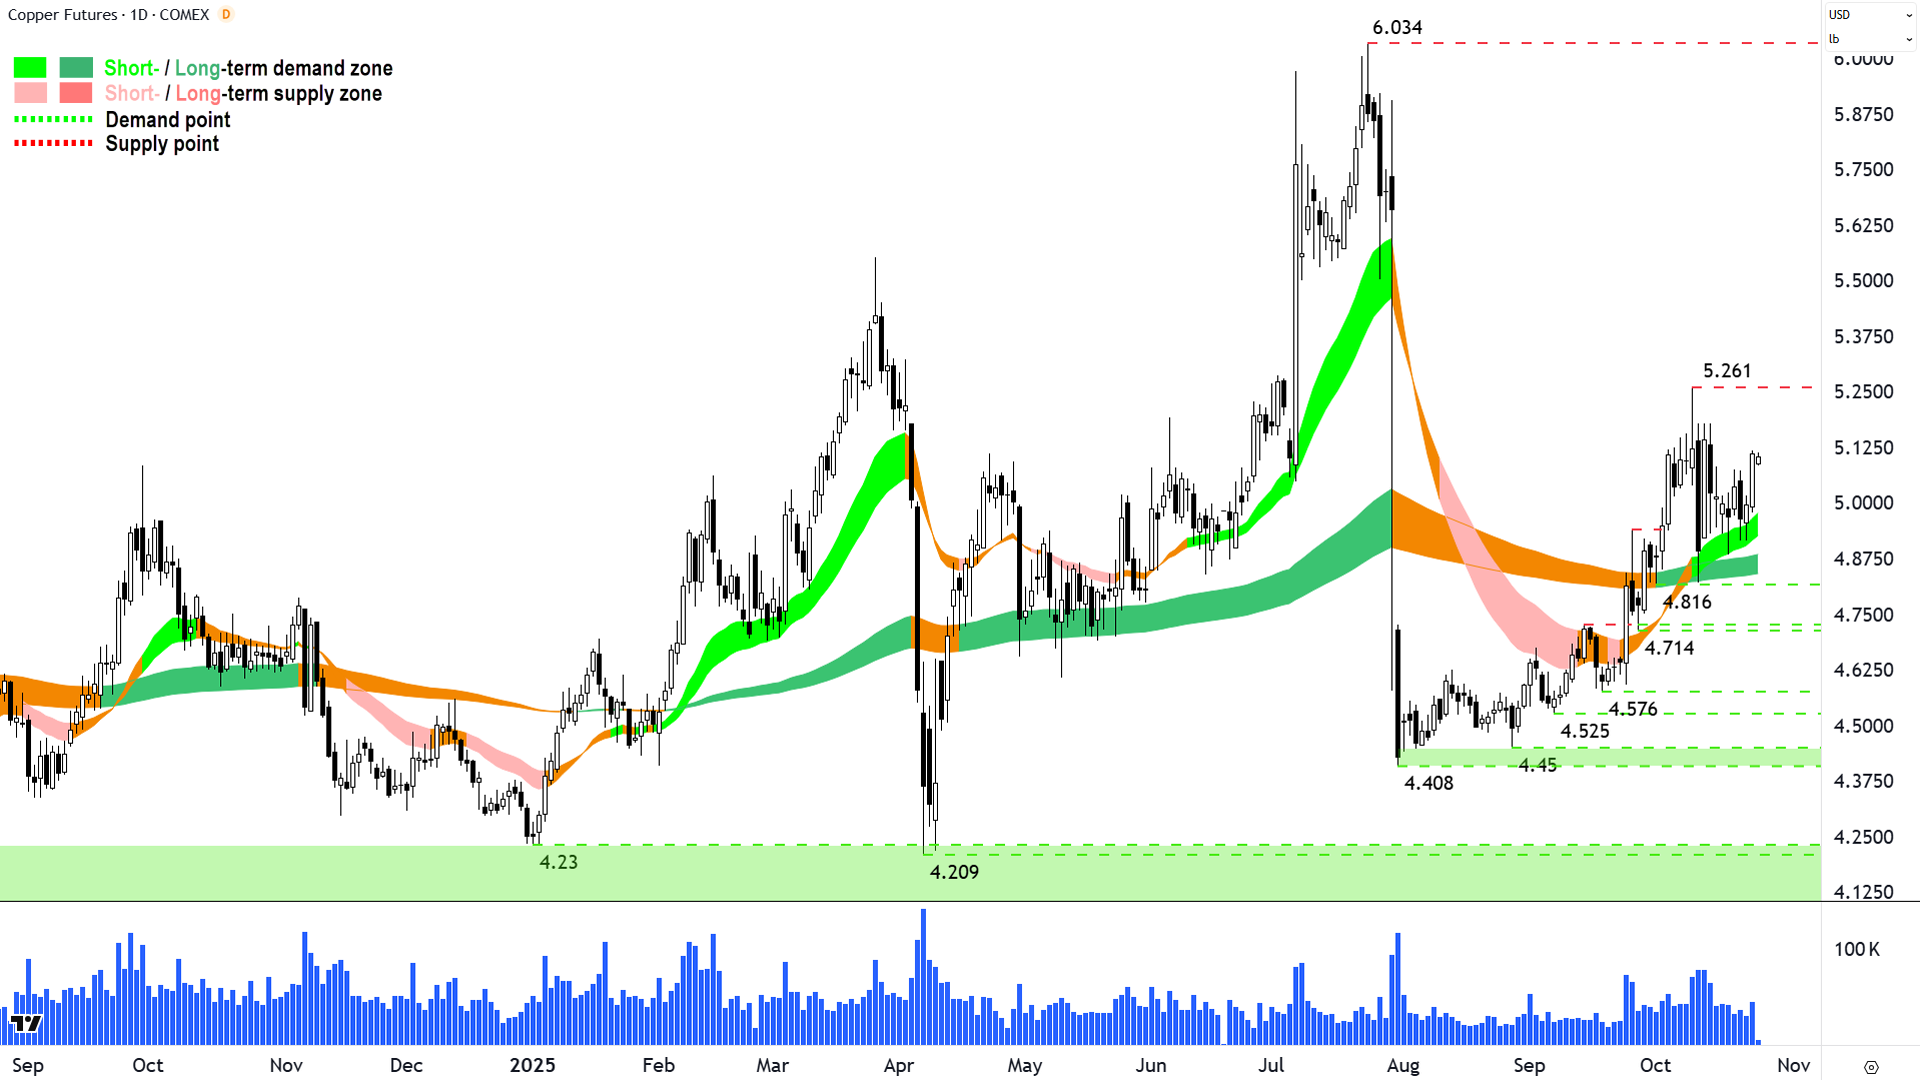
High Grade Copper Futures (click here for full size image)
Super interesting how COMEX copper has flip-flopped while its LME counterpart, below, has just kept chugging along. Interesting, but not surprising given one is beholden to the comments of an individual who tends to say something not-very-ideal for US copper markets... only then to distance themselves from those comments shortly thereafter 🤦.

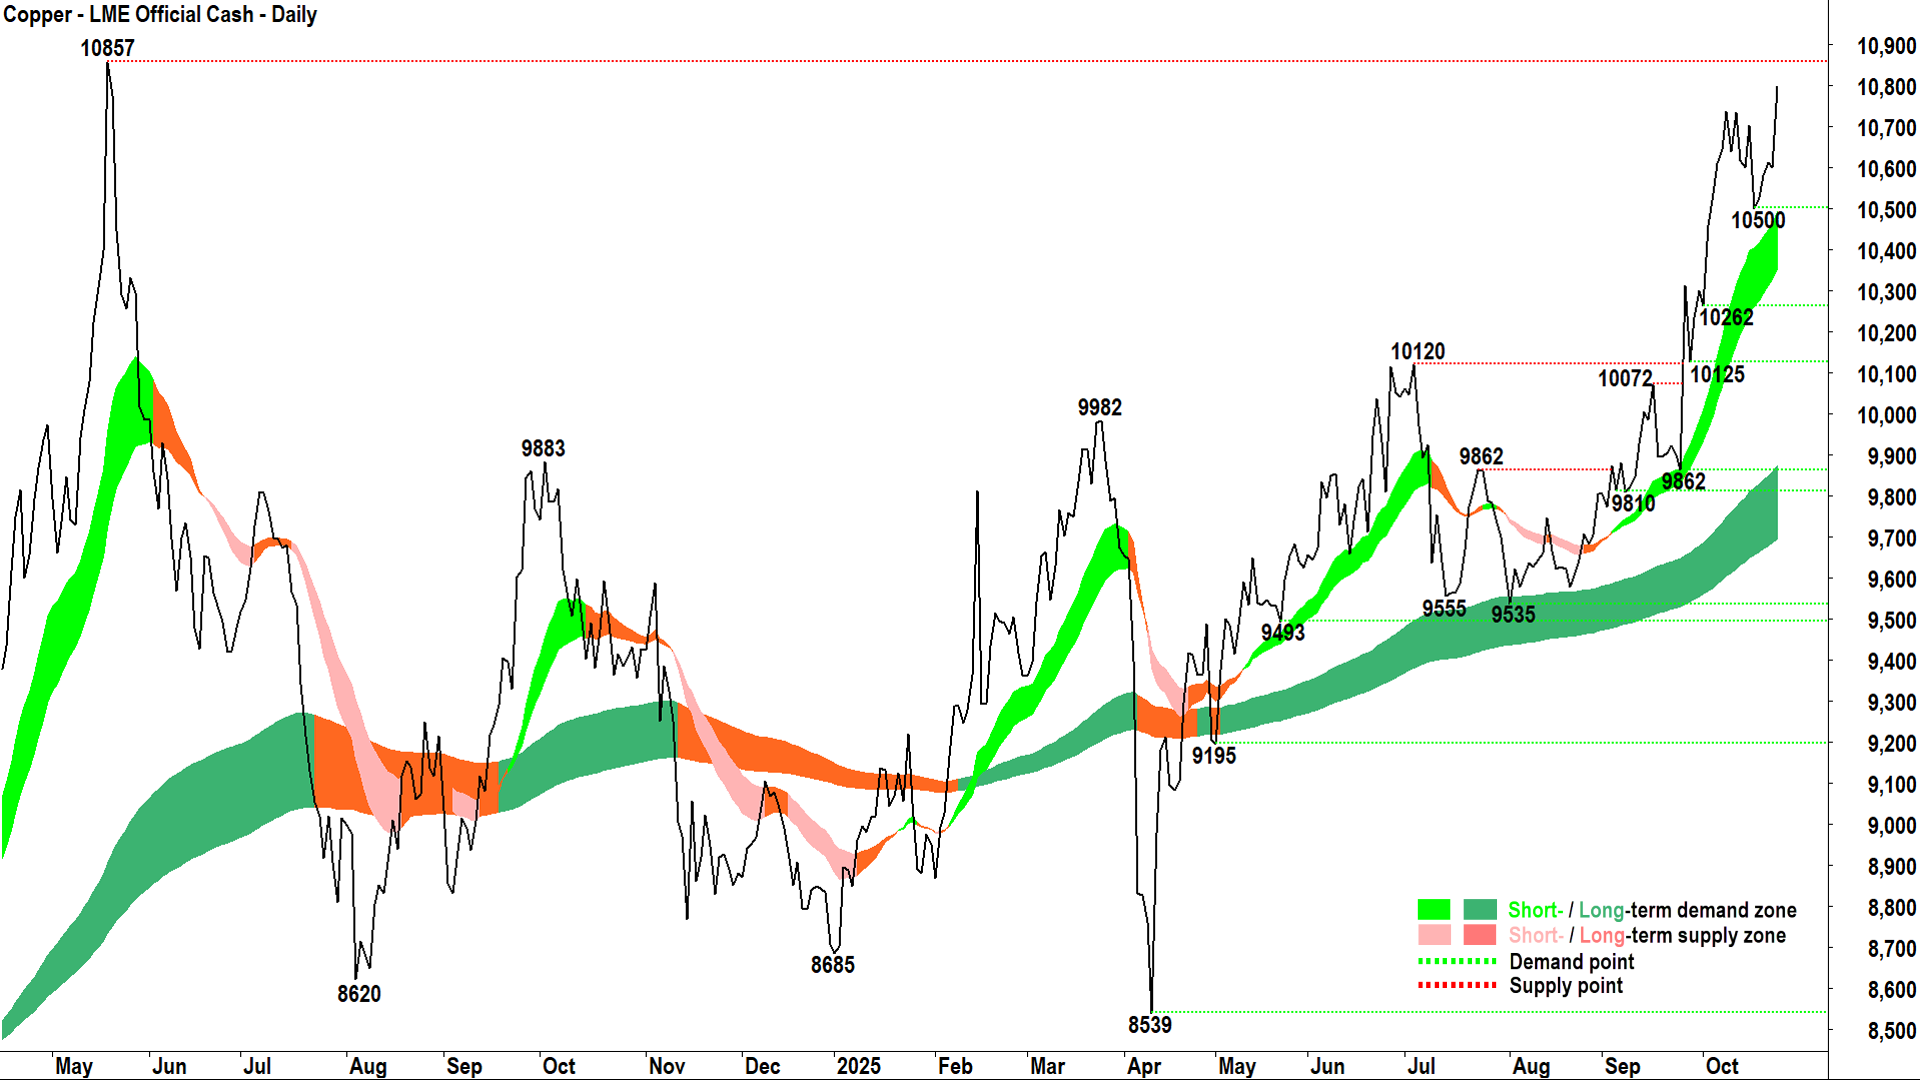
LME Copper Cash (click here for full size image)
But, coordinated growth across the Atlantic in copper prices is better than not, and Thursday's strong demand-side candle appears to have again re-aligned the two coppers.
For high grade, that candle confirms the short term uptrend, adds another trough above the long term uptrend (remember the final piece of the lithium puzzle?), and reverts the price action back to rising peaks and rising troughs.
5.261 is the next, obvious point of supply. I propose a close above that and copper can move higher relatively faster rate (FOMO among demand-side and wait for more among the supply-side).
4.816 is the go-no-go point for the new high grade bull market, but a close below the short term uptrend ribbon would provide an earlier warning signal.
For LME, I note very solid trends and price action, with really just 10857 in the way now. As in – that's the all time high – it's all blue sky from there! 🪂
Happy to stay the course here on copper (both of them!).
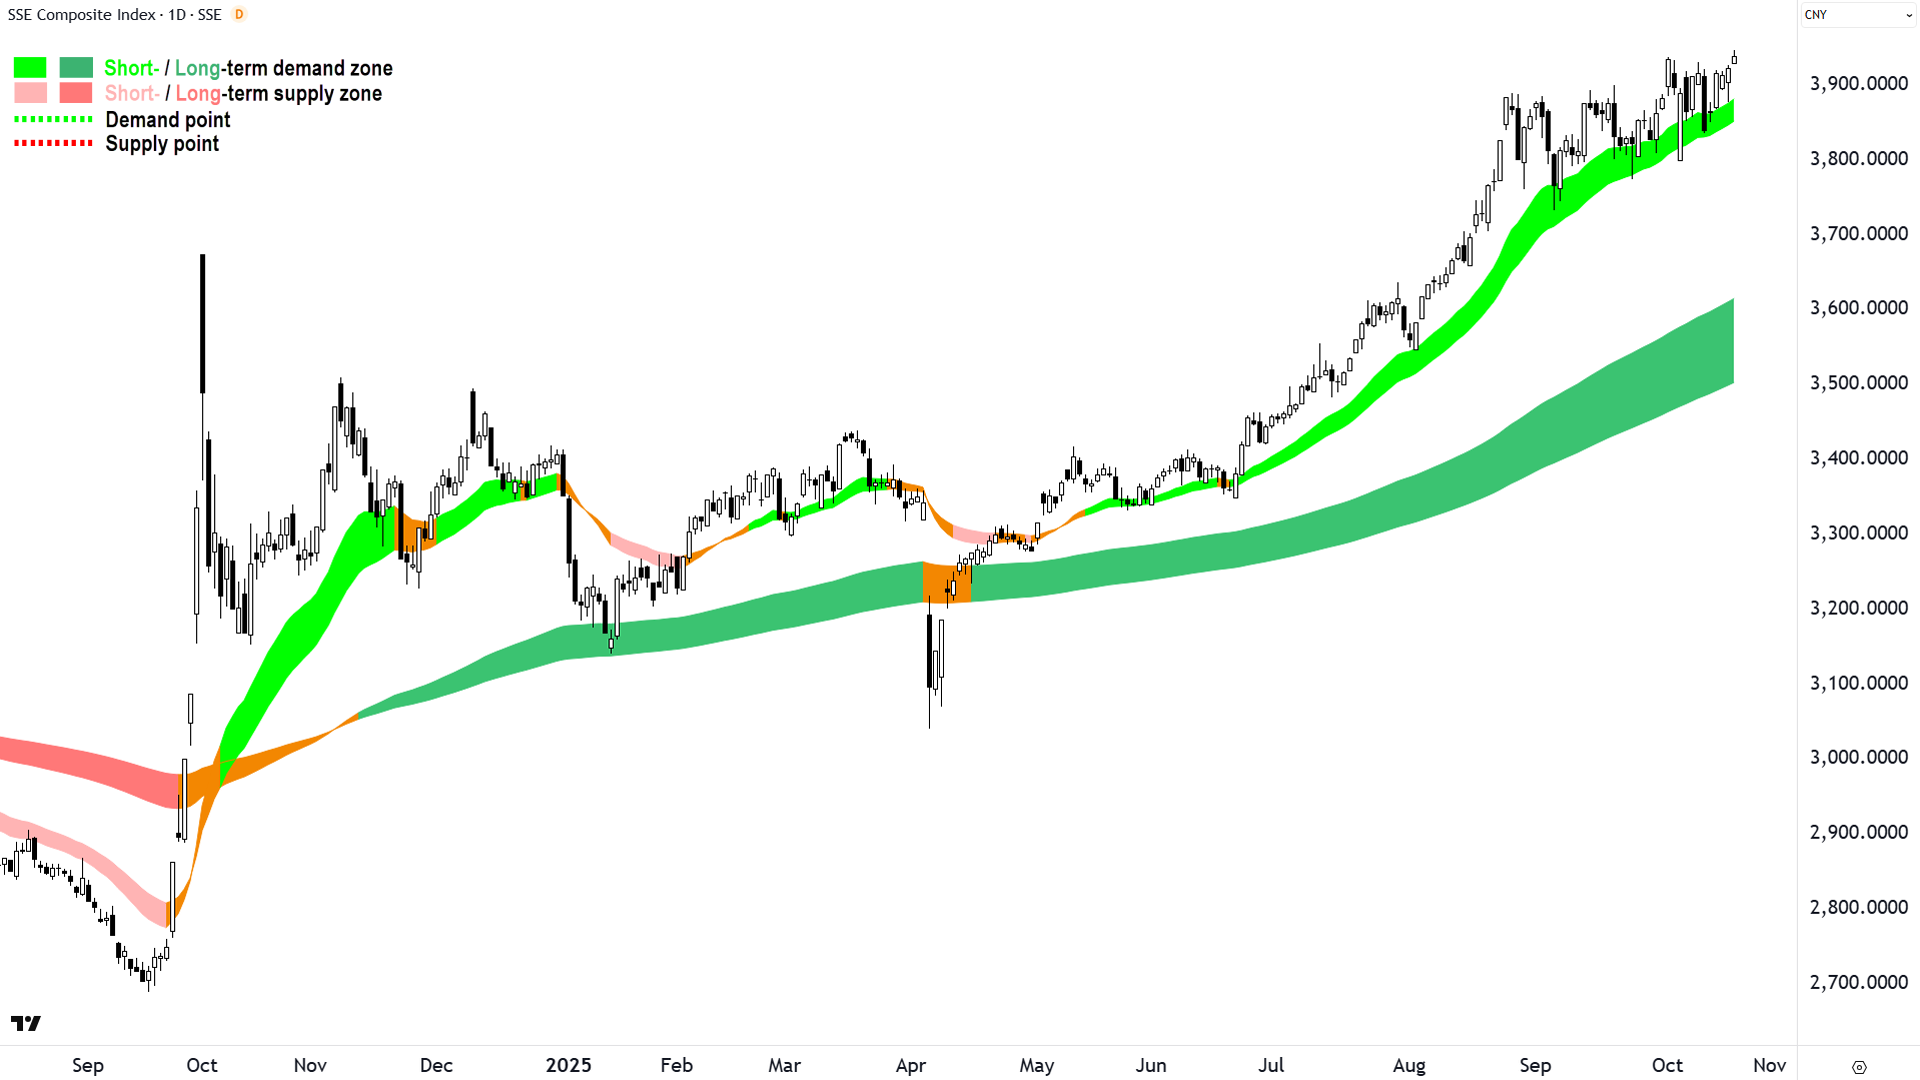
SSE Composite (SSEC) (China)
%20(China)%20chart_23%20Oct.png)
SSE Composite (SSEC) (China) chart (click here for full size image)
Super quicky here... just to point out that this one keeps simmering (I flagged this way back in August as potentially driving a commodities revival... and what do you know!?).
In previous editions, we've noted coordinated growth among copper as per above, iron ore, and several other base metals. I gave you PLENTY of warning here about how this chart could translate into a Resources sector revival... and low and behold, we're now seeing our big resources stocks like BHP, RIO, FMG starting to move... and make regular appearances in the Uptrends Scan Lists of ChartWatch ASX Scans.
It still looks intact, and it's a chart worth keeping an eye on to check if the tailwinds I flagged back in August continue to blow in the right direction 💨!
ChartWatch *LIVE* Webinar
ChartWatch *LIVE* Webinars – WEEKLY Wednesday's @ 12pm AEDT
Learn more about technical analysis and trend following through real case studies on ASX stocks. Australia's premier technical analyst, Carl Capolingua, shares his unique insights on stocks as requested by viewers. Ask about a company in your portfolio or anything related to trading and investing and get Carl's expert opinion.
Places are limited so >REGISTER NOW!<
