US-Iran movers, explorers vs. developers and Samsung's 19-fold profit jump
Hi there!
Another whacky week for markets, this one featuring a four-day losing streak partly driven by Trump saying the interim peace deal signed with Iran was: "To me, I think it's over. I don't want to deal with them." (Cue the bombs, drones and mines)
And look, I know we posted that data about July being historically the second-best month on average for the ASX, but seasonality doesn't count for much when there's a hurricane rolling through.
But zoom out and what's the market done all year? Chopped around, a massive rip followed by an equally massive dip, back to a one-month high, then a re-test of the lows. All over the place (and we all breathe a sigh of relief after the solid bounce on Friday).
Let's dive in.
Investor sentiment survey
.png)
The week ended 5 July was a quiet, near-textbook-average week, where bulls landed exactly on its 1-year average.
After June's fear-to-optimism round trip, sentiment has flattened into tight chop around zero, with bulls and bears both clustered near their long-run averages. I guess there isn't much conviction for both directions.
Over the next three months, do you expect the Australian stock market to be:
The stocks that ran on the US-Iran conflict
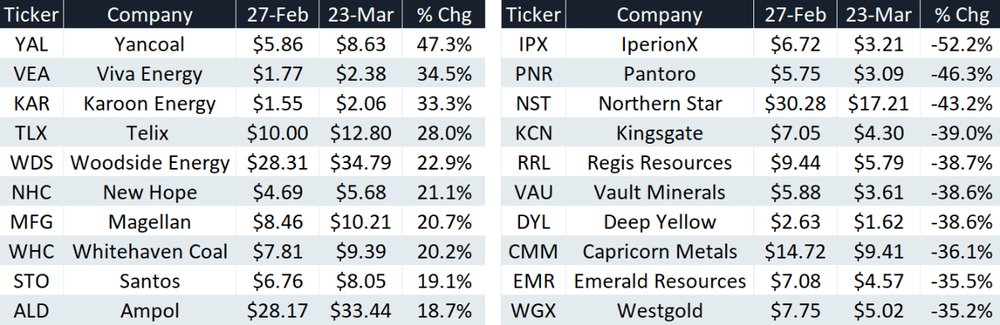
When the US-Iran war broke out, the ASX 200 fell in pretty much a straight line, down 9% between 27 Feb and 23 March.
During this time:
Energy rallied 6% from the get-go but grinded higher, up 16.1% by 23 March
Staples and Telcos traded fractionally lower
Financials fell 5.4% by the end, so still a small relative outperformance
Discretionary, Industrials, Tech and Real Estate all fell 10-12%, so broadly in-line with the index
Materials tumbled 21%, pretty much trended lower the whole time
I've ranked the best and worst performing large caps above.
Just something to be mindful of, though the starting point is very different this time. Energy stocks have rebased higher, staples have rallied strongly in recent weeks and miners have been battered.
Exploring vs. developing
A big drill hit can send an explorer's share price soaring on the day, and keep it running for weeks or months. But as a company moves through the more 'key' milestones like feasibility studies, a final investment decision or the start of construction, the share price often struggles.
The challenge for explorers and developers, especially while pre-production and pre-revenue, is that working through these milestones doesn't really change anything. You're not adding tonnes to the resource. The project might be getting built, but the market doesn't see it.
Plenty of epic gold explorers that turned producers in recent years have struggled for upside, or worse, faced reasonable operational challenges that have tanked the share price. Think names like Black Cat Syndicate, Ora Banda Mining and Catalyst Metals.
Minerals 260 is another example this week, where its PFS for the Bullabulling Gold Project outlined some big numbers.
Net present value of $2.3bn
2-year payback period
Average annual free cash flow of $330m and EBITDA of $510m
Production of 150,000oz Au per annum from a 5 Mtpa processing plant at an AISC of A$2,520/oz
19-year operating life and commencing production from 4Q28
Total capex of $855m (pre-FID, pre-prod operations and construction capital)
Funded with existing cash reserves
The stock tanked 21% between 8-9 July, as analysts worried about the capital intensity relative to prior expectations. Still, the street was bullish on the project's industry-average operating costs, supported by favourable geology and a low life of mine strip ratio. The DFS expected in Q1 2027 is the next major catalyst, with room for substantial upgrades from additional drilling and engineering optimisation.
Now don't get me wrong, it looks like a strong project with solid economics. But moving towards a final investment decision and eventual build, that's a different beast.
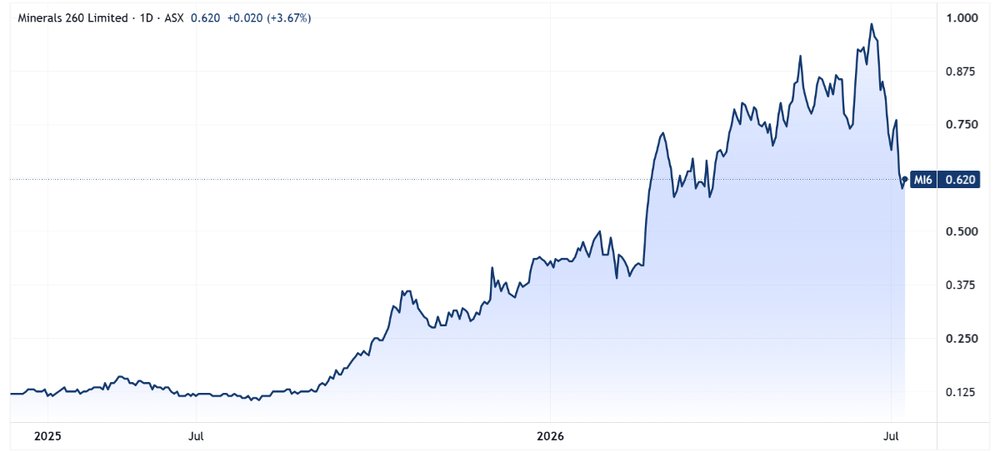
Minerals 260 acquired Bullabulling in April last year, and the stock has since run from around 12 cents to as high as $1.00 on 22-23 June.
The world’s most profitable company
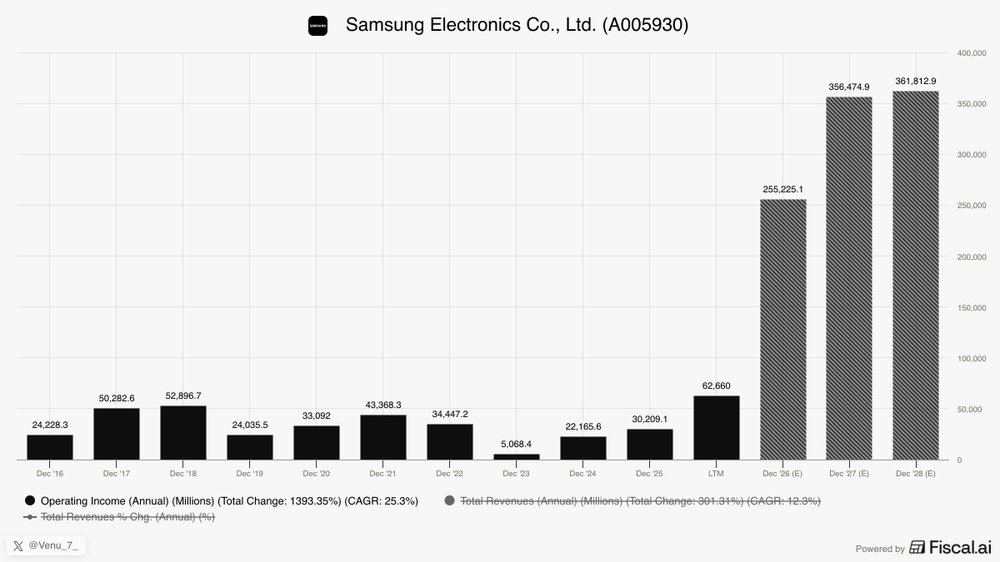
How gangbusters is the semiconductor industry right now? Samsung's chip division is set to make more operating profit in 2026 than in its entire 40-year history in the industry combined. That means 2026 will beat the cumulative operating profit from 1985 to 2025.
They reported 89.4 trillion won (US$58.4bn) in the Apr-Jun quarter vs. 4.7 trillion won a year ago, hence the 19-fold jump.
The driver is the most boring part of the AI stack: Memory.
Everyone is dog piling into building AI right now, and Samsung is one of the few places you can actually buy the memory to do it. Against this backdrop they're flexing some serious pricing power and AI players are just paying for it.
DRAM prices climbed more than 40% quarter-on-quarter and NAND rose more than 50%, and because memory already carries ~80 per cent operating margins, so those price hikes go straight to the bottom line.
Now the funny thing is, we all know Samsung for their electronics and phones. To manufacture this quarter's profit through phones alone you'd need to sell around 1.7 billion of them in three months (assuming typical mobile operating margins of 10-11%). Samsung ships about 220 million a year, in a global smartphone industry that makes 1.2 billion units.
So Samsung would need to sell more phones in one quarter than every manufacturer on earth sells in a year, and it still wouldn't get there.
Picks and shovels my friends, picks and shovels.
Last laughs
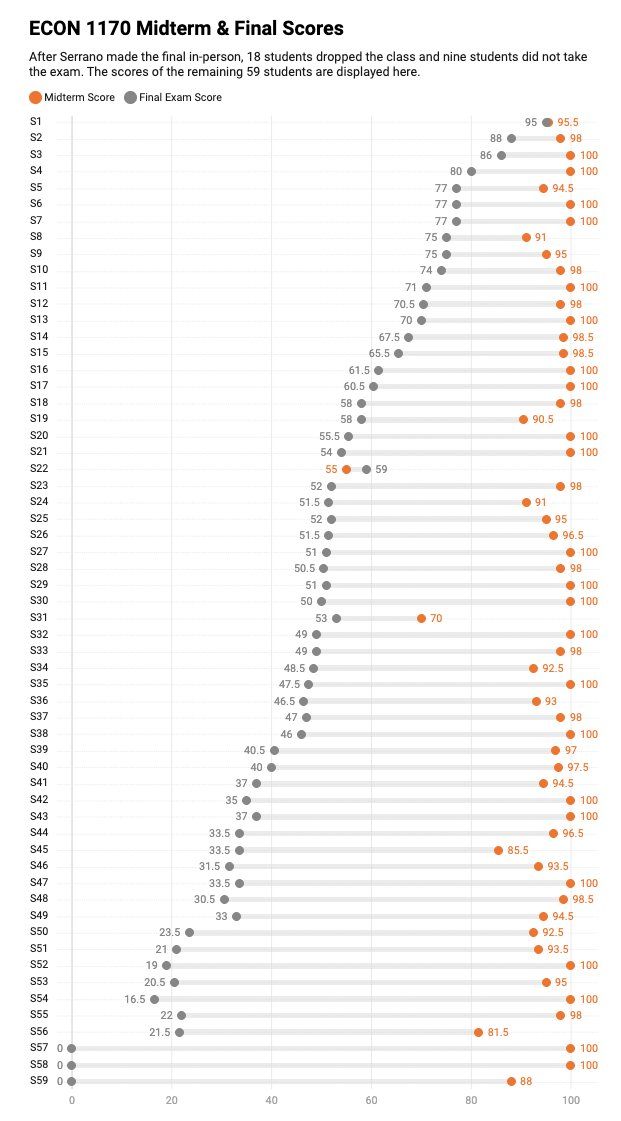
A Brown University economics professor gave his students a take-home midterm, and the average score came in at a whopping 96%. The answers also had a strong AI flavour to them, so he made the final exam sit in person. The average came in at 48.6%.
The orange dots are the take-home scores, the grey dots are the final scores.
Spot the one fella who's absolutely locked in.