July seasonality, falling home prices and a margin squeeze
Hi there!
What a wacky week. Capital kept rotating into Healthcare, Staples and Discretionary stocks, with the S&P/ASX Healthcare Index now up around 20% since 3 June, bouncing off a near-decade low, in a move that's probably caught most people by surprise.
Corporate newsflow is starting to pick up as we head towards August reporting season, and some eyebrow-raising stuff is already surfacing:
Autosports (ASG) noted EV sales up 15% year-on-year in March, rising to in excess of 40% in April. Clearly a big shift in customer preference after the oil spike.
Collins Food (CKF) said their second-half Australian margins fell 100 bps because of a delivery fee structure change (from $8.95 to $3.95 across aggregators). Who knew delivery could move the needle that much?in such way?
Anyway, we've got a fairly data-rich Weekender on our hands, so let's dive in.
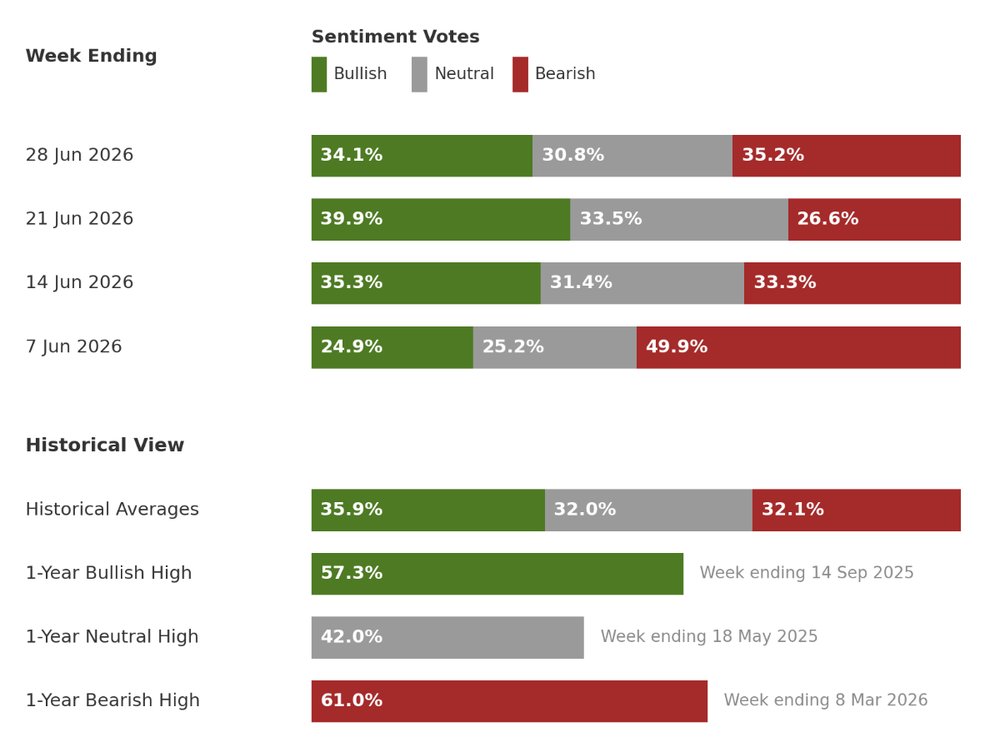
Investor sentiment survey
Hello July
.xlsx%20-%20Excel.png)
July is an under-the-radar month for global equities, historically delivering the second-best average monthly returns for both the S&P 500 and the ASX 200.
Since 1980, the S&P/ASX 200 has averaged a 2.13% gain in July, finishing higher 72% of the time.
Since 2001, the S&P/ASX 200 Total Return index has averaged a 1.69% gain in July, also higher 72% of the time.
Since 2015, the S&P 500 has gained an average 3.37% in July and finished positive every single year.
Checking in on Elanor
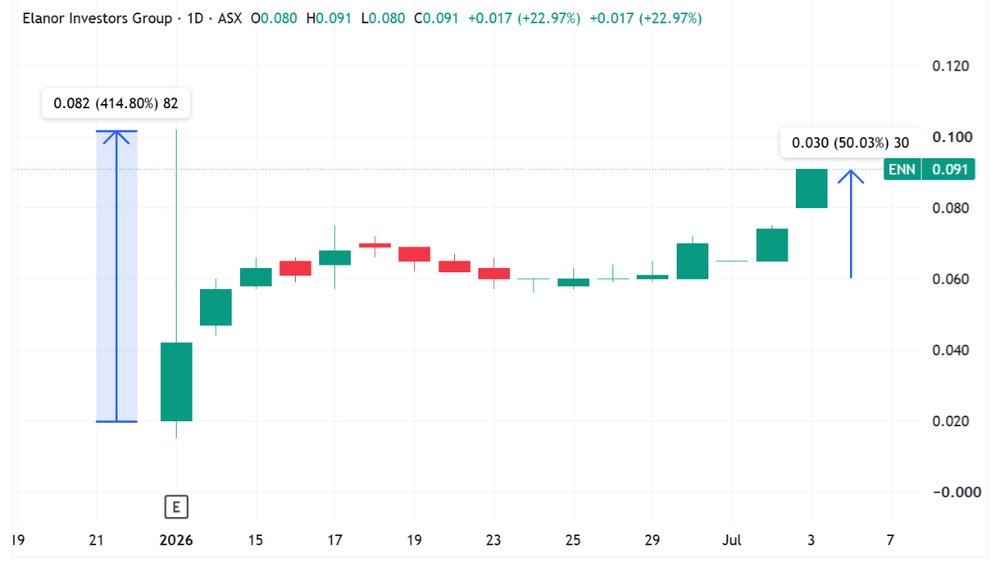
About a month ago, the Weekender flagged an otherworldly swing in Elanor Investors Group.
The stock exited a 22-month low suspension to fix its crippled business (operating losses, gearing as high as 80%, a high-cost short-term bridging loan, FUM roughly halved). A $125 million Rockworth-led recapitalisation reset the equity but wiped out most existing shareholder value.
So when trading resumed on 11 June, the stock opened 97.5% lower at 2 cents, then ripped as much as 410% intraday to a brief high of 10 cents. The rally was actually fairly rational as post-recapitalisation, Elanor still carried an NTA of 30 cents per share, meaning it effectively opened at a 93% discount to NTA.
After a quiet couple of sessions in late June, it rallied another 50% this week to around 9 cents.
The housing market downturn deepens
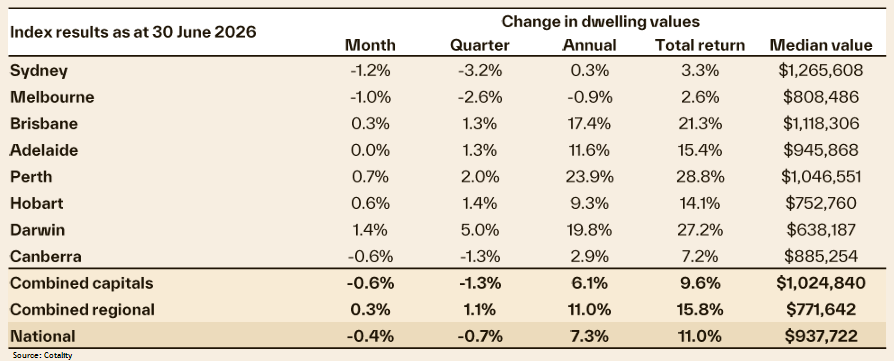
If there's one piece of research you had to have a whiz through, it's Cotality's June Housing report, released on Wednesday.
The key numbers:
Cotality's national Home Value Index (HVI) dropped 0.4% in June - the largest month-on-month fall since December 2022.
Sydney and Melbourne home values fell 1.2% and 1.0% respectively for the month, while Darwin (+1.4%), Perth (+0.7%) and Hobart (+0.6%) edged higher.
Capital city values fell 1.3% over the quarter, with Sydney and Melbourne leading the declines, down 3.2% and 2.6% respectively.
Advertised supply across the capitals remains in line with the five-year average (-0.1%) but is almost 11% higher than a year ago.
The combined capital cities auction clearance rate has held below 50% since the last week of May, dropping to a low of ~40% by late June.
My favourite comments from Cotality’s research director Tim Lawless:
“Such low clearance rates indicate a mismatch between buyer and seller pricing expectations. Buyers now have more stock to choose from and less urgency in their decision-making.”
“Higher listings aren’t due to a pick-up in the flow of new listings; it’s a symptom of less demand in the market, which has led to an accumulation of advertised stock.”
You can check out the full report here.
Oil has peaked, but more inflation to come?
We're all driving past the servos now thinking "wow, fuel's come down a lot," then walking through the grocery aisles thinking "did prices just take another leg up?"
While fuel-related products are the first to rise and fall, inflation everywhere else tends to take a long, long time to ease (if it eases at all).
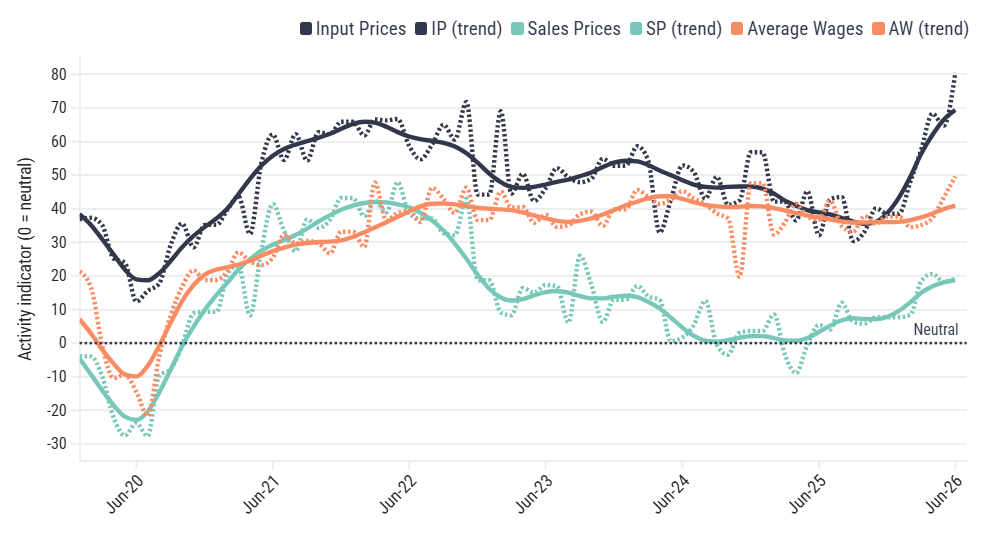
A fairly under-the-radar data point on this comes from the Australian Industry Group, which publishes a monthly index tracking activity across Australia's industrial sectors. You can find the latest report here.
What I found most interesting was the data on prices:
All pricing indicators moved higher in June. Input prices remain elevated, climbing 15.8 points to 80.5.
Sales prices edged up to 19.2, suggesting weak pricing power and limited ability to pass on costs amid soft demand.
The 61.3-point gap between input costs and sales prices is the widest on record, pointing to the most pressure on profit margins in the series' history.
So the real question is: who suffers from here - companies or consumers?
Last laughs
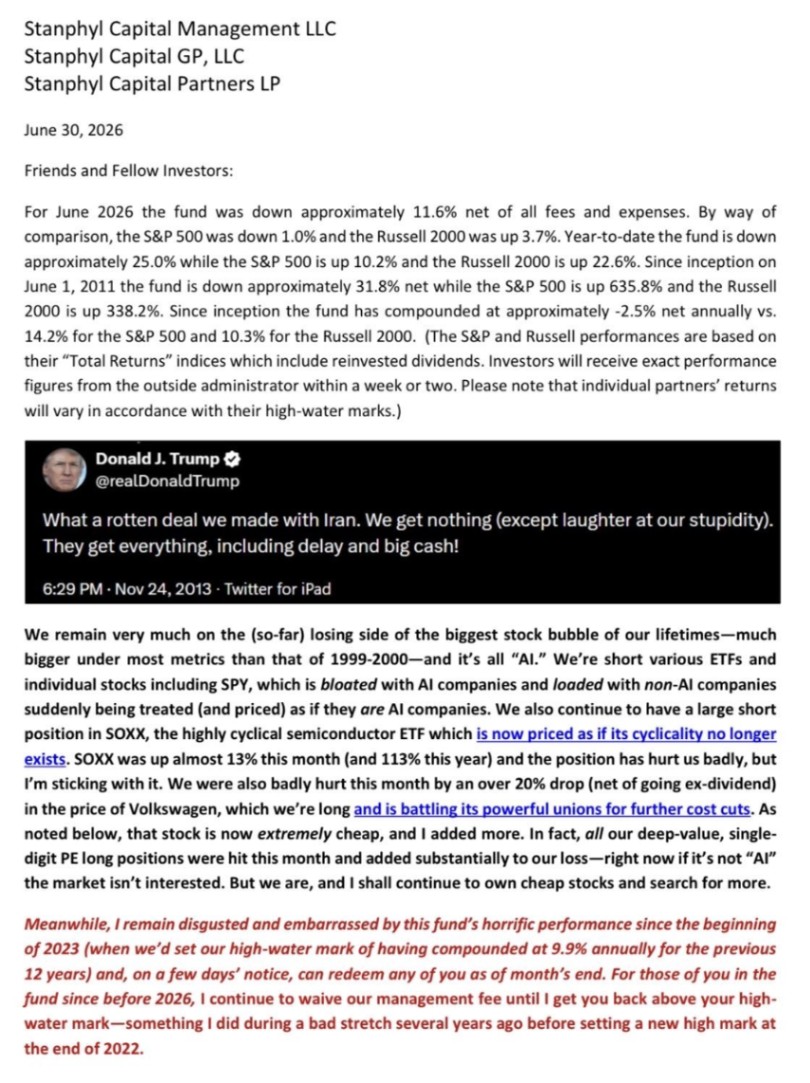
Not so much a laugh but here’s a monthly letter from a US hedge fund that’s been shorting the S&P 500, semiconductors and AI companies (it’s down 25% year-to-date and down 31.8% since 2011 inception).