US stocks are breaking records, so how high can Australian shares go?
With US stocks making records, we check the fundamental and technical factors for the Aussie share market to investigate how high it can go.


Source: Shutterstock
KEY POINTS
- Better than expected inflation data on Thursday in the USA pushed stocks to record highs in New York, bringing forward expectations of the timing and magnitude of US interest rate cuts
- At home in Australia, our interest rate outlook also points to lower rates, but our stock market is yet to make record highs
- We look at the key fundamental and technical factors for the Australian share market to investigate how high it can go
On Thursday several key US stock indices surged to record highs. The catalyst was a better than expected Consumer Price Index (CPI) reading for April that showed inflation in the USA moderated by a larger than expected margin.
At 3.6% p.a., the core CPI, which strips out volatile food and energy components, was down from March’s 3.8% p.a. rate, and it’s at its lowest level in 3 years.
Whilst US inflation is still well above the Federal Reserve’s (the “Fed”) 2% target, April’s CPI print bucks a worrying trend of worse than expected data since January. It has soothed investors’ nerves, all but ensuring the next move in official US interest rates will be down.
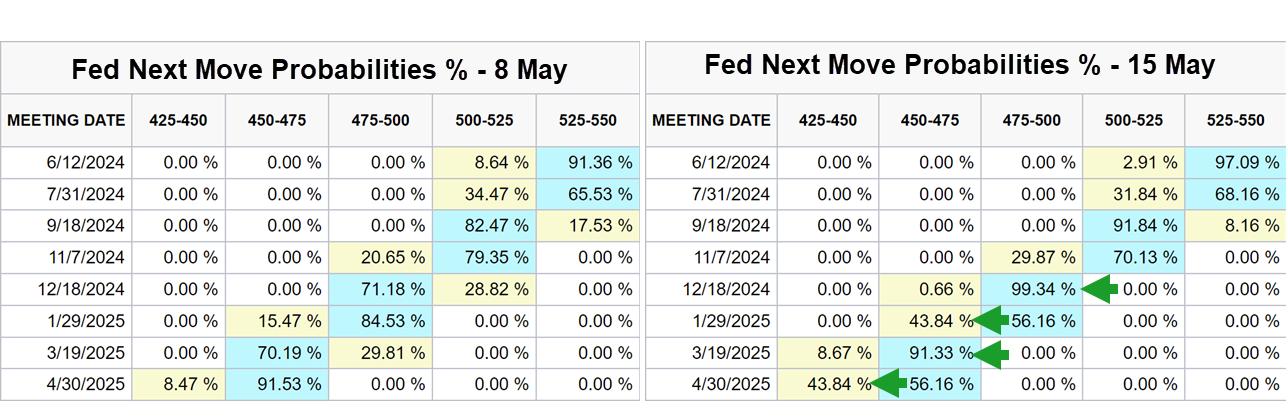
It also improved the possible timing and magnitude of Fed cuts, with pricing in interest rate markets now suggesting greater than a 90% chance that the first 0.25% cut will be in September, and that a second cut in December is a certainty.

30-Day Fed Funds futures pricing 15 May vs 1 week prior. Source: CME. Click here for full size image (for best results, right click and select "Open in new window")
The above comparison between market pricing after the CPI data and from a week prior, shows the timing of the first cut is largely the same for September (82.5% probability versus 92% probability), but that the timing of a second cut has changed significantly.
Previously, markets were tipping an 84.5% chance a second cut would come in January of next year. That’s shifted to a lock in December. As for a third cut, its timing has shifted forward from April 2025 to March 2025 at a 91% confidence rate.
So, it appears that only a small change in inflation data has had a big impact on interest rate expectations, and therefore on stock prices.
Aussie – Oi oi oi?
What’s the situation in Australia? Certainly, lower inflation in an economy as influential as America’s helps us too. Our central bank, the Reserve Bank of Australia (RBA), has made it very clear that they’re still line ball on rate hikes versus cuts noting they “can’t rule anything in or rule anything out”.
Market pricing in local interest rate markets is still predicting cuts are more likely than hikes, however. Judging by the ASX 30 Day Interbank Cash Rate Futures Implied Yield Curve, markets are predicting our first 0.25% cut could come by April 2025, with a second cut by priced in by October 2025.
The local benchmark S&P/ASX 200 hasn’t quite followed its US counterparts to a record high, but it’s not far off at the time of writing. Will Aussie investors be rewarded for their patience, or is our share market destined to continue to be a laggard?
Let’s take a look at the fundamental and technical factors that may help us determine just how high the S&P/ASX200 can go.
Fundamental factors: Watch the Market P/E
There are several metrics we can use to measure the value of an entire share market index. The most common is the P/E Ratio or “price to earnings'' ratio. Check out this article for a refresher on the P/E Ratio and how to use it to better understand the value of stocks and stock indices.
Basically, a higher P/E Ratio implies the asset being valued is more expensive, while a lower P/E Ratio implies it is less expensive. When considering the P/E Ratio of an entire index, analysts take the aggregate EPS of all stocks within the index and divide this value by its price.
There are a few widely accepted guideposts for benchmark index valuations. Index P/E Ratios above 20 are considered to signal stocks are expensive and have coincidentally matched up with several major market corrections.
On the other hand, index P/E Ratios below 10 are considered to signal stocks are cheap and have coincidentally matched up with several major bear market lows. If an index is trading with a P/E Ratio of 15, it is generally considered to be “fair value”.
According to major broker Macquarie, their “Market PER” for the S&P/ASX 200 is currently 16.6 times based upon the most recent six-month reporting period ending on December 31 2023. It jumps to 17.7 times when considering the broker’s forecasts for index earnings in FY24 which ends on June 30.
This implies that Aussie stocks are more expensive based upon FY24 earnings compared to CY23 earnings. It’s important to note here that markets look forward not backwards, and therefore I suggest the FY24 number is a better one to use when considering the S&P/ASX 200’s valuation.
This means that at a Market PER of 17.7, Aussie stocks are currently somewhere between fair value and expensive.

Macquarie’s CY23 and FY24 Market PER versus the S&P/ASX200. Source: Market Index and Macquarie Research
The trend in Macquarie’s FY24 Market PER is roughly flat to slightly down since it peaked at 18.2 on 5 March. The S&P/ASX 200 was at 7735.8 on that day, it’s likely to close around 7870 today.
So, we can infer that Macquarie has upped its earnings forecasts for FY24 slightly to enable the Market PER to decline even as the benchmark index has moved higher. This raises an important point – neither share price nor earnings are static. Earnings forecasts are always being updated and share prices are always moving to reflect this.
But indulge me here, if we were to assume earnings are going to stagnate for the foreseeable future, how high can Aussie share prices go before the S&P/ASX 200 can be classified as expensive, that is, with a Market PER of greater than 20 times?
The answer is 8,897. That’s roughly 1,000 points higher than where we are right now, or 13%. This suggests there’s plenty of leeway before we need to sound the alarm that Aussie shares are expensive!
Technical factors: The trend is your friend
Now to my favourite bit! Let’s start with the daily chart.

S&P/ASX 200 daily chart
First, trends. My trend ribbons indicate the short and long term trends are up. Importantly, each appears to be doing its job of supporting the price. This indicates a prevailing state of excess demand across both timeframes.
Next, price action. I note rising peaks and rising troughs. This indicates a buy the dip mentality among market participants, and the ratio of gains versus pullbacks indicates strong demand and weak supply.
Finally, the candles. I can see a predominance of demand-side candles (i.e., those with white bodies and or downward pointing shadows). This indicates there are likely large buy-side algorithmic orders working into the market, against limited supply.
7,911 is a clear and important point of supply – it’s the all time high and a point where many probably regret not getting out on the day it was set. Some of those investors may choose to get out the next time we touch it.
Assuming there’s ample demand to deal with these sellers, a close above 7,911 would put us into blue sky territory.
7,714 is now the key point of demand, along with the dynamic demand I’d expect at the short term uptrend ribbon. As long as the S&P/ASX 200 continues to close above these points, the short term uptrend remains intact.
Let’s zoom out to the weekly chart now.

S&P/ASX 200 weekly chart
It’s just as healthy, with largely consistent trends, price action, and candles as the daily chart. There’s absolutely nothing in this chart that tells me the Australian share market can’t continue higher – it is for the most part a picture of excess demand.
As for big picture targets, can we give the 8,897 “expensive” level a shake? To answer this question, I like to use a technical analysis technique called a measured move. This involves projecting a recent price increase to a major peak from a recent major trough.
There’s a few choices here, and this is largely a discretionary process. But if I take the move from the 6,751 low to the 7,911 peak, that is, 1160 points, and project it from the 7,490 trough (you could use 7,322 or even 7,633 – so let’s split the difference and go with 7490!), then I get a measured move target of 8,650.
That’s a gain of 780 points or about 10% from current levels. Not completely at odds with the fundamentally expensive target. I suspect either scenario would be gleefully accepted by Aussie investors!
Your guess is as good as…
History suggests markets prefer falling interest rate environments to rising ones. As far as one can best tell from the data at hand, we are more likely on the verge of such a period. But the future is unknown, share prices, earnings, and even perceptions of value are always shifting.
We’ve done some broad stroke analysis of the fundamental and technical possibilities here, but investors must stay on their toes and remain appraised of these factors going forward. To be forewarned is to be forearmed!
